Latest news about Bitcoin and all cryptocurrencies. Your daily crypto news habit.
(1) Coinbase Pro provides the best bitcoin liquidity and execution opportunities in the cryptocurrency market. Bitstamp and Kraken are a very good choice for institutional and retail investors respectively. Bitfinex offers deep liquidity at the top of the book.
(2) Liquidity is an important criterion for selecting an exchange because it is easier to produce artificial (fake) volume than artificial liquidity, which generally implies a market risk for a fraudulent exchange.
(3) The analysis of order book dynamics is illustrative of how price discovery works. The ecosystem is highly correlated and originating price shifts trigger almost immediate price movements on other exchanges. However, the high reported volume doesn’t automatically mean price discovery. The spike on April 2, 2019, was likely to be originated on Bitfinex, while other exchanges followed the trend.
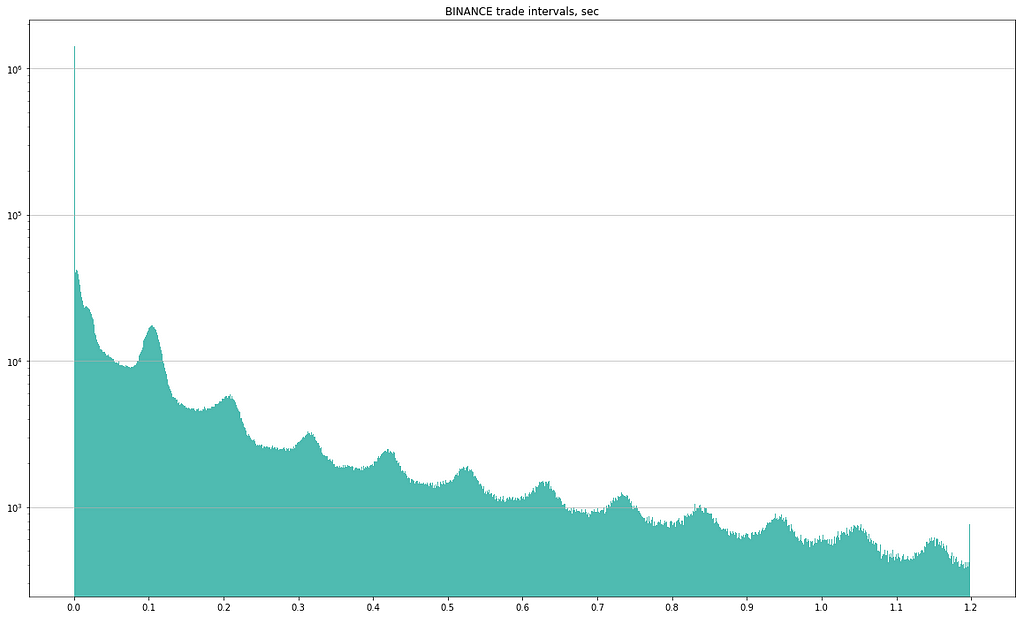
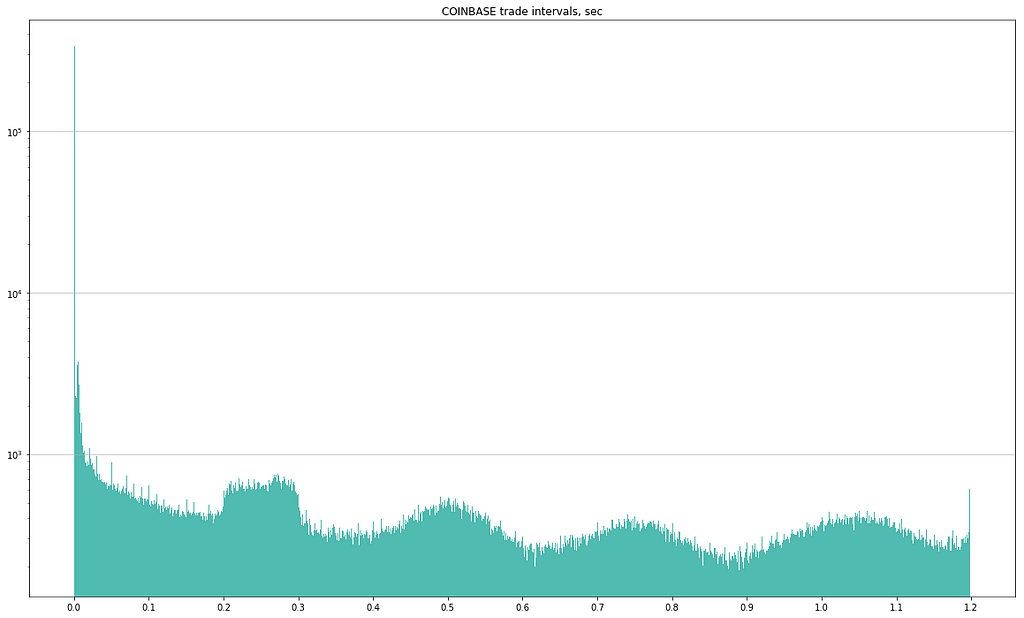
(4) Binance has a very odd histogram of intervals between consequent trades. It looks like a sinusoidal function with a descending trend. However, other exchanges have suspicious outliers, too.
The analysis is based on the BTC/USD (BTC/USDT in case of Binance) data from 0:00 UTC 12-Apr-2019 till 0:00 UTC 17-Apr-2019 across six selected exchanges:
- Binance
- Bitfinex
- Bitstamp
- Bittrex
- Coinbase Pro
- Kraken
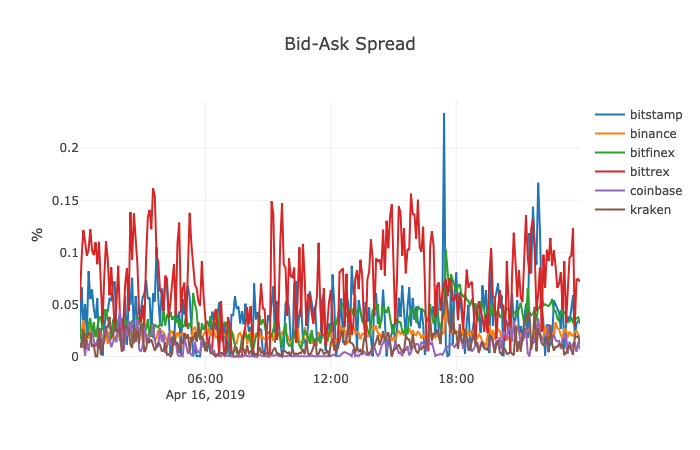 Best bid-offer spread. Source: Crypto IntegrityThe content:
- Why liquidity matters?
- Liquidity metrics
- Liquidity scoring
- Analysis & Results
- Bitcoin price spike on April 2, 2019
- Data
- Known issues
Why liquidity matters?
Liquidity measures the ability to buy/sell an asset without a significant impact on price. We have already written why liquidity matters but let us give you an illustration one more time. Say, the current bid-ask spread is 5%. What does it mean for a trader or an investor? If one wants to buy at market an asset XXX for $100 and if the price does not change at all, one will have to sell XXX for $95, not taking into account exchange fees and slippage. In other words, XXX must appreciate by at least 5% (to be more precise, by 5.3%) before an investor will be able to sell it without a loss.
In addition, liquidity shows the existing demand and supply that eventually influence the price. It may not be obvious, however, liquidity does give a good insight into the mechanics behind price discovery. It is a secret to no one that most crypto exchanges just copy the prices from major exchanges — arbitrageurs, as well as market makers, do their job well. It is the major exchanges where a real demand meets a real supply to agree on a price. The question here is what is a major (and leading) exchange?
- Shall we look at their reported volumes? We have already written in our February study on fake volume that reported volume is a poor indicator.
- Shall we look at the balances and activity of their wallets? It may shed a light on the trustworthiness of an exchange — how eager are users to store their assets on this exchange. Besides, it may indicate some anomalies in the ratio of reported volume to the client assets in comparison to other exchanges. Reputable exchanges are expected to have a lower ratio. Yet it gives us little information about liquidity and price discovery.
- Shall we look at the number of visitors to the exchange’s website? subscribers in Twitter or Telegram group? Although all these numbers may be inflated as well, they can help to estimate the popularity of the exchange. However, popularity has only an indirect bearing upon the price discovery and liquidity.
We are positive it is the order book that is illustrative of how price discovery works. The analysis of the order book’s depth and its dynamics gives primary insights into the mixture of retail, institutional, and algorithmic flows, which finally define the current price of an asset.
Liquidity metrics
We have developed a system that calculates 8 liquidity metrics based on reported trades and order books (definitions are below):
- Bid-ask spread, %
- Bid-ask spread by 10 BTC, %
- Bid-ask liquidity, BTC
- Handy liquidity, BTC
- Trading volume, BTC
- Number of trades
- Trade sizes distribution
- Order book disequilibrium
Bid-ask spread, %, is calculated as:
(best ask — best bid) / [(best ask + best bid) / 2] * 100.
More liquid assets have narrower bid-ask spreads. However, the bid-ask spread may appear narrower on exchanges with smaller price step. Bittrex has a price step of $0.001. Binance, Bitstamp, Coinbase Pro have a price step of $0.01. Bitfinex and Kraken have a price step of $0.1.
Bid-ask spread by 10 BTC, %, is calculated as:
(ask — bid) / [(ask + bid) / 2] * 100,
where ask and bid are weighted average prices for the aggregated volume of 10 BTC. More liquid assets have narrower spreads.
Bid-ask liquidity, BTC, is the cumulative volume of all orders in an order book at the best ask and at the best bid prices. More liquid assets have higher bid-ask liquidity.
Handy liquidity, BTC, is the cumulative volume in an order book at levels remote from the naive mid-market price by 0.1% or less. More liquid assets have higher handy liquidity. Handy liquidity of 0 means that the bid-ask spread is wider than 0.1%.
Disequilibrium is calculated as:
(ask_liq — bid_liq) / (ask_liq + bid_liq),
where bid_liq is a sum of bids above midprice * (1–0.1%), ask_liq is a sum of asks below midprice / (1–0.1%). While a single value of the metric shows the current buyers or sellers prevalence, the dynamics of the metric reveals the changes in supply and demand.
We do not consider fees, although they do impact the bid-ask spread. It may be assumed that market makers can either reach the lowest possible tier (0% in some cases) or enter into a customised agreement with the exchange, thus, lowering the impact of fees. At the time of writing this article, the lowest possible fees for makers (as publicly disclosed) were as follows:
- Binance: 0.02% if 150,000 BTC or more is traded (in the last 30 days); 0.015% if paid in BNB
- Bitfinex: 0% if $7,500,000.00 or more is traded
- Bitstamp: 0.10% if $20,000,000 or more is traded (however, Bitstamp offers customized fee arrangement for market makers).
- Bittrex: 0.25%
- Coinbase Pro: 0% if $50,000,000.00 or more is traded
- Kraken: 0% if $10,000,000.00 or more is traded
Liquidity scoring
The maximum score is 8 points, and the minimum score is 0 points. A higher score means higher liquidity, which is good. Each metric gives a score of 0, 1, or 2. As our analysis covers 6 exchanges, the following approach is suggested:
- two exchanges with highest scores per metric are assigned 2 points;
- two exchanges with the worst scores per metric are assigned 0 points;
- other two exchanges are assigned 1 point.
Total scoring = bid-ask spread scoring + bid-ask liquidity scoring + bid-ask spread by 10 BTC scoring + handy liquidity scoring
Retail scoring = bid-ask spread scoring + bid-ask liquidity scoring
Institutional scoring = bid-ask spread by 10 BTC scoring + handy liquidity scoring
 The resulting liquidity scoring. Source: Crypto Integrity
As one may see, Coinbase Pro offers the best liquidity for both retail and institutional investors. Bitstamp and Kraken follow: Bitstamp is better for institutional clients while Kraken offers better liquidity for retail clients. Surprisingly, Binance has got a low score despite the high reported volume and narrow observed spreads. Bittrex lags behind with the probable explanation being high fees and lack of market maker incentives.
Analysis & Results
During the observed period (from 12-Apr-2019 0:00 UTC to 17-Apr-2019 0:00 UTC, 5 complete days in total), the following metrics were calculated for the selected exchanges. All values are the mathematical average.
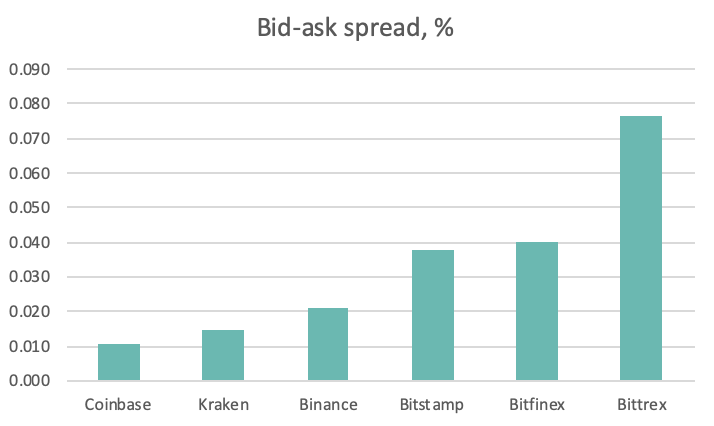
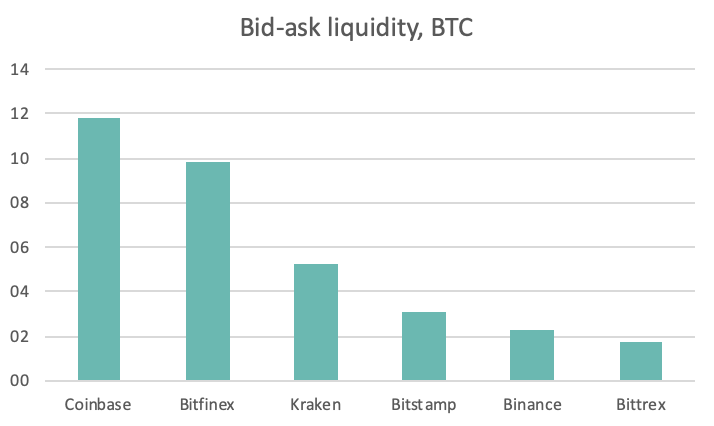 Bid-ask spread and bid-ask liquidity. Source: Crypto Integrity
For retail clients, it is important to be able to quickly execute small sizes at best bid or offer, thus, best bid-ask spread and the amount at best levels are important. While Coinbase Pro is the leader, Kraken and Binance also offer narrow spreads. However, on average, the total amount of best bid and ask levels on Binance is only 2 bitcoins, while Coinbase has 11, Bitfinex 10, and Kraken 5 BTC. Consequently, if you need to buy or sell less than 2 bitcoins, your best choice is Coinbase Pro, Kraken or Binance. If you need to make a transaction up to 10 BTC, you’d better turn to Coinbase Pro or Bitfinex.
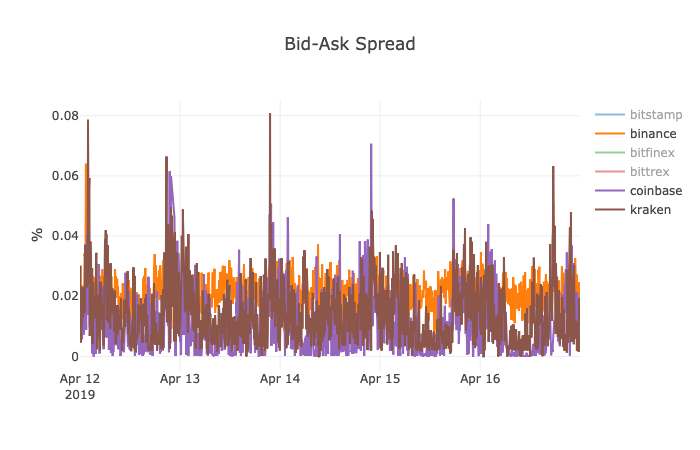 Bid-ask spread on Binance, Coinbase, Kraken. Source: Crypto Integrity
It is noteworthy that Kraken closely follows Coinbase spread (or vice versa) with Kraken’s spread being generally a bit wider. In contrast, Binance has a very stable bid-ask spread of about 0.02%, as if market volatility doesn’t impact its market maker(s).
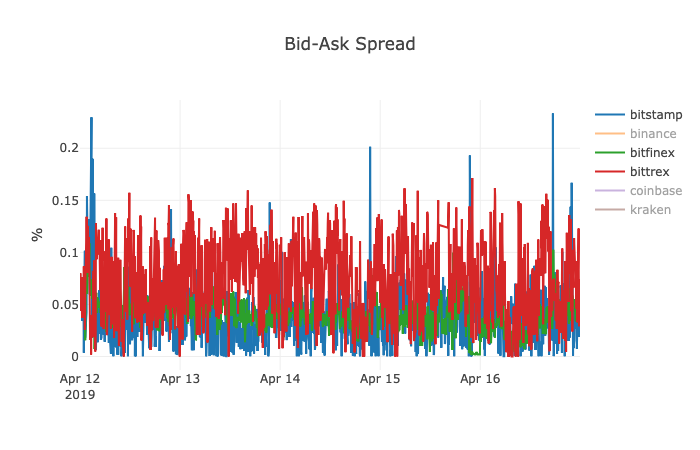 Bid-ask spread on Bitfinex, Bitstamp, Bittrex. Source: Crypto Integrity
The second group of exchanges tend to offer a wider spread. The data shows that Bittrex is definitely an outsider. The spread on Bitstamp is more volatile than that of Bitfinex.
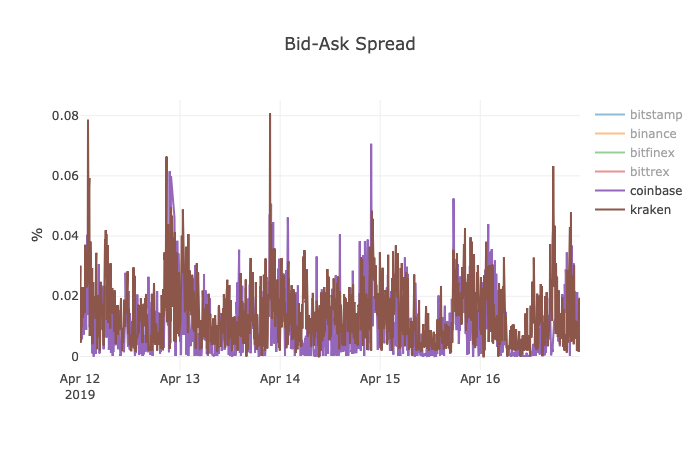
 It seems there is a correlation between the bid-ask spread on Bitfinex & Binance and Kraken & Coinbase. Source: Crypto Integrity
As mentioned above, the narrowing and widening of a spread on Coinbase and Kraken appear to correlate (see the left picture above). Similarly, the spread seems to be correlated on Binance and Bitfinex, although to a lesser extent. May it be explained by the fact that the first two exchanges support fiat USD, including unlimited cheap deposits and withdrawals, while the second pair is mainly USDT focused?
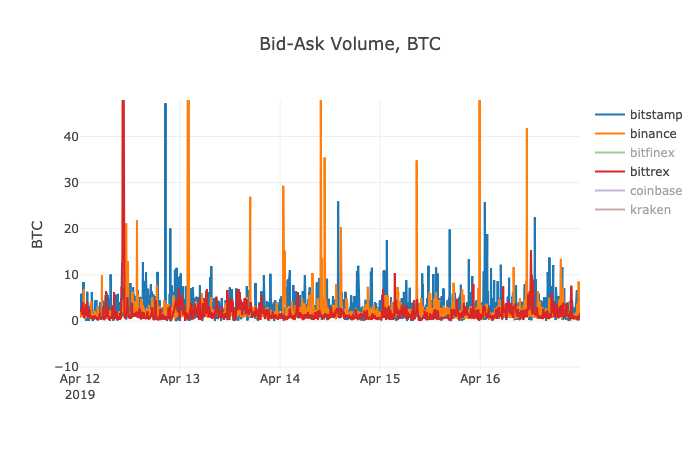
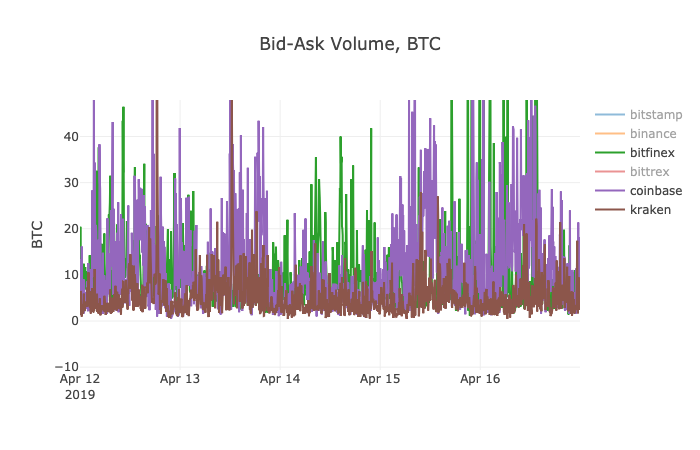 The volume on best bid and ask levels (two groups of exchanges). Source: Crypto Integrity
The analysis of bid-ask liquidity shows that there are two groups of crypto exchanges. Coinbase, Bitfinex and Kraken tend to have more liquidity present at top of the order book than Bitstamp, Binance and Bittrex. However, do not forget that the price step varies from exchange to exchange.
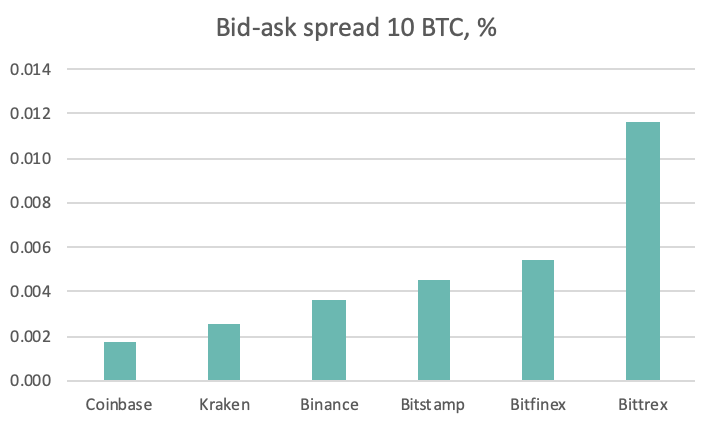
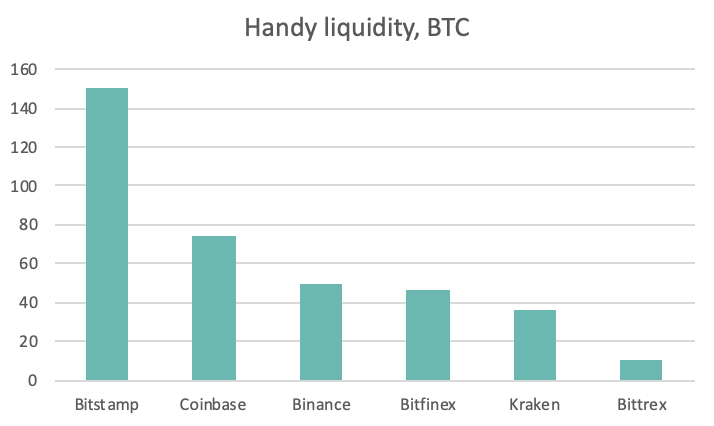 Bid-ask spread by 10 BTC and Handy liquidity. Source: Crypto Integrity
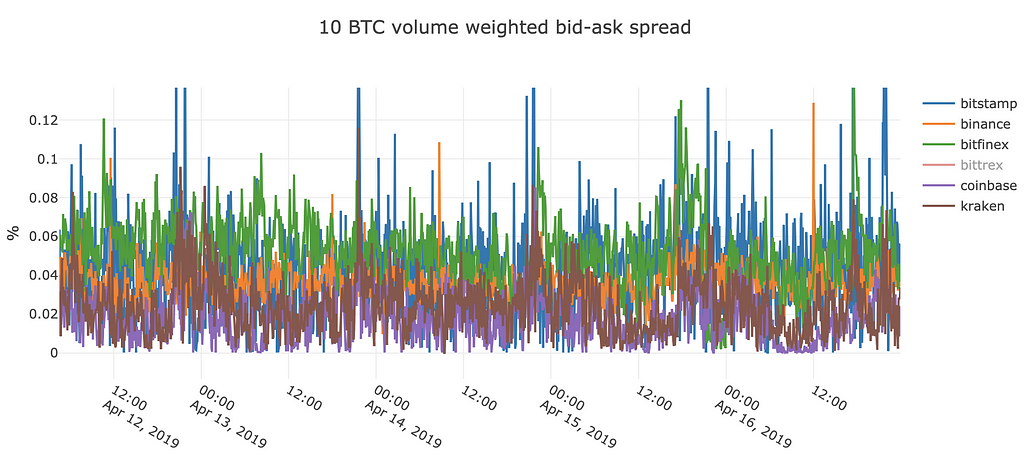
For institutional clients, it is important to be able to execute bigger sizes with a little price impact, thus, they look at volume weighted bid-ask spread (by 10 BTC) and handy liquidity (sum of bitcoins that can be sold/bought with the price impact of <0.1%). Coinbase has again the narrowest VW BA spread, Kraken, Binance, Bitfinex and Bitstamp drag behind. However, it is Bitstamp that offers the deepest handy liquidity.
 Summary of liquidity metrics. Source: Crypto Integrity
* Please note that we used to collect only 10 levels of the order book on Kraken for the observed period. Starting from 17-Apr-2019, we dump 100 levels of data. Handy liquidity for April, 17th, was around 77 BTC.
Trading volume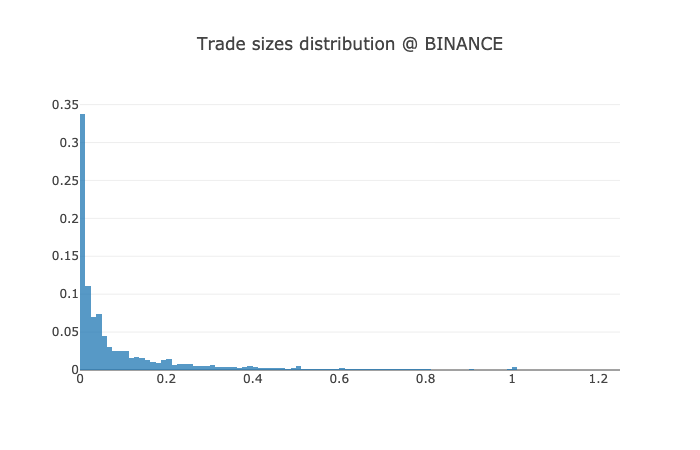
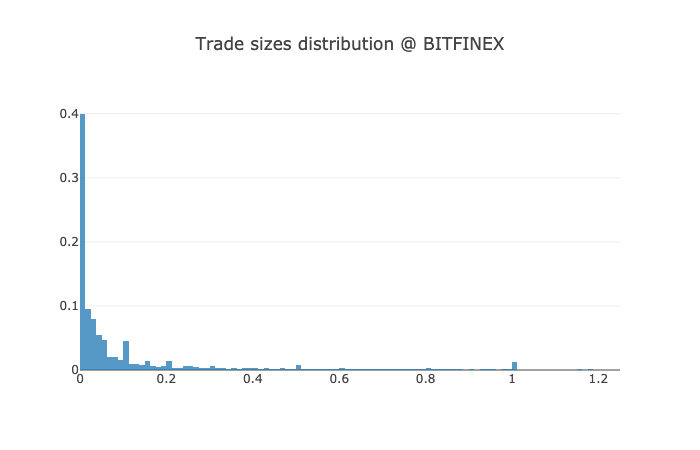
 Distribution of trade sizes (100 bars; OY is frequency, OX is a size in BTC): Binance, Bitfinex, Bitstsamp. Source: Crypto Integrity
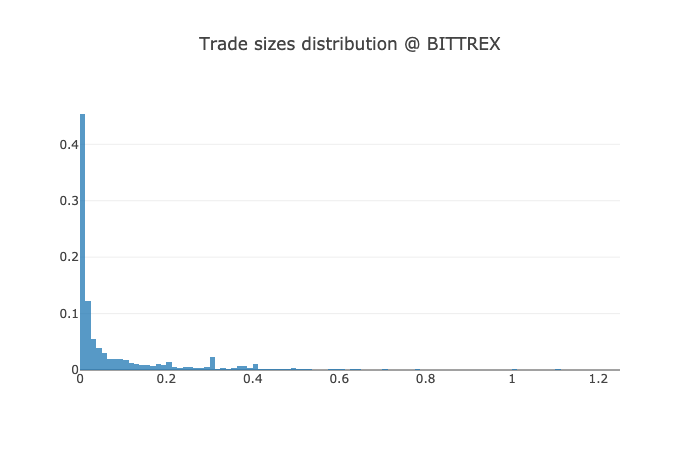
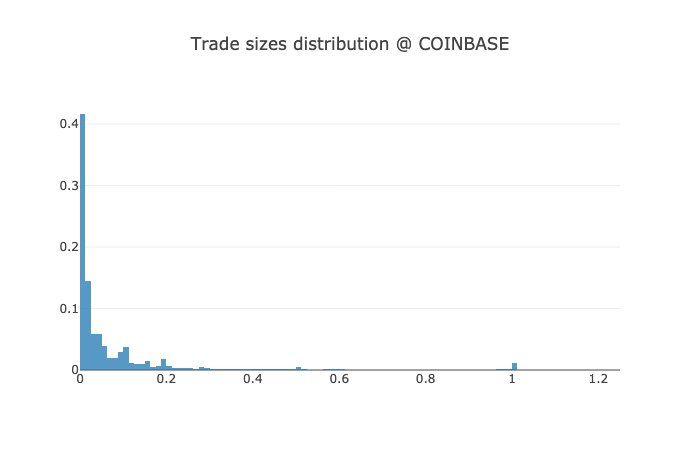
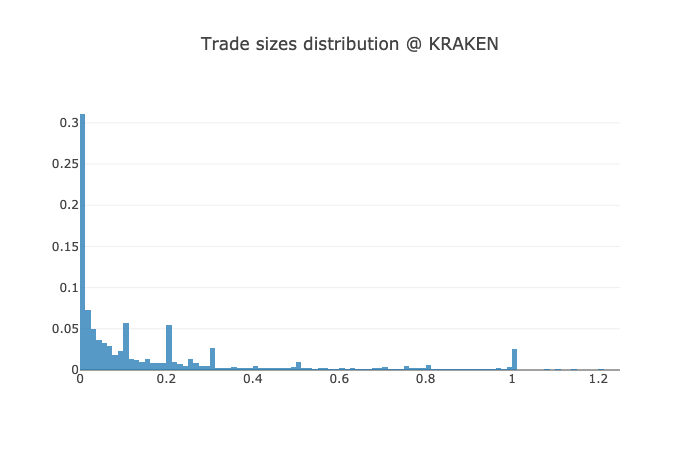 Distribution of trade sizes (100 bars; OY is frequency, OX is a size in BTC): Bittrex, Coinbase, Kraken. Source: Crypto Integrity
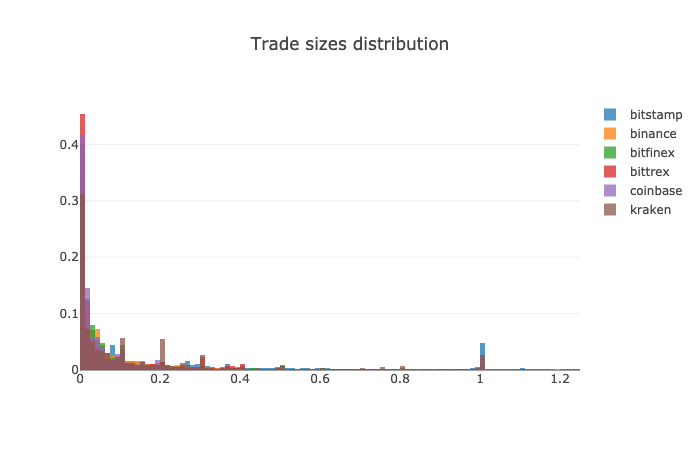 Distribution of trade sizes (100 bars; OY is frequency, OX is a size in BTC). Source: Crypto Integrity
Although Bitstamp has a lot of trades of 1 BTC while Bittrex and Binance have few trades of such size, the distribution of trade sizes has a similar profile across all 6 exchanges. In contrast, the size of an average trade differs. Binance and Bittrex have the smallest trade size (0.14 BTC and 0.15 BTC respectively), which might be explained by their wide retail client base, while Bitstamp has the biggest (0.52 BTC), which might be explained by the high share of algorithmic traders or institutional flow during the observed period.
 Trade volume vs the number of trades. Source: Crypto Integrity
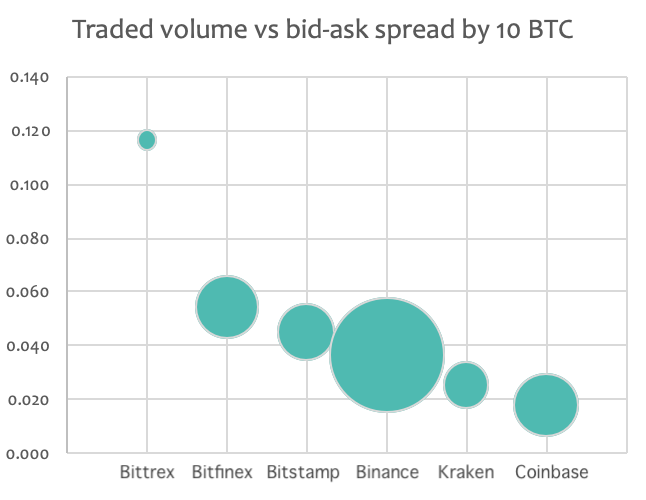 Reported trade volume (ball size) vs 10 BTC bid-ask spread (OY). Source: Crypto Integrity
The profiles of 30-day trailing volume look similar. However, Binance and especially Bittrex seem to have enjoyed the volume spike at the beginning of April to a lesser extent than other selected exchanges (we wrote more about volume profile, fake volumes and price discovery here).
 30-day trailing volume, USD. Source: Coinmarketcap
 30-day trailing volume — Binance (left) and Bitfinex (right). Source: CoinGecko
 30-day trailing volume — Bitstamp (left) and Bittrex (right). Source: CoinGecko
 30-day trailing volume — Coinbase Pro (left) and Kraken (right). Source: CoinGeckoTrade frequency distributions
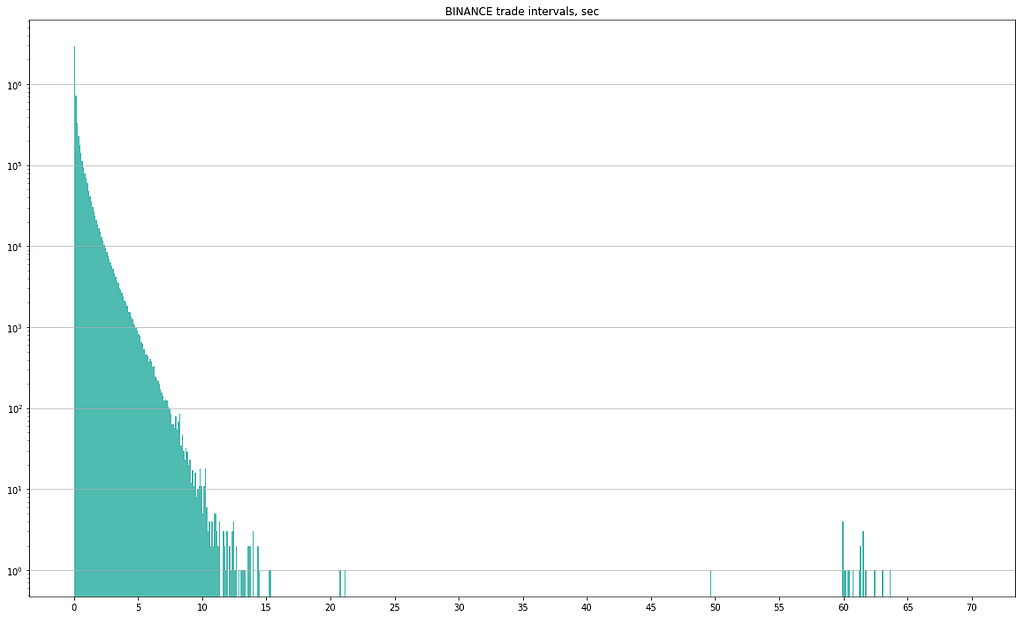
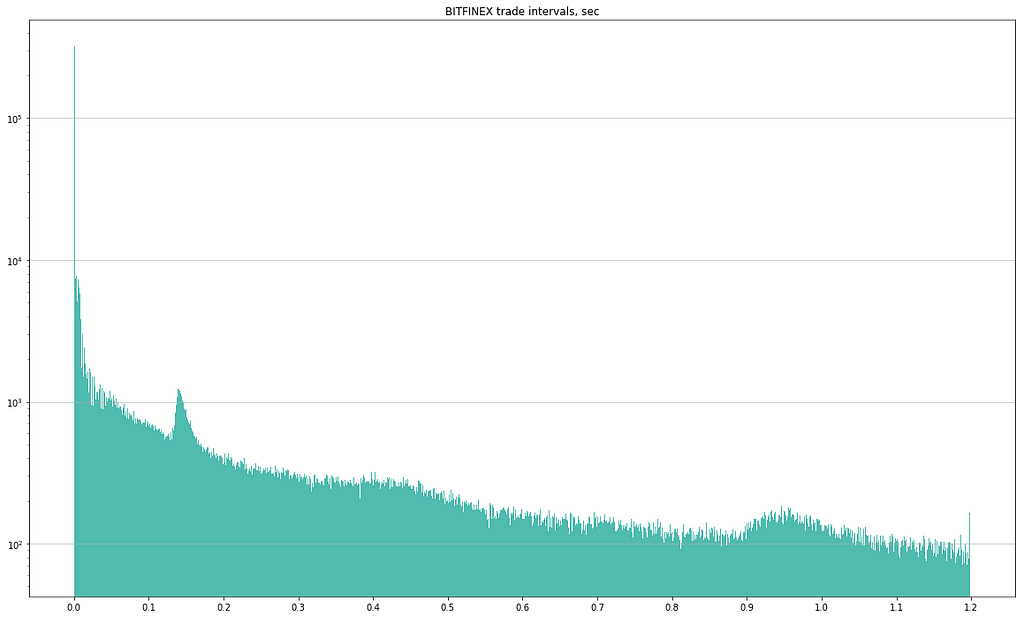
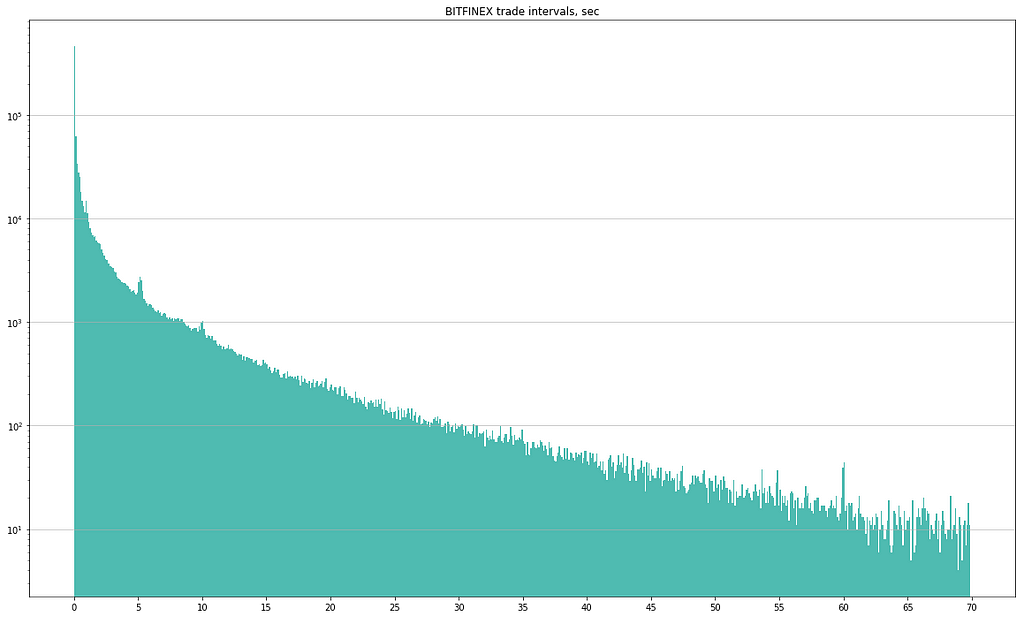
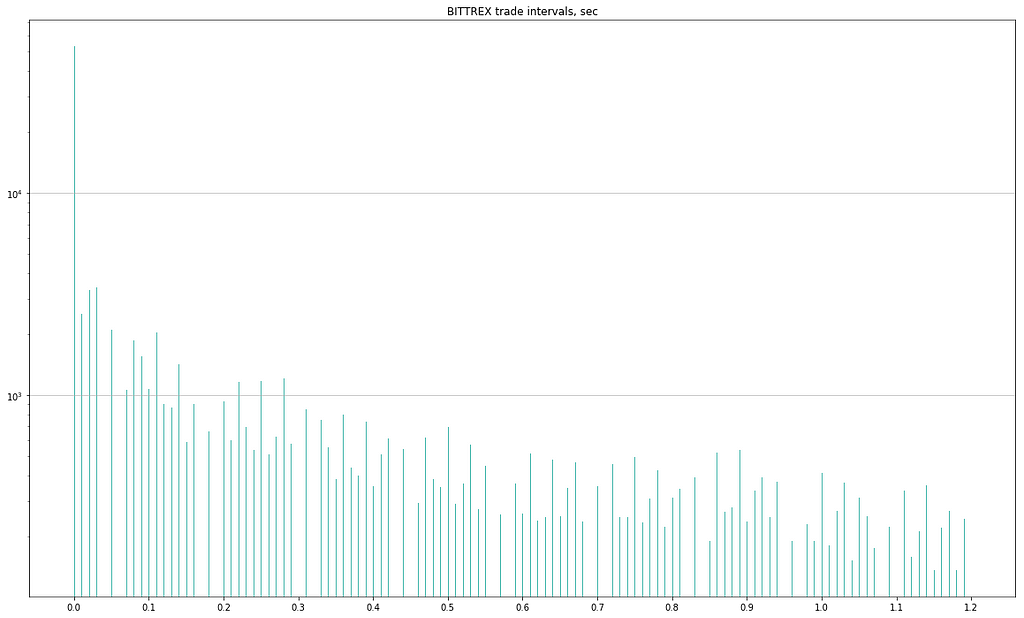
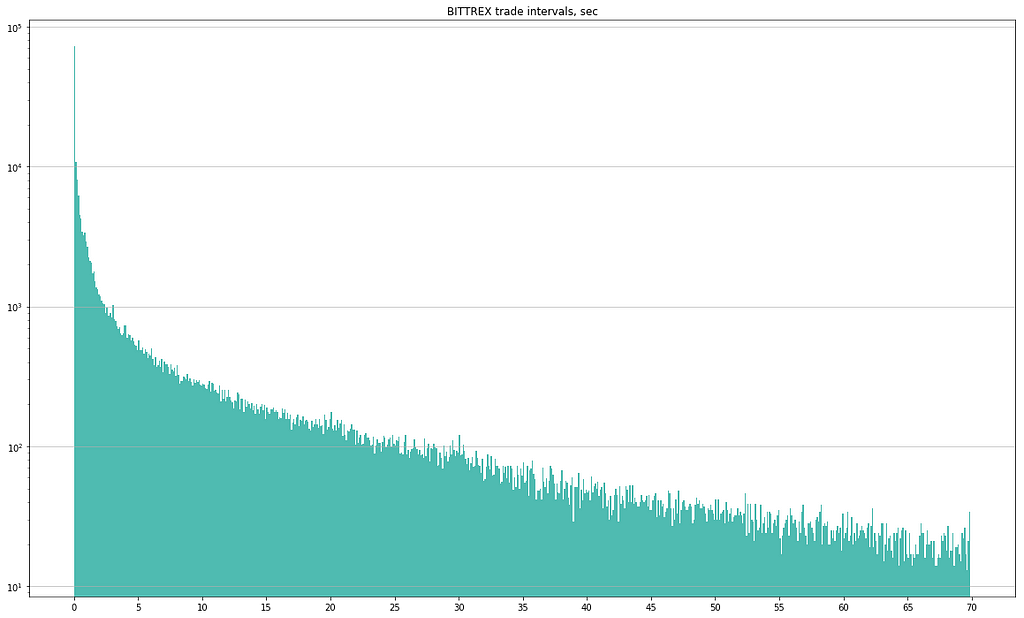
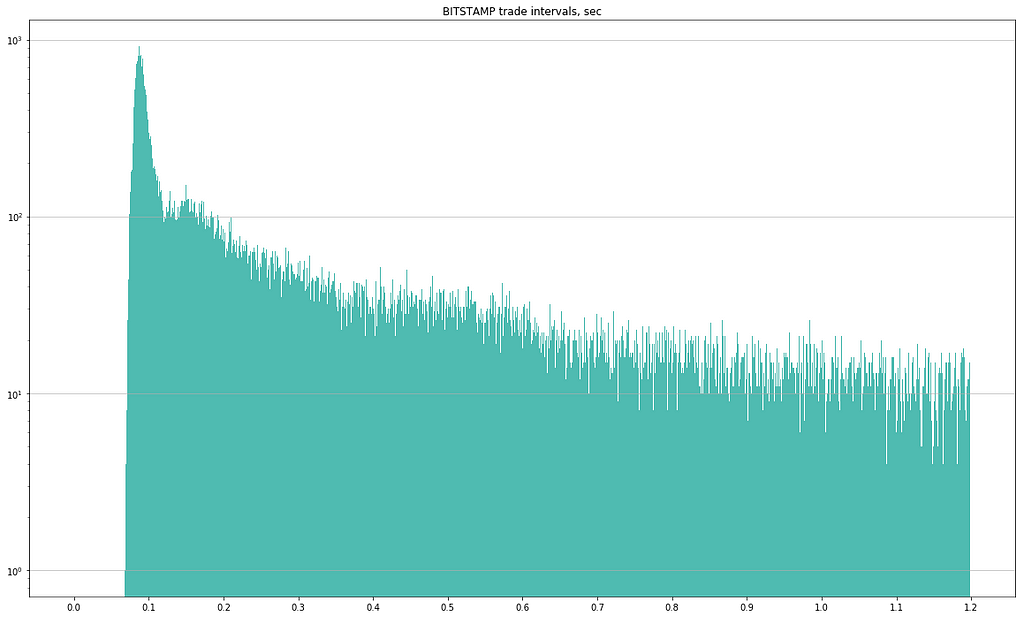
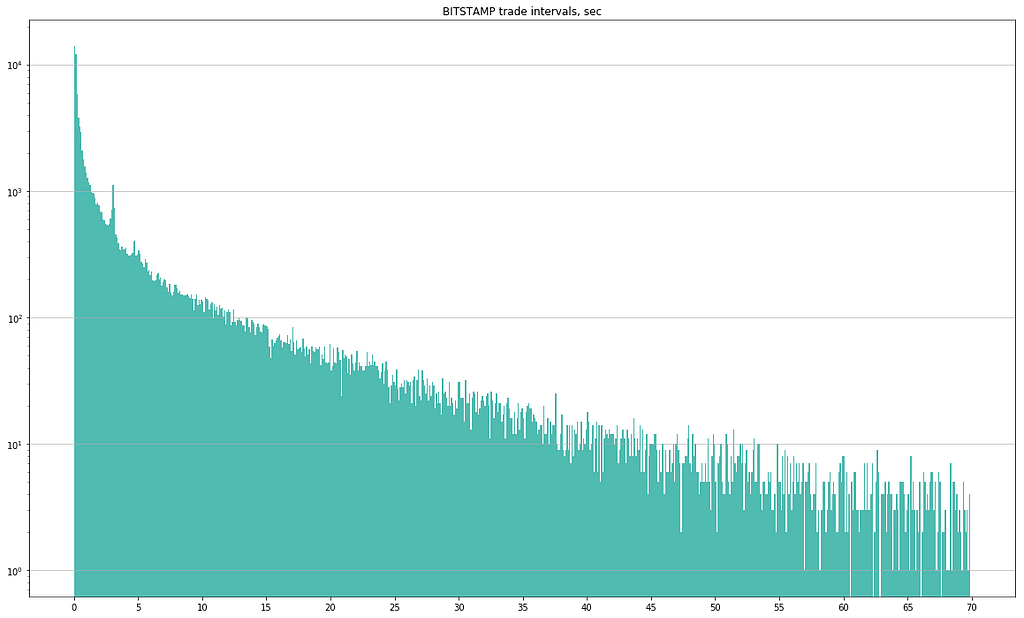
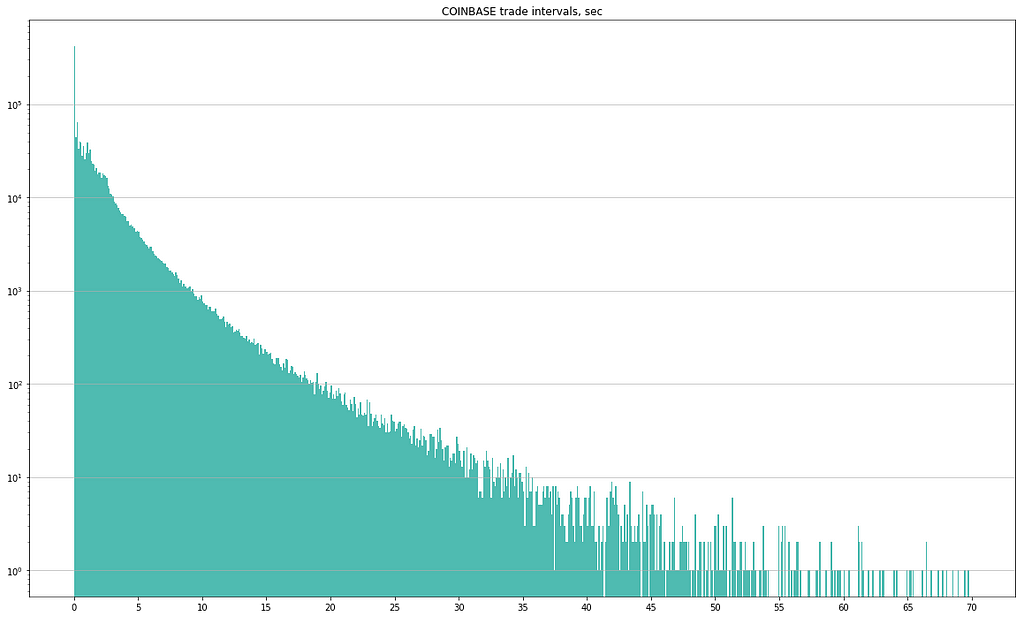
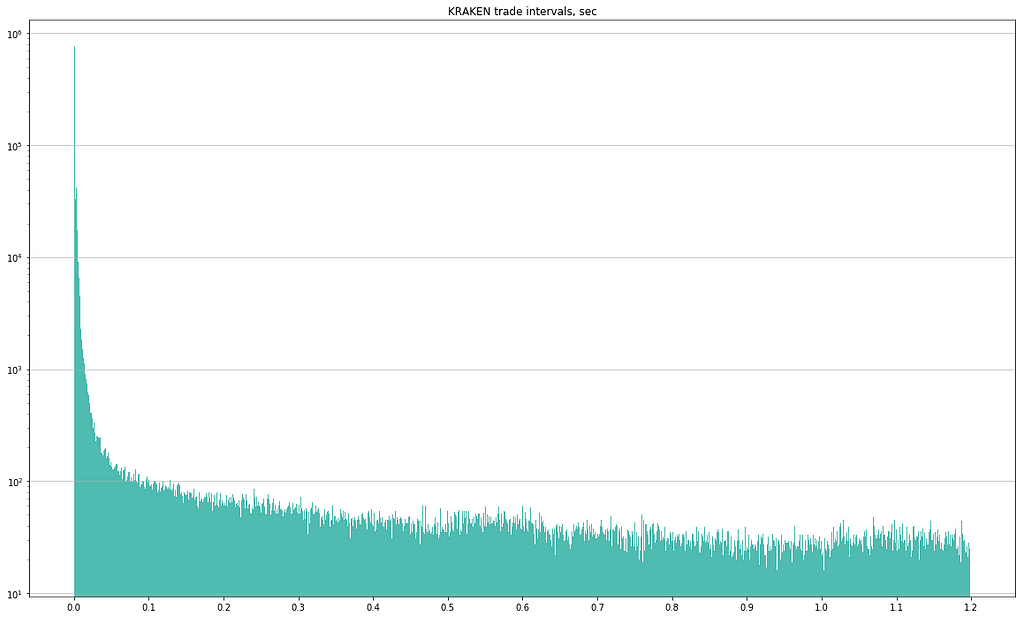
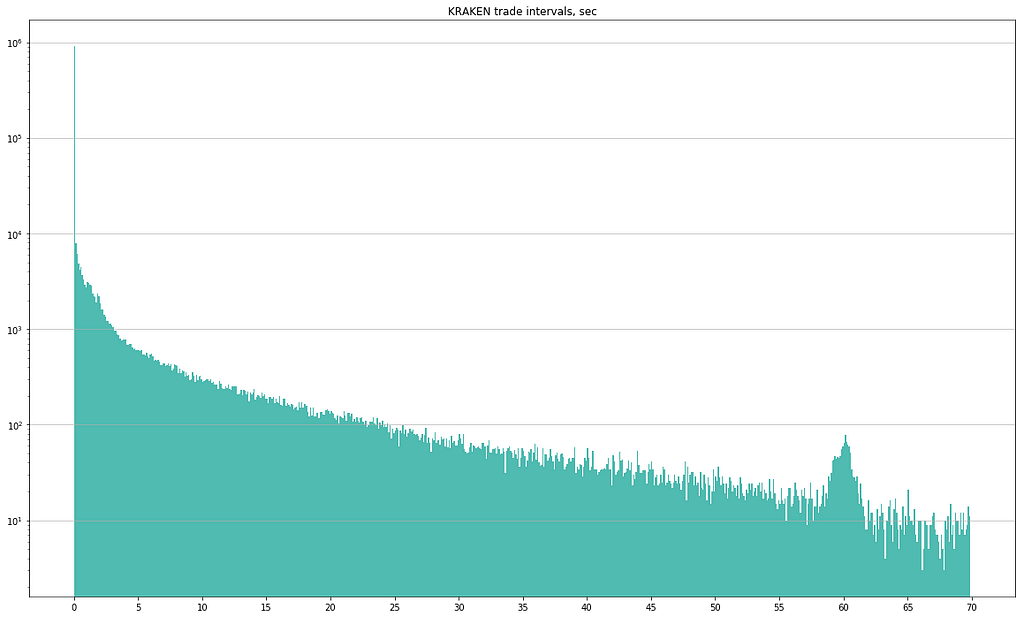
The following charts of trade frequency distributions are based on data collected from 17-Mar-2019 0:00 UTC till 17-Apr-2019 0:00 UTC. We have focused on two scales: from 0 to 1.2 sec and from 0 to 70 sec. Each histogram has 1000 bars. We have identified some peculiarities that are worth mentioning:
- Binance has a very odd histogram of intervals between trades on both scales. The first one looks like a sinusoidal function with a descending trend. The second one differs significantly from that of peers, as there almost no trades that occur less frequently than 15 seconds.
- Bitfinex has several outstanding frequencies, which are especially popular: around 150 ms, 950 ms, 5 and 10 seconds.
- Bitstamp has a minimal interval of ~70 ms between the two consequent trades. Besides, it has a high number of traders occurring every ~3 seconds.
- Coinbase has a profile that is similar to Binance to some extent.
- Kraken has a very high number of traders occurring every ~60 seconds.
There might be some explanations for these observations. First, the matching engine may match orders with regular intervals rather than instantly (most likely, it’s the case of Bitstamp). Second, if the timestamp is stamped at the level of a gateway, a gateway may have a specific algorithm to batch messages (trades) before sending them via WS (Binance?). Third, market participants may use algorithmic orders such as TWAP, which generate trades with regular intervals. Nevertheless, without further feedback and disclosure from the exchanges, these outliers look suspicious and hardly justifiable.
The bitcoin price spike on April, 2
The 20% spike in bitcoin price on April 2, 2019, has also led to the dramatic increase in the overall trading activity (we have even written an article on another metric to detect fake volume owing to this spike). Let’s have a closer look at what was going on during this event at a micro level (Kraken is excluded from this analysis because we have no data for the period).
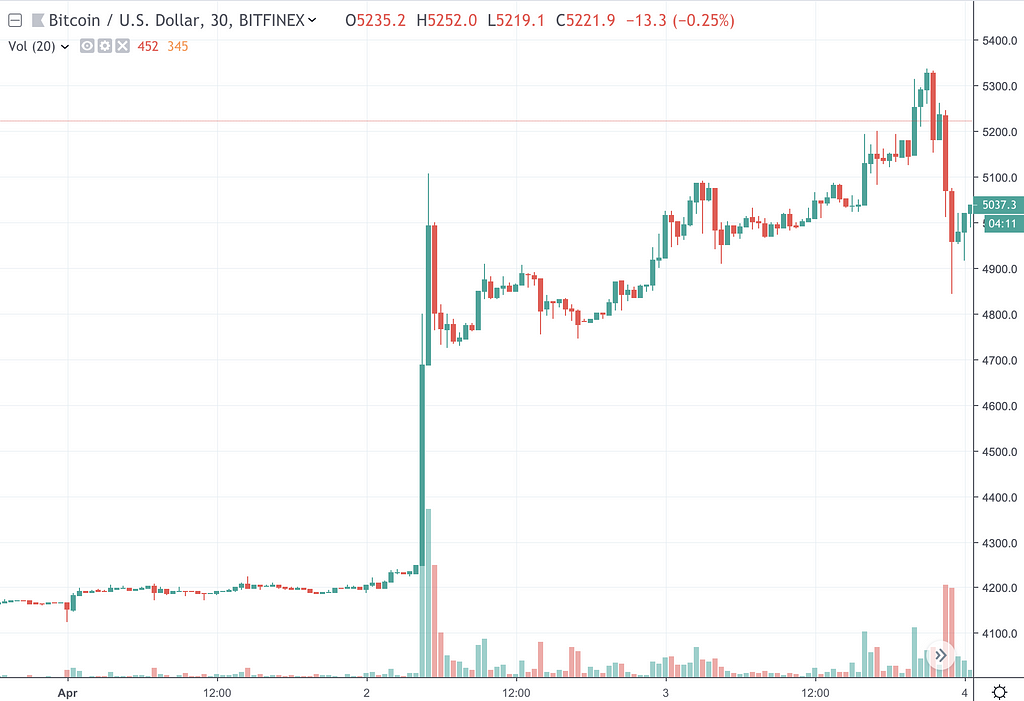 Bitfinex BTC/USD price & volume chart (1–3 April 2019). Source: TradingView
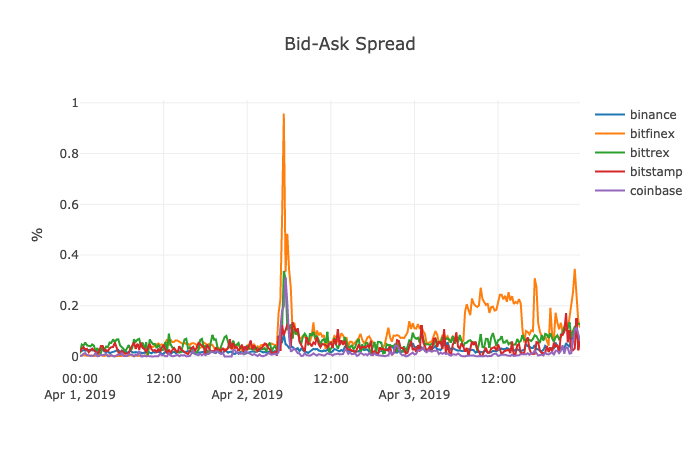 Best bid-offer across selected exchanges on 1–3 April 2019. Source: Crypto Integrity
As seen on the chart, the price jump corresponds to the widening of a bid-ask spread on all selected exchanges, which is expected. The strange thing here is the widened spreads on Bitfinex from 7:30 to 15:30 UTC, although the price fluctuations were low and the volume was low, too. The same lull was observed on other exchanges (have a look at Coinbase Pro chart below). One of the explanations may be technical issues of a single market maker that has to quote narrow spread while other makers have no such obligations. To the best of our knowledge, Bitfinex has no official market making program, which makes us think it might be a case of an affiliated market maker.
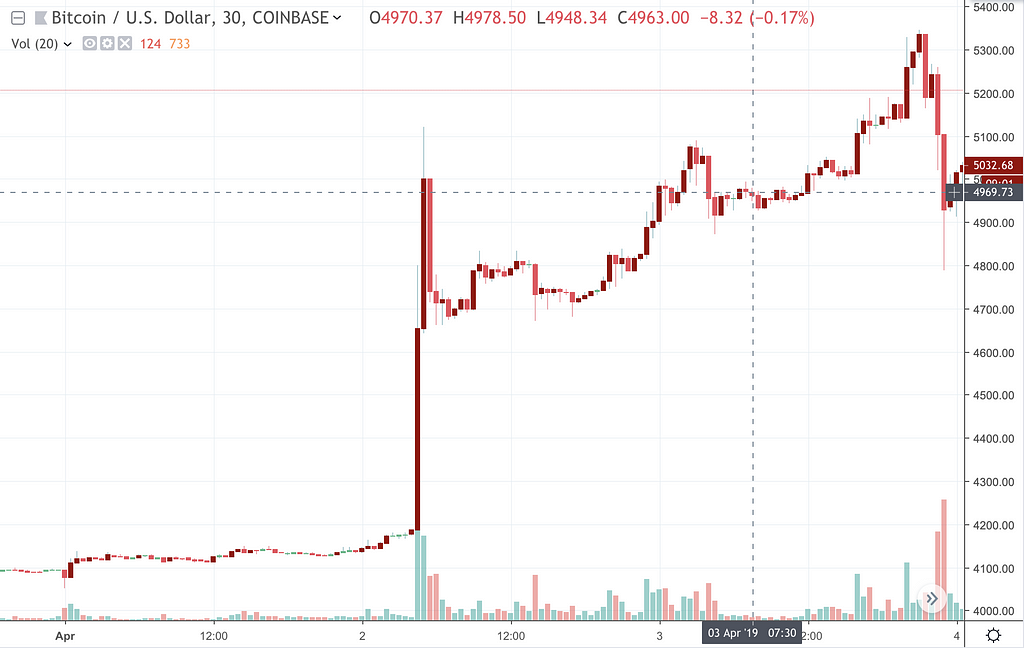 Coinbase Pro BTC/USD price & volume chart (1–3 April 2019). Source: TradingView
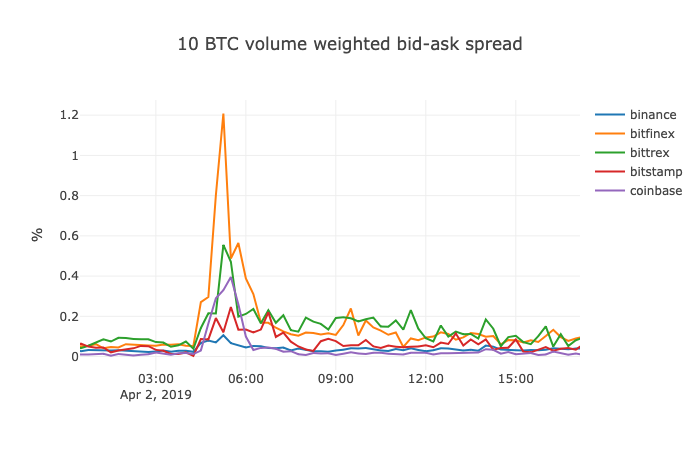 Bid-offer by 10 BTC. Source: Crypto Integrity
Let’s revert to the bitcoin pump. The 10 BTC volume weighted bid-ask chart shows that Bitfinex has been impacted by the price movement to a greater extent than other exchanges. It may imply that Bitfinex was the initiating exchange. In contrast, Binance had experienced a very moderate widening of spreads; thus, it may indicate that Binance was a lagging exchange in this case and that arbitrage may be hampered.
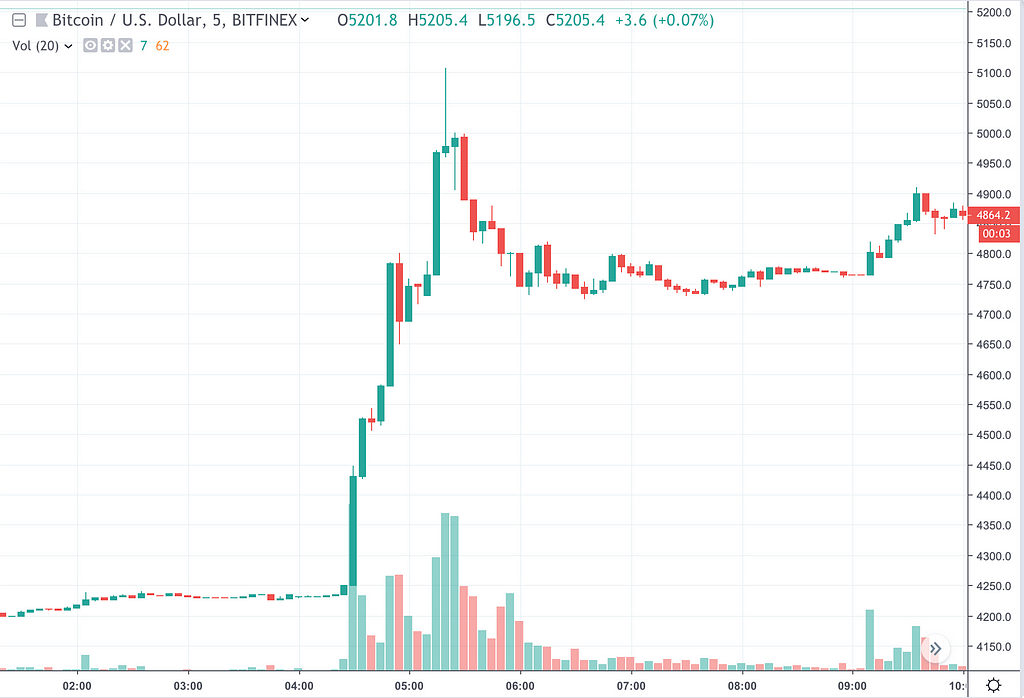 Bitfinex BTC/USD price & volume chart (2 April 2019). Source: TradingView
Further analysis of the 10 BTC volume weighted bid-ask spread has shown that the purchase was divided into 3 bunches, which are recognizable as three peaks on the chart below.
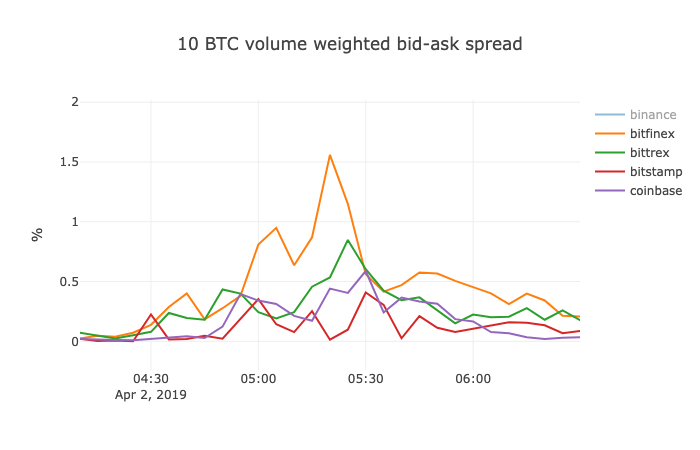 Bid-offer by 10 BTC. Source: Crypto Integrity
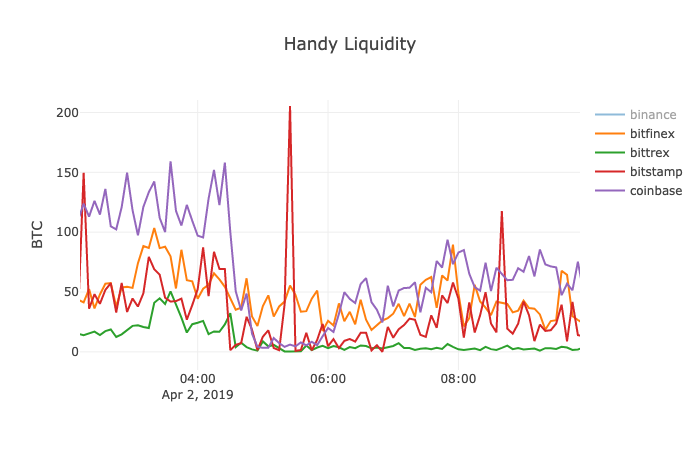 Handy liquidity (quantity of BTC within 0.1% from mid-price). Source: Crypto Integrity
The chart of handy liquidity leads to two main inferences: (1) we observe the decline in handy liquidity during the pump on all four exchanges, (2) Coinbase and Bitstamp have experienced the most significant drop in comparison to other exchanges. On the one hand, it may mean that the price movement was initiated there producing the highest pressure on order book liquidity. On the other hand, regardless of a source of the price shock, liquidity has vanished from Coinbase and Bitstamp (despite the presence of market makers) during a turmoil, when the market depth is most valuable.
Let’s have a closer look at the first stage of the spike — from 4:30 till 4:40 UTC. As not all exchanges publish exchange time in order books snapshots or updates, we have used our server’s local time to compare. We know it has had an impact on our experiment, because our server is located in Frankfurt, which is geographically closer to Bitstamp and Bitfinex, than to Coinbase and Binance (although we have no exact information where Binance’s matching engine is located). However, on a time frame of minutes hundreds of milliseconds, which are explained by geography, have little impact.
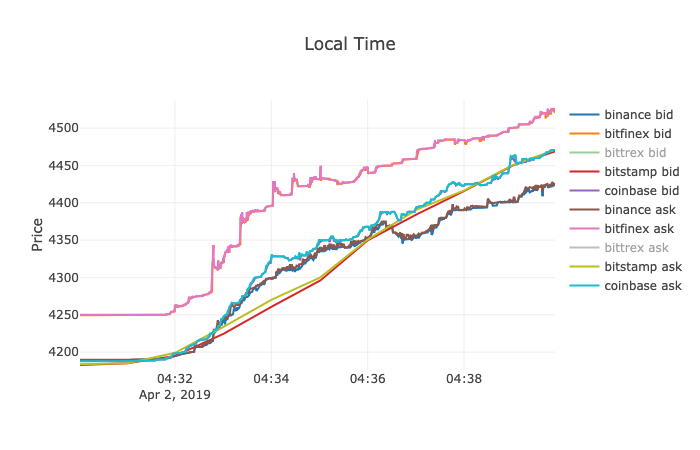 Bid-ask spread of selected crypto exchanges during the first spike (local time). Source: Crypto Integrity
The chart above shows that bid-ask spread on Bitfinex has experienced several buyers’ attacks (straight vertical shifts) while one can observe more smooth price movement on other exchanges. In addition, it is worth mentioning that, initially, the price on Bitstamp (4:32–4:35) and afterwards the price on Binance (4:36–4:40) rose remarkably slower than on other exchanges. Similar dynamics were observed during the second impulse (4:48–4:58) and the third one (5:16–5:24).
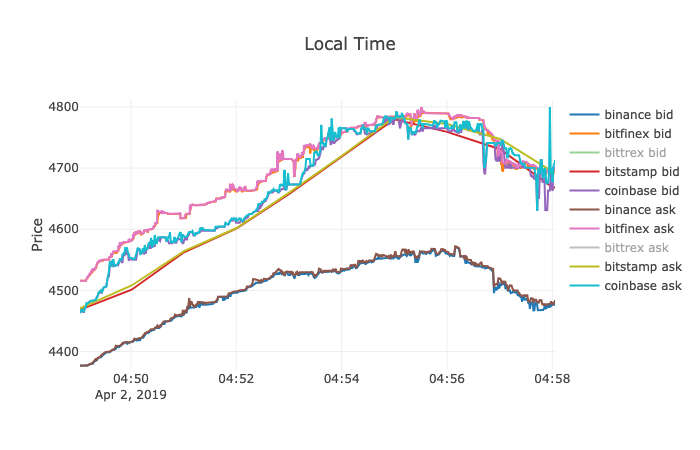 Bid-ask spread of selected crypto exchanges during the second spike (local time). Source: Crypto Integrity
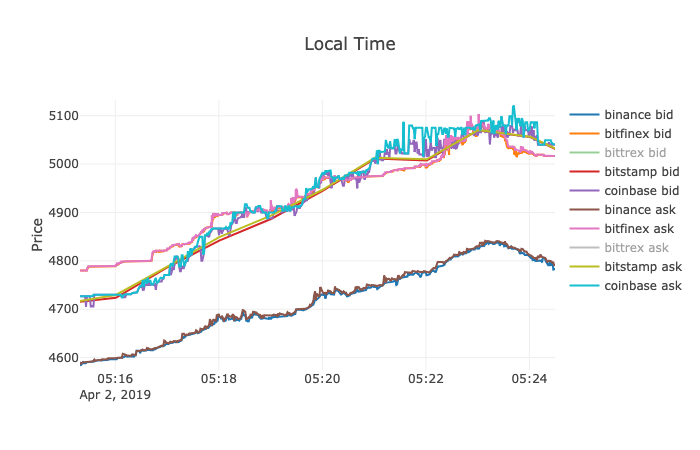 Bid-ask spread of selected crypto exchanges during the third spike (local time). Source: Crypto Integrity
The analysis of trades, which happened during this period, has confirmed that large purchases were initiated on Bitfinex (straight vertical lines). However, one can see smaller shifts on Binance. Neither Bitstamp (for Bitstamp, BTC/EUR was analysed) nor Coinbase Pro have exhibited such shifts. Can it be explained by deeper liquidity? Has it something to do with USDT (Tether)?
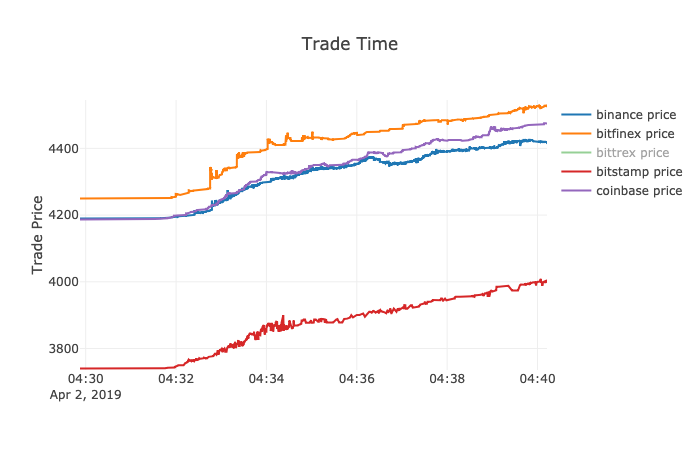 Trade prices of selected crypto exchanges during the first spike (exchange time). Source: Crypto Integrity
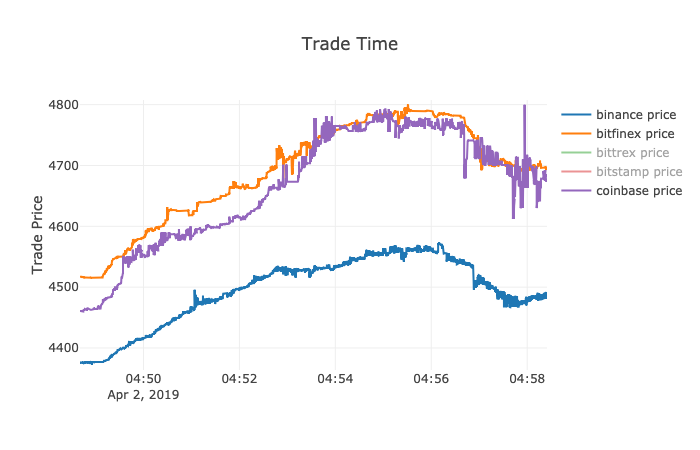 Trade prices of selected crypto exchanges during the second spike (exchange time). Source: Crypto Integrity
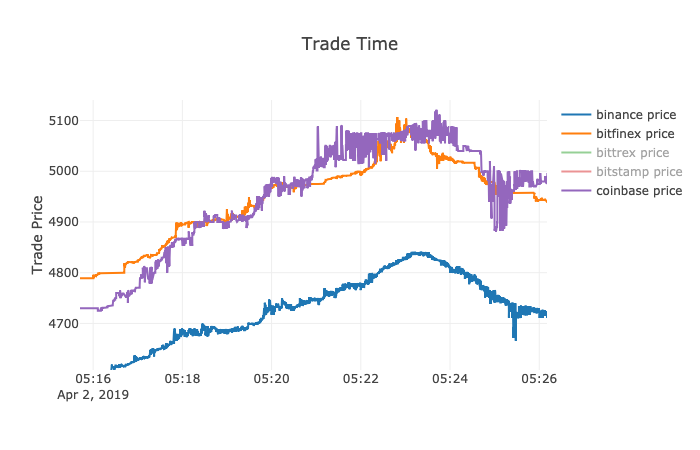 Trade prices of selected crypto exchanges during the third spike (exchange time). Source: Crypto Integrity
The chart of the order book disequilibrium shows strong buyers pressure during the first price shock with all exchanges having negative disequilibrium but Bittrex. The upward pressure began at 4:30 and lasted till 5:30. However, we observe both buyers and sellers during this period. Bitstamp had the most volatile disequilibrium when buyers and sellers were trying hard to reach a price balance.
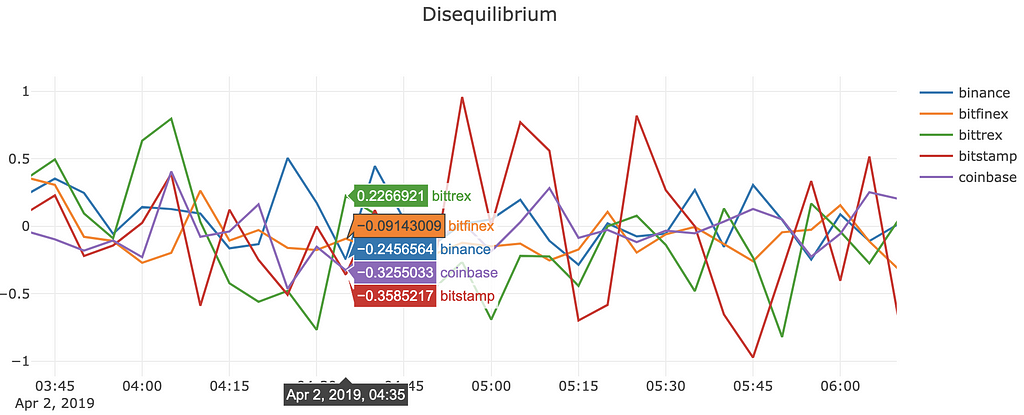 BTC/USD order book disequilibrium. Source: Crypto Integrity
Data
The metrics that have been used in this study are applied to the public datasets consisting of anonymous trades and order books. The data collector subscribes to the data feed of an exchange and saves a certain number of levels of an order book. All data is received via WebSocket technology.
Within the scope of the research, we have analysed L2 data, i.e. several ask and bid levels. All selected exchanges have more advanced technology than most of their peers in crypto space. However, only Bitstamp has timestamps in microseconds while Bittrex doesn’t have timestamps in order books at all. From Binance we receive data once per second, although it has a timestamp with 1 ms precision. The high quality of the data makes it easier to detect market manipulations, thus, it can be assumed that an exchange, which takes care of its data, seeks more transparency.
Known issues
Timestamps. In order to identify and localize the source of an originating price movement, one needs to have precisely synchronised timestamps in both order books and trades across all analysed exchanges. Unfortunately, the current level of technology applied by crypto exchanges is well below the standards of the financial industry (e.g., the policy of CBOE; you can also have a look at the nice article on time-keeping technologies by Corvil). Lack of precise synchronisation and constant traceability to UTC leads to the divergence of the time, which an exchange reports in trades and order books, from UTC. In turn, it results in wrong inferences drawn based on the data with incorrect timestamps. We have sent formal requests to all selected exchanges.
- Kraken is currently using NTP and will be moving to PTP in the near future.
- Bitstamp does not disclose how its servers keep time on the servers but has all servers time updated to the global UTC time.
- Other exchanges have not replied to our requests.
Order book depth. To ensure we have enough depth of order books to calculate handy liquidity correctly, we dump the following number of levels. To check the quality of data, we have calculated the depth of a dumped order book as a ratio of the farther level to the best bid or the best ask respectively. If the resulting depth was lower than 0.1%, we excluded such values. In future, we plan to tune our data collection mechanism in order to increase the dumped depth.
- Binance: 20 levels + updates
- Bitfinex: 50 levels
- Bitstamp: all
- Bittrex: 30 levels
- Coinbase Pro: 150 levels
- Kraken: 10 levels + updates
True liquidity and price discovery in crypto space was originally published in Hacker Noon on Medium, where people are continuing the conversation by highlighting and responding to this story.
Disclaimer
The views and opinions expressed in this article are solely those of the authors and do not reflect the views of Bitcoin Insider. Every investment and trading move involves risk - this is especially true for cryptocurrencies given their volatility. We strongly advise our readers to conduct their own research when making a decision.
