Latest news about Bitcoin and all cryptocurrencies. Your daily crypto news habit.
 Unsplash
When meeting with sophisticated and institutional investors there are a few things I noticed keeping them on the sidelines. Their concerns range from a lack of clear regulation coming from Washington, to a shortage of SEC-regulated, secure, custody solutions. The good news is each of these issues are gradually being resolved. Crypto regulation is slowly becoming clear. Though cautious, US regulators are shaping their stance. Security storage solutions have improved vastly helping to reduce the number of hacks. At the same time, compliant custody solutions are coming online as qualified custodians are entering the space. However, there is one area where investors struggle to find clarity: How to assess the valuation of blockchain protocols? In other words, by buying right now, am I paying too little or too much for Bitcoin or Ethereum? In traditional equities, there are multiple models for price valuation. Unfortunately, for blockchain, these models have not been developed yet. Additionally, given the blockchain networks fundamentally different features from the classic asset classes, traditional valuation frameworks do not necessarily apply. Some recent publications attempting to put forth a theoretical structure are worth exploring.
Store of Value
One of the most popular and simplest ways investors and crypto enthusiasts think about valuation is its ability to provide a store of value to investors. This approach, determines the value of crypto by using comparators. For instance, in the case of Bitcoin (BTC), the total value of gold is $8tn according to some estimates. Because Bitcoin’s supply is capped to 21M BTC, if we assume Bitcoin captures 10% of the gold market, it would imply a BTC price or $38,000. You can take a similar approach for utility tokens. For example, Filecoin is a decentralized storage solution blockchain. To calculate its potential value, you would need to determine the current total amount of data stored and the price to store it.
This valuation method is often extended to include other potential market captures. Following the Bitcoin example remittances is also ripe for dislocation. Under this extension, the values for each target market would be additive since there are two independent sources of demand on a fixed supply. These are simple applications of the model but ones you often hear people reference.
However, although this approach can hypothetically help you understand the total addressable market (TAM) for a digital asset such as Bitcoin, it cannot tell you much else. The biggest caveats with this methodology are:
- I can cook up any terminal value I want by adding additional value captures such as gold or remittance. Therefore, the TAM can be arbitrarily large and prone to human error.
- It ignores probability. There is a very real chance the TAM cannot be acquired.
- Because it is silent on the drivers of value, you cannot discern any price dynamics. It could follow a straight line or a sinusoidal path.
J-Curve
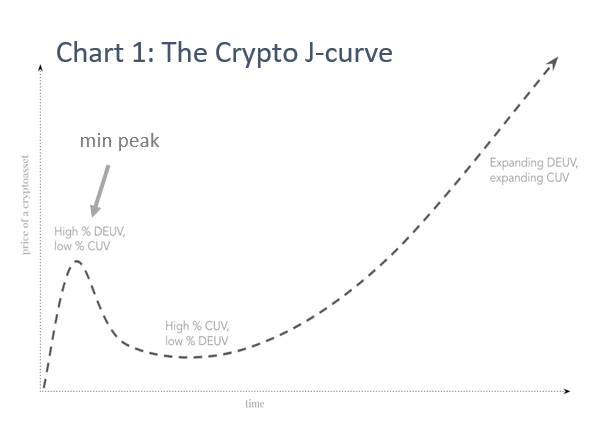
However, the J-curve model does a much better job describing the drivers and dynamics of pricing crypto. The J-curve model was taken from private equity and was first introduced to crypto valuations by Chris Burniske. This approach breaks down price into two components: 1) the ‘current utility value,’ (CUV) and 2) its ‘expected or future utility value’ (DEUV)[1] also referred to as speculative utility value. The former refers to the current usage of the network (e.g. how many transactions have occurred). This is similar to the fundamental drivers in equities. Future utility refers to the forward looking value the crypto will produce. Because current utility represents the value users of a network, it is therefore the natural price floor for a crypto asset. Following this train of thought, in times of corrections, the price will be driven less by speculation (or its expected utility value) and will find a floor nearer to its current utility value. Therefore, in this methodology, when you add CUV and DEUV, you should get 100% of the market value for that coin in the present day.
Let’s apply this model when a new crypto is first introduced. Its value is largely speculative and thus mostly composed of DEUV as its utility or CUV has not yet formed. Because the value at this stage is purely speculative, the asset is extremely volatile as we often see during ICOs and early stage tokens. This time period will often produce the first ‘mini peek’ of the J-curve (see Chart 1). Currently the value composition has a high % of DEUV and a low % of CUV. However, as the team faces roadblocks and investors interest waines, the DEUV will compress and the price will drop. This is a critical stage as many coins are unable to regain momentum and increase their long term expected utility value. On the other hand, if there is a strong development team with genuine tech, they can push through and focus on improving the protocol. As more users (not speculators) trickle in, the price regains its momentum as the CUV expands. The J-curve then starts to steepen as the DEUV grows as expectations around future utility value mature, leading to a tandem expansion of the DEUV and CUV. At this point, the complete cycle has played out and the price is at a new All Time High (ALT). These results can vary widely depending on a bull or bear market.
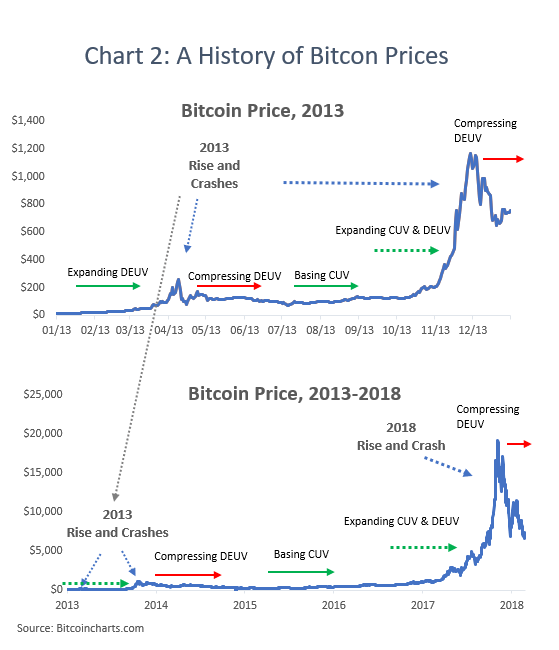
We can also see a similar scenario play out in Bitcoin. Take the 2013, price for example in chart 2. The year starts with an expanding DEUV leading to the first mini peak. However, as investor expectations aren’t met, the price found a floor before rebounding again at the end of the year when both the CUV and the DEUV expanded in tandem. For example, the December 2017 Bitcoin price rally, can be in part contributed to the CME and CBOE launching the first Bitcoin futures. The news led to a tremendous speculation and the fear of missing out causing prices in the cryptocurrency sector to sky-rocket. However, as investor expectation didn’t meet reality (few investors actually bought Bitcoin futures contracts), what followed was a subsequent selloff. The 2013/14 rise and crash while once stood out, is now hardly identifiable, when compared to the 2018 price rise and then subsequent fall (chart 2). These because in the J-curve model, the DEUV will be greater than the previous peak which leads to an ever-refreshing J-curve.
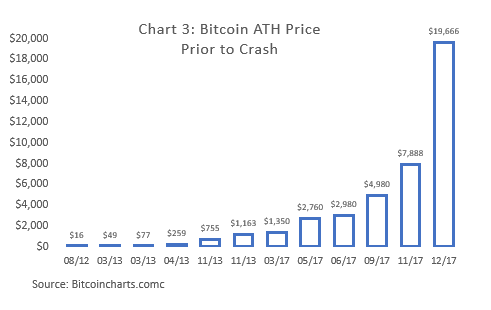
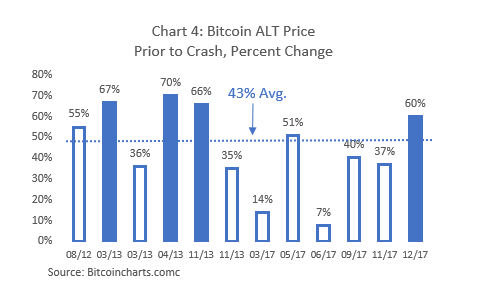
While bull and bear markets are nothing new in the financial world, Bitcoin rises and crashes are quite dramatic. This is largely due to that fact that Bitcoin is still nearly purely speculative coupled with an extremely large upside potential. As a result of these two factors, when Bitcoin shows real promise and the CUV expands, investors rush in. When this happens the DEUV will start to quickly outpace the growth of the CUV as investor lose sight of reality. This scenario of the waxing and waning of investors speculation and has played out time and time again for crypto. Since 2009, Bitcoin has risen and crashed 13 times. However, each time, it crashes, it rises higher the next time producing a constant stream of All-Time-High (ATH) prices (see Chart 3). On average, Bitcoin has seen 43% gain between ALT prices with four above 60% (see Chart 4).
Like what you read? Sign up to our newsletter!
Wrap up
Although more work is being done on how to value cryptocurrency, Burnski’s adaptation of the J-curve does a great job at explaining value fluctuations of crypto. In today’s market, most people[2] are buying crypto with the expectation that it will be worth more in the future. As a result, the entire market is mostly speculative so there is still just a little CUV really incorporated into the price at any stage of the J-curve. That being said, the utility value is quickly growing. For instance, Bitcoin (and many others) is continually improving their protocols, as we have seen with Bitcoin SegWit[3]. As other digital assets are also able to improve, demonstrate utility, and meeting investor expectations, digital assets will continue to gain steam. The question for investors is how best to capture this value? Given the current large speculative content in the price of crypto we think a passive Index Fund is the best way to harvest the upside. Contact us here to learn more about the our methodology and index funds.
Originally published at blog.digicor.io on June 22, 2018.
[1] You can think about the DEUV in terms of if that token is adopted in the future as a replacement for gold, remittances, file storage etc., what is the expected utility value of that token in 2025. You then discount the price back to the present and that is the expected utility value or the DEUV.
[2] The current buyers is largely composed by retail investors, whose unsophistication leads to higher volatility and emotion in the market.
[3] A protocol upgrade that enables a greater number of transactions in bitcoin’s blocks.
Important Disclosure
This publication contains information obtained from sources believed to be authentic and highly regarded. Reprinted material is used with permission, and sources are indicated. Reasonable effort has been made to publish reliable data and information, but the author cannot assume responsibility for the validity of all materials or for the consequences of their use. Certain information contained herein may be dated and no longer applicable: information was obtained from sources believed to be reliable at the time of original publication, but not guaranteed.
The views contained herein are the authors but not necessarily those of DigiCor Asset Management. Such opinions are subject to change without notice. This publication has been distributed for educational purposes only and should not be considered as investment advice or a recommendation of any particular security, strategy or investment product.
References to specific digital assets are for illustrative purposes only and are not intended and should not be interpreted as recommendations to purchase or sell such securities. The author or DigiCor Asset Management may or may not own or have owned the digital assets referenced and if such digital assets are owned, no representation is being made that such digital assets will continue to be held.
This material contains hypothetical illustrations and no part of this material is representative of any DigiCor Asset Management product or service. Nothing contained herein is intended to constitute accounting, legal, tax, security or investment advice, nor an opinion regarding the appropriateness of any investment, nor a solicitation of any type. Readers should be aware that all investment carry risk and may.
Making Sense of Crypto Valuations was originally published in Hacker Noon on Medium, where people are continuing the conversation by highlighting and responding to this story.
Disclaimer
The views and opinions expressed in this article are solely those of the authors and do not reflect the views of Bitcoin Insider. Every investment and trading move involves risk - this is especially true for cryptocurrencies given their volatility. We strongly advise our readers to conduct their own research when making a decision.


