Latest news about Bitcoin and all cryptocurrencies. Your daily crypto news habit.
Litecoin continues to move higher with a total disregard for the current bear market. Could this be the start of a broader recovery?
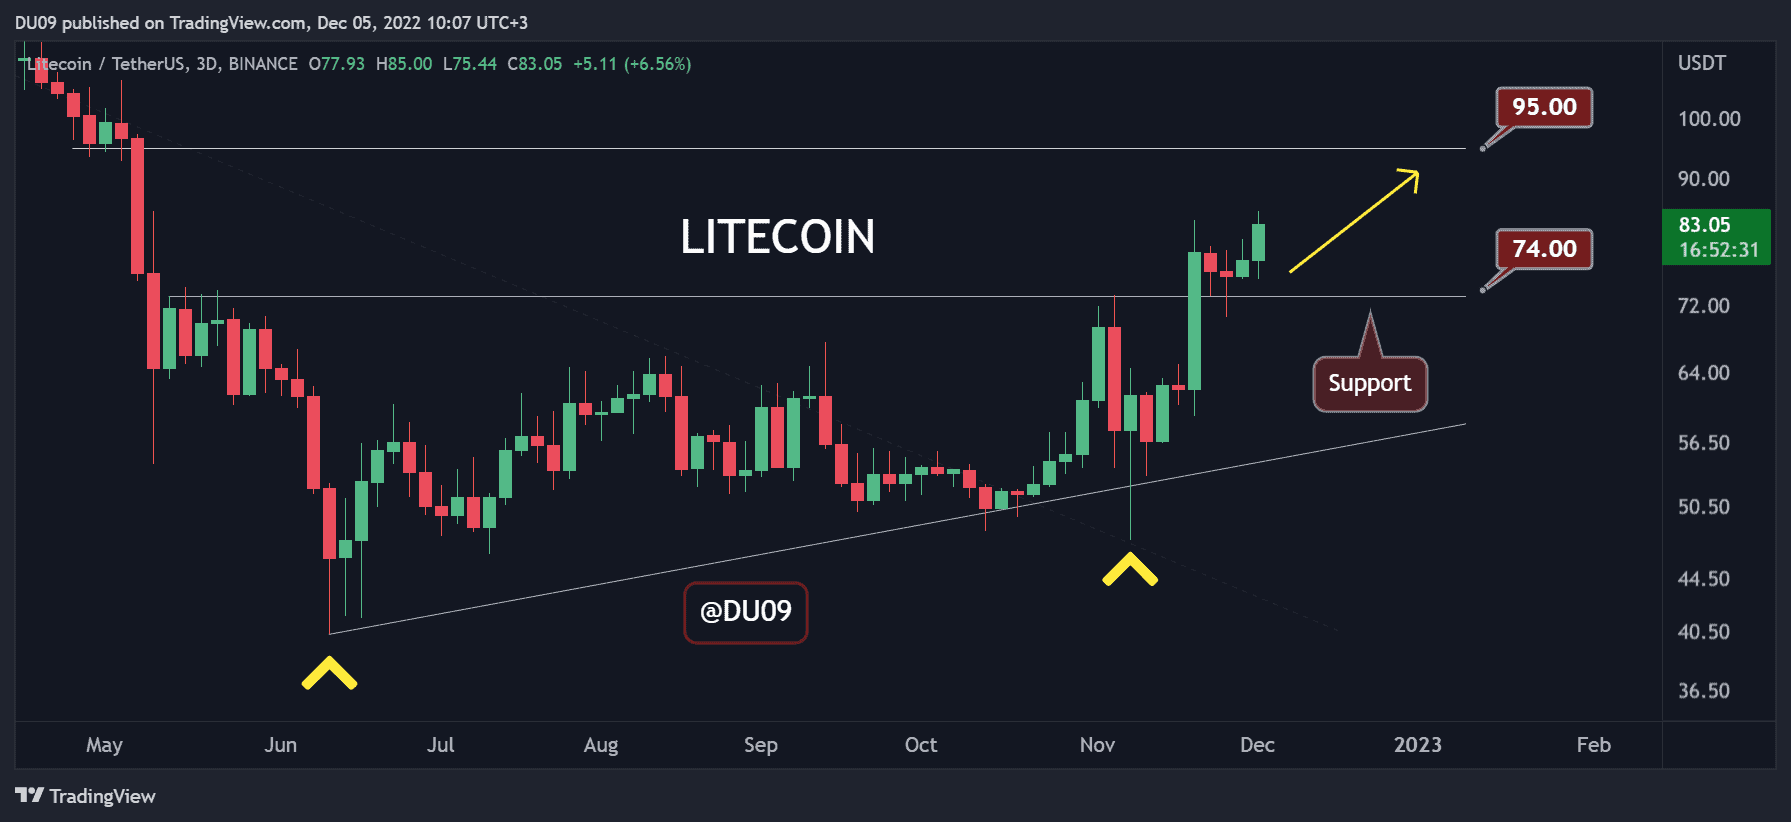
Key Support levels: $74, $64
Key Resistance levels: $95, $105
Litecoin’s price action is getting closer to deleting a lot of the losses marked throughout the ongoing bear market, and it’s on its way to testing another critical resistance at $95. Bulls seem to be in complete control at the time of this writing.
Sellers have vanished, and they failed to keep LTC under $74, which allowed the price to move higher.

Chart by TradingView
Technical Indicators
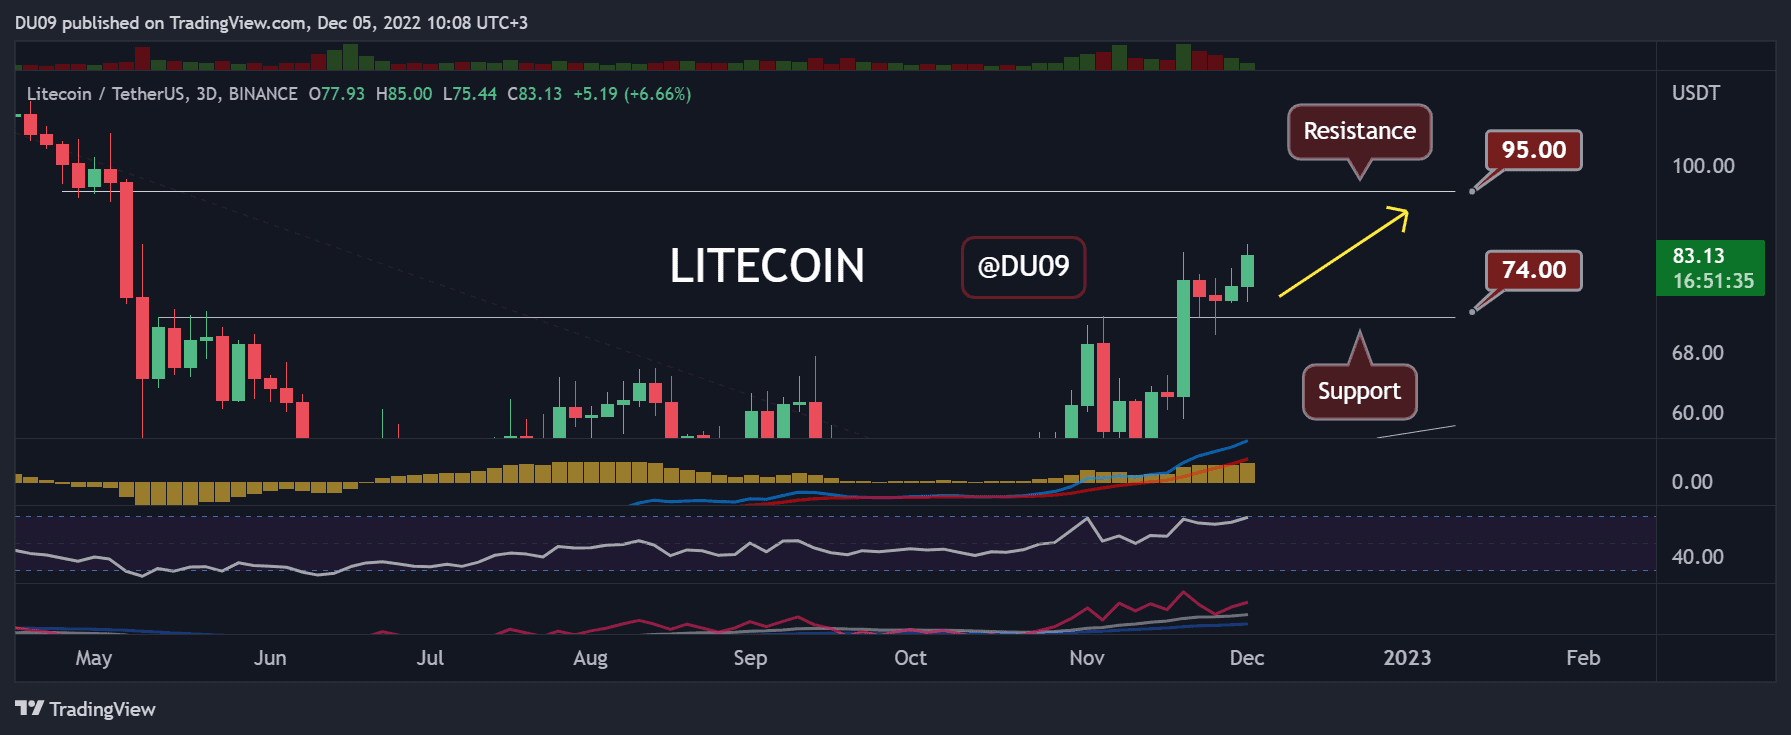
Trading Volume: The volume exploded since LTC moved above $60. Ever since that point, buyers have had the upper hand, including in the past few days.
RSI: The daily RSI is curving back up and may enter the overbought area again at over 70 points. This is bullish.
MACD: The daily MACD remains positive despite this recent pullback to the key support. This is a show of strength.

Chart by TradingView
Bias
The bias for LTC is bullish.
Short-Term Prediction for LTC Price
Litecoin surprised the market yet again after turning the $74 level into support. Rallies of this kind are rare during a bear market, which puts into question the willingness of sellers to regain control.
The biggest challenge for LTC in the next few days is the resistance at $95 and the key psychological level at $100. These targets will likely put up a good fight before allowing the price to move higher.
The post Litecoin Soars 9% Daily, is $100 Next? (LTC Price Analysis) appeared first on CryptoPotato.
Disclaimer
The views and opinions expressed in this article are solely those of the authors and do not reflect the views of Bitcoin Insider. Every investment and trading move involves risk - this is especially true for cryptocurrencies given their volatility. We strongly advise our readers to conduct their own research when making a decision.