Latest news about Bitcoin and all cryptocurrencies. Your daily crypto news habit.
Litecoin is the surprise of this bear market, being one of the first coins to have a breakout and showing tremendous strength.
Key Support levels: $73, $64
Key Resistance levels: $82, $95
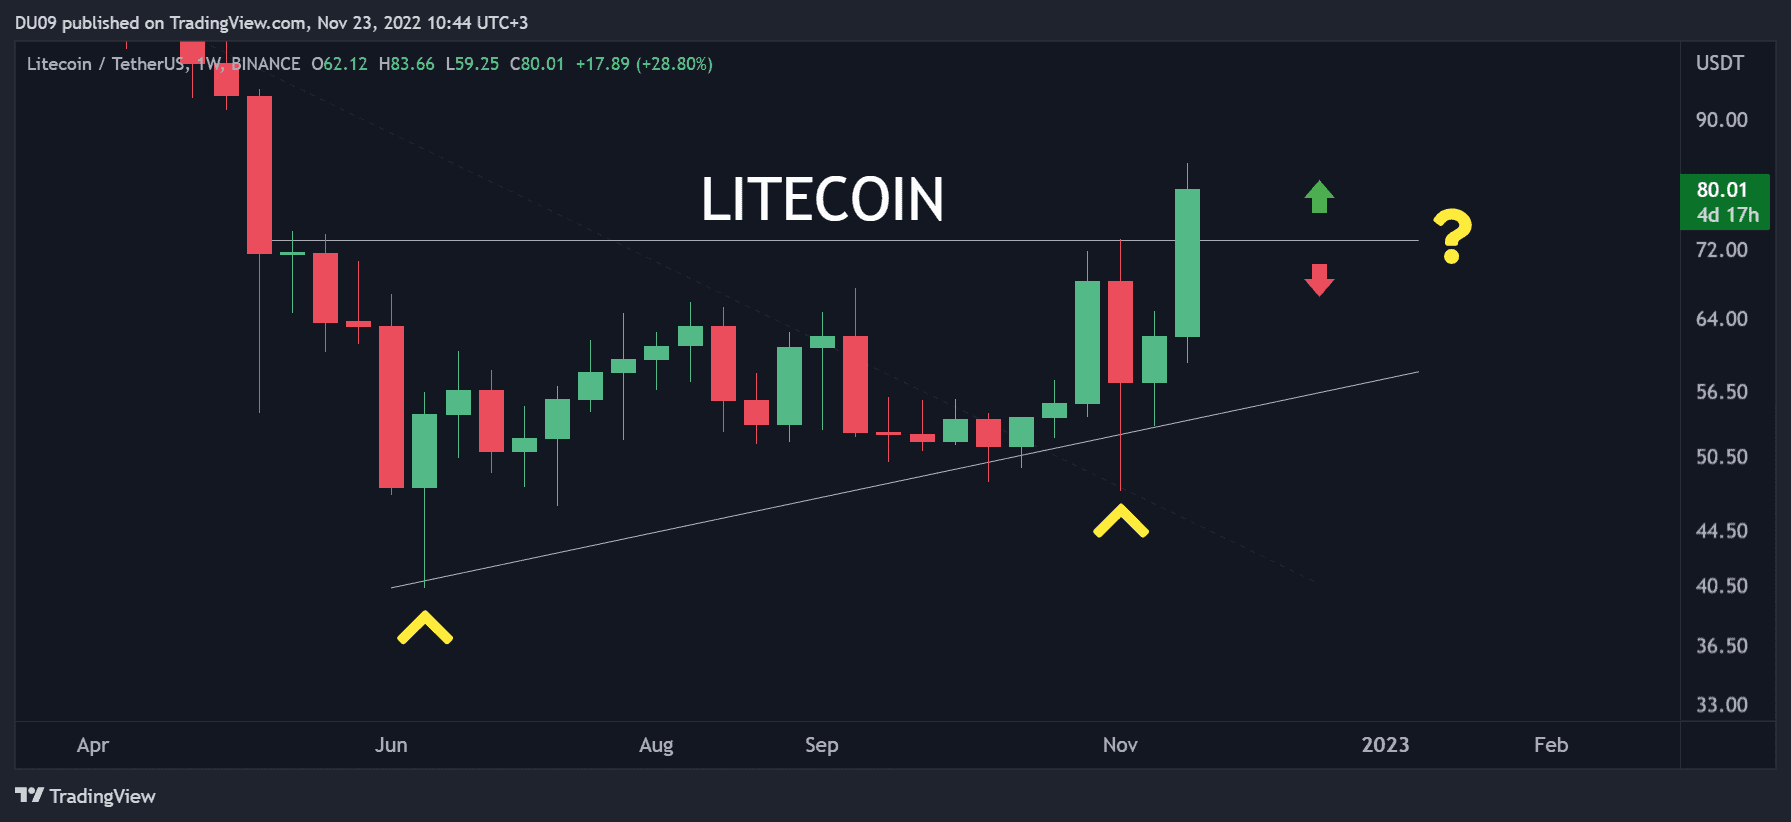
After a long consolidation since June, Litecoin has broken above this ascending triangle (pictured) that took months to form. In the process, the price rallied by 29% in the past 24 hours, which is an impressive achievement considering the current market context.
LTC has good support at $73 (breakout level) and will face strong resistance as it approaches $100 – at $82 and $95.

Chart by TradingView
Technical Indicators
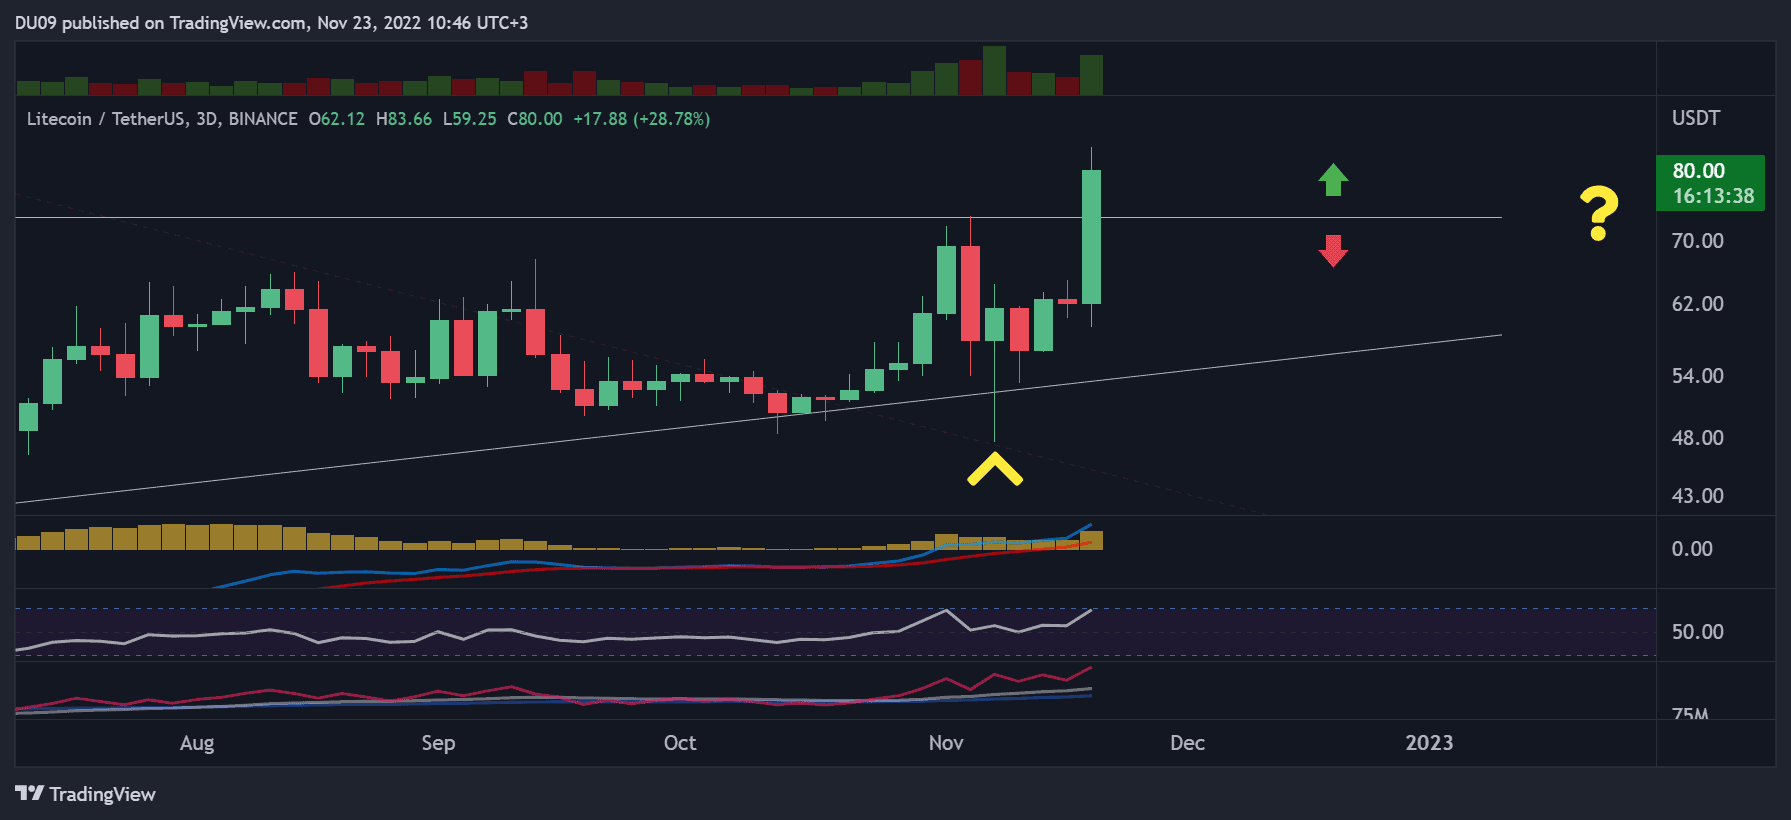
Trading Volume: The volume exploded during the breakout, and the price did not disappoint, with a very strong performance in the past two days.
RSI: The daily RSI is already over 70 points and has reached the overbought area. This is bullish.
MACD: The daily MACD is bullish, and the histogram has shot up since yesterday. This shows that the buying momentum is strong.

Chart by TradingView
Bias
The bias for LTC is bullish.
Short-Term Prediction for LTC Price
Litecoin is the spotlight during the past few days, and speculation is spreading about why it would rally at this time. Rumors on Twitter indicate that regulation may favor proof-of-work coins, which would be bullish for this cryptocurrency. If this turns out true, then LTC could very well reach a three-digit valuation (> $100) in the near future.
The post LTC Leads Market Recovery with 29% Gains in 24 Hours (Litecoin Price Analysis) appeared first on CryptoPotato.
Disclaimer
The views and opinions expressed in this article are solely those of the authors and do not reflect the views of Bitcoin Insider. Every investment and trading move involves risk - this is especially true for cryptocurrencies given their volatility. We strongly advise our readers to conduct their own research when making a decision.