Latest news about Bitcoin and all cryptocurrencies. Your daily crypto news habit.

The overall trend for the SOL coin is still bullish, and the price is currently under a usual correction phase. This pullback brought a 40% discount for the crypto investors as the price plunged to the $150 mark. Now, the technical chart hints at a bullish reversal from the $150 mark, focusing on the $200 mark.
Key technical points:
- The SOL coin price finds support near the 50% Fibonacci retracement level.
- The intraday trading volume in the SOL coin is $2.51 Billion, indicating a 40% loss.
Source- SOL/USD chart by Tradingview
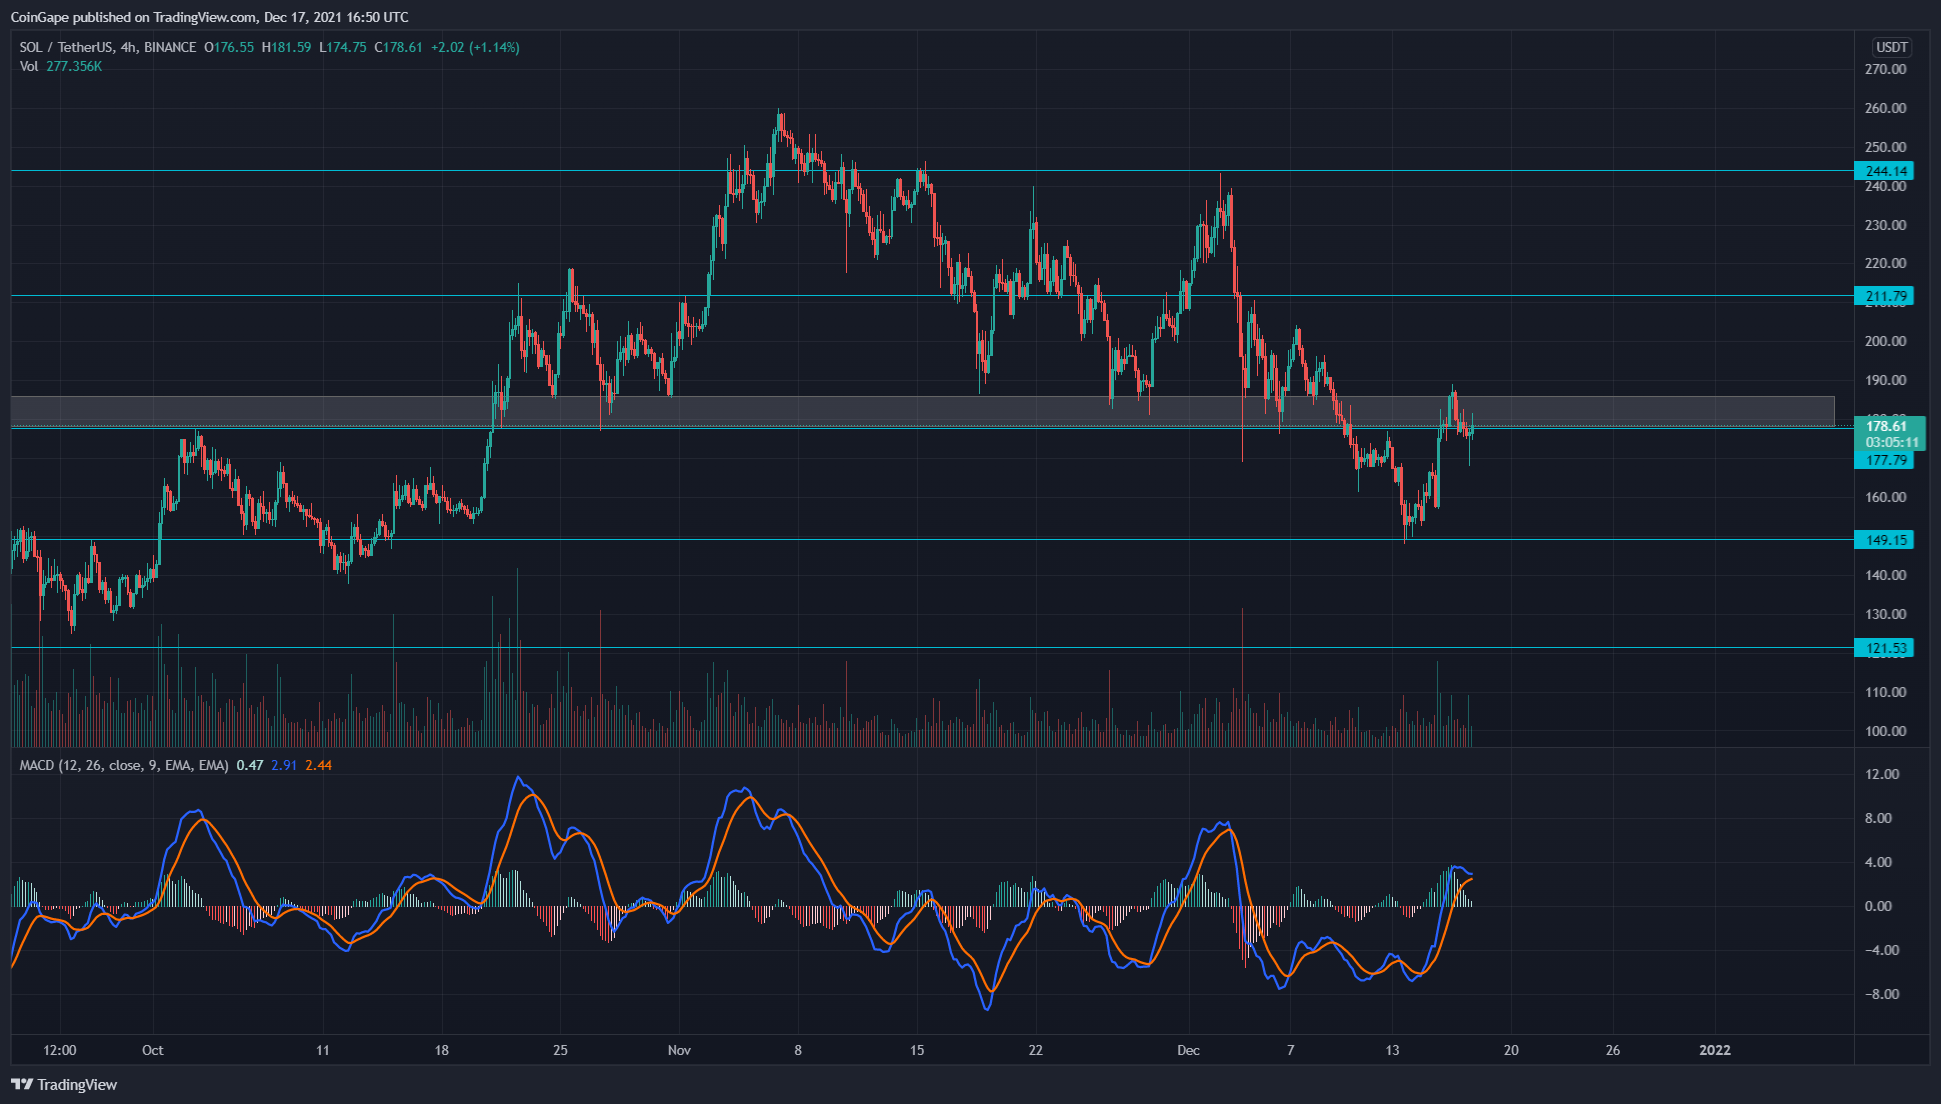
The last time when we covered an article on SOL/USD, the coin price plunged to the $185 support zone, trying to sustain above it. However, the coin price finds sufficient support near the $150 support zone coincides with the 50% Fibonacci retracement level in the daily chart. However, the overpowered bears breached this support level, resulting in a downfall of more than 20% within a week. The coin price showcased an 18% rise within days, suggesting a bullish recovery.
Presently, the coin trades at $176 while threatening the formation of an evening star candlestick pattern in the daily chart. Moreover, the intraday trading volume shows a decline of 40%.
The crucial EMAs (20, 50, 100, and 200) maintain a bullish alignment while the price finds support near the 100-day EMA. Thus, the EMAs are doing a great job supporting the falling prices and helping the bulls maintain the trend.
The daily Relative Strength Index (43) shows a failure of the slope to rise above the central line in the daily chart due to the possible evening star pattern formation.
SOL/USD Key Levels In The Daily Chart
Source- SOL/USD chart by Tradingview
The SOL coin price maintains the price higher than the $170 mark after the multiple bullish candles’ formation. However, the crypto trades should wait for a proper breakout from the overhead resistance to get an entry opportunity.
As for the critical support levels, traders expect the $150 and $125 to play an important role. In contrast, the resistance levels are $200 and $250 marks.
The post SOL Coin Price Analysis: Despite Dark Phase In Crypto Market Solana Aims To Break $180 appeared first on CoinGape.
Disclaimer
The views and opinions expressed in this article are solely those of the authors and do not reflect the views of Bitcoin Insider. Every investment and trading move involves risk - this is especially true for cryptocurrencies given their volatility. We strongly advise our readers to conduct their own research when making a decision.

