Latest news about Bitcoin and all cryptocurrencies. Your daily crypto news habit.
( The following was posted in realtime over at https://t.me/JoesCrypt )
With the lack of traditional “fundamentals” in the cryptoassets markets, technical analysis has become essential in any investors toolkit for evaluating when and where to buy and sell said assets, particularly bitcoin.
Technical analysis has been around for decades but many find it simply too confusing or complicated to understand.
I will break down a number of technical analysis indicators below to make it easier to understand. In this case, I’ll show why bitcoin’s recent reversal was imminent.
Let’s take a look at a simple daily chart first.
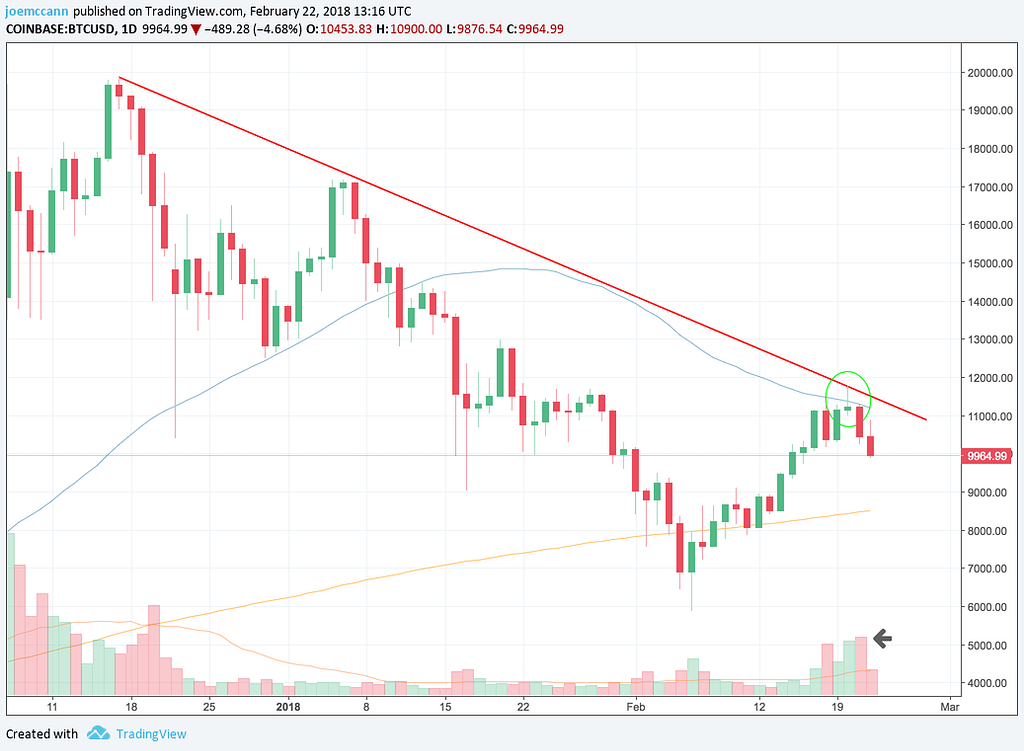
This chart is a fairly simple visualization of the past few months of bitcoin’s daily price movement (opening price, closing price, the high price of the day and the low price of the day), including the trading volume (total number of trades for that day). The red and green symbols are called “candles”.
The long, downward sloping red line is called a “trend line” and you can see the attempts of the bulls (buyers) to break through that downward trend line have failed a couple of times.
In addition to that, the sinusoidal wave-like blue line is the 50 Day Moving Average. This average is useful for determining intermediate-term momentum while the slowly rising orange line is the 200 Day Moving Average which is useful for determining much longer term momentum and direction.
You can see that bitcoin attempted to pierce the 50 Day Moving Average, which it did briefly on February 20th, but was stopped short of that red downward trend line.
In addition to that, the selling volume (the large red rectangle at the bottom of the chart) on February 20th was higher than the previous day which tends to show control switching back to the bears (sellers).
Finally, the chart’s candle formation is called a “shooting star”.
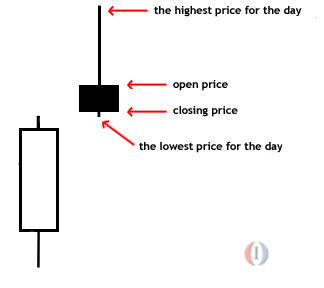 Shooting Star Formation Explained
The importance of a shooting star is key here as it is typically the most obvious warning sign of a reversal as the thin line (called the candle’s “wick”) in the shooting star formation shows that many bulls were buying up here, but are quickly underwater (losing) in their position and now likely need to cut their losses (sell). This tends to trigger more selling. For the shooting star to be confirmed, the next day, in this case, February 21st, must fail to make a higher high (again in this case, trade above $11,775, which was the high on February 20th) followed by a closing price that is lower than the previous day.
This was confirmed yesterday with bitcoin failing to get above $11,775 and closing at $10,454 which is below February 20th’s closing price of $11,235.
But this is child’s play. Let’s dig into a more technical chart to get even further confirmation of the reversal.
This chart has a lot going on. Let’s break it down.
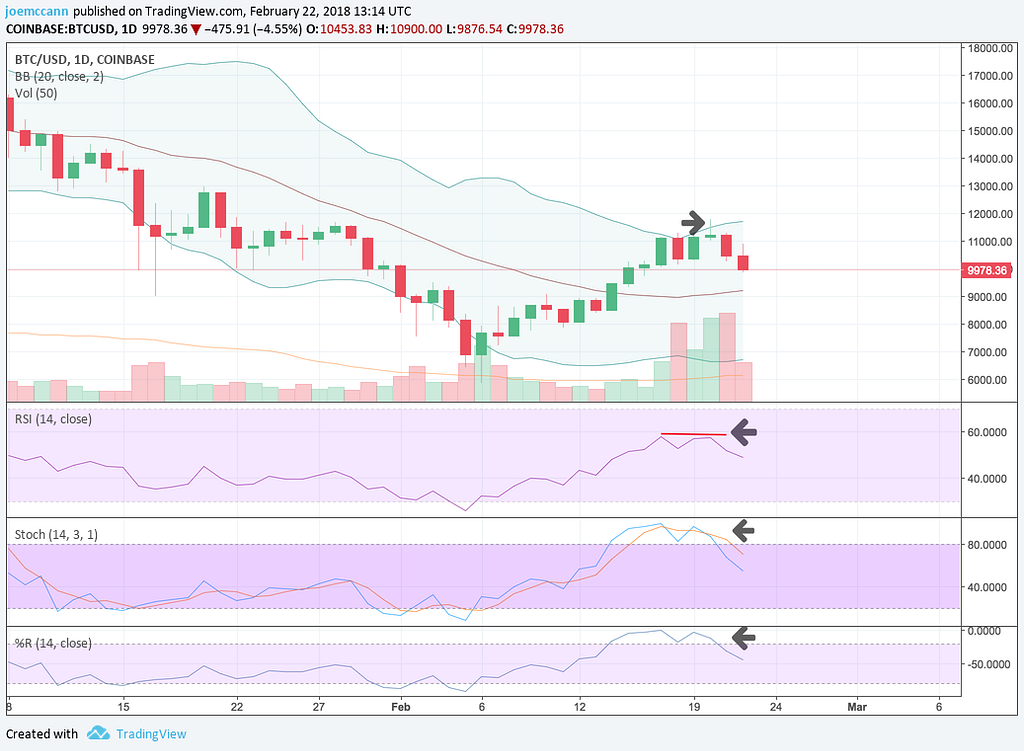
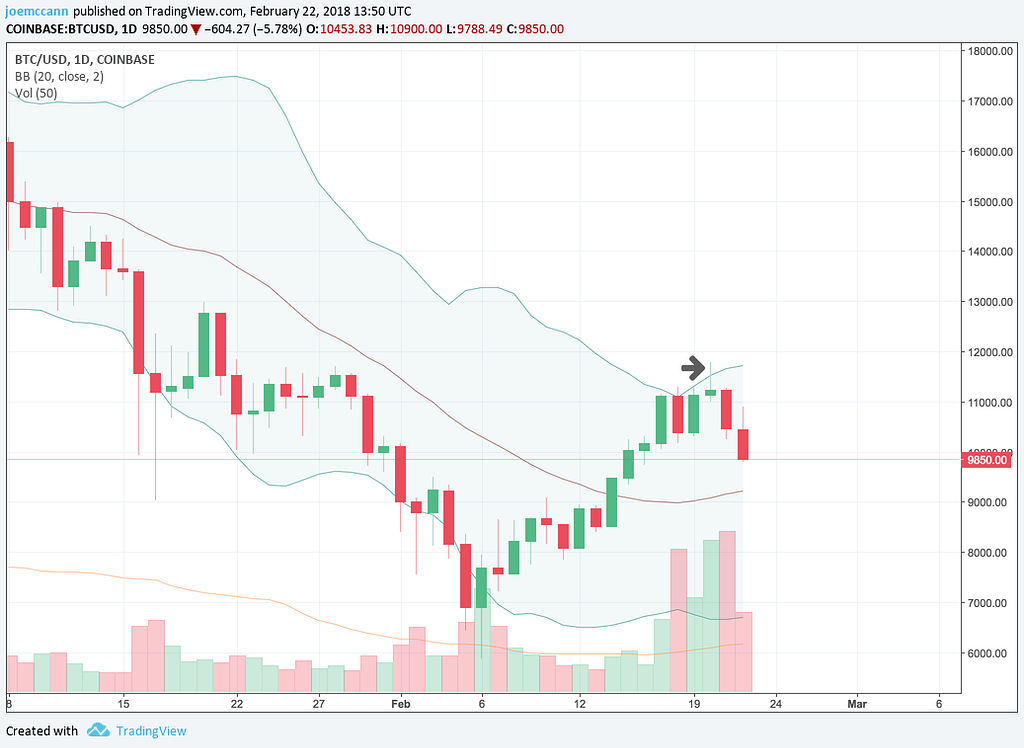
First, the light green region are the Bollinger Bands. Bollinger Bands, or BB, are a measure of the price volatility of an asset. The redline in the middle is the 20 Day Simple Moving Average while the top and bottom of the green region is +1 and -1 standard deviations from the 20 Day Simple Moving Average.
When something is below 1 standard deviation of the mean, it is a good buying signal (it is what is referred to as “oversold”).
The opposite is also true. When the price moves above 1 standard deviation of the moving average (the mean), it is referred to as “overbought” which is typically a good time to sell.
We can see bitcoin’s nadir above the top of the BB, which implies an overbought state and a reversal in direction is more likely.
But one signal is simply not good enough. Let’s take a look at the next indicator, the Relative Strength Index, or RSI.
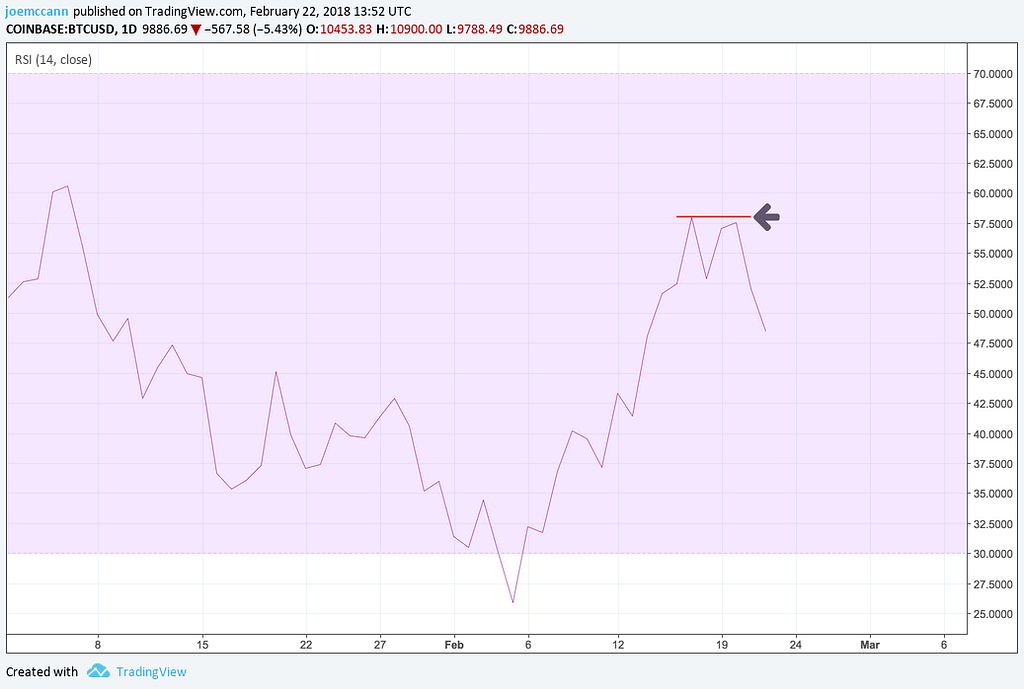
RSI is a momentum indicator that compares the magnitude of recent gains and losses over a specified time period to measure the speed and change of price movements of an asset. When the RSI is above 70 it is overbought and when it is below 30 it is oversold.
However, in bitcoin’s case here, we aren’t above 70 or below 30, yet, we can see that the RSI failed to move above 58, twice, also called a “double top”.
The double top in this scenario also forecasts a reversal in trend and you can see the RSI subsequently began to drop as did the price of bitcoin.
But there’s more.
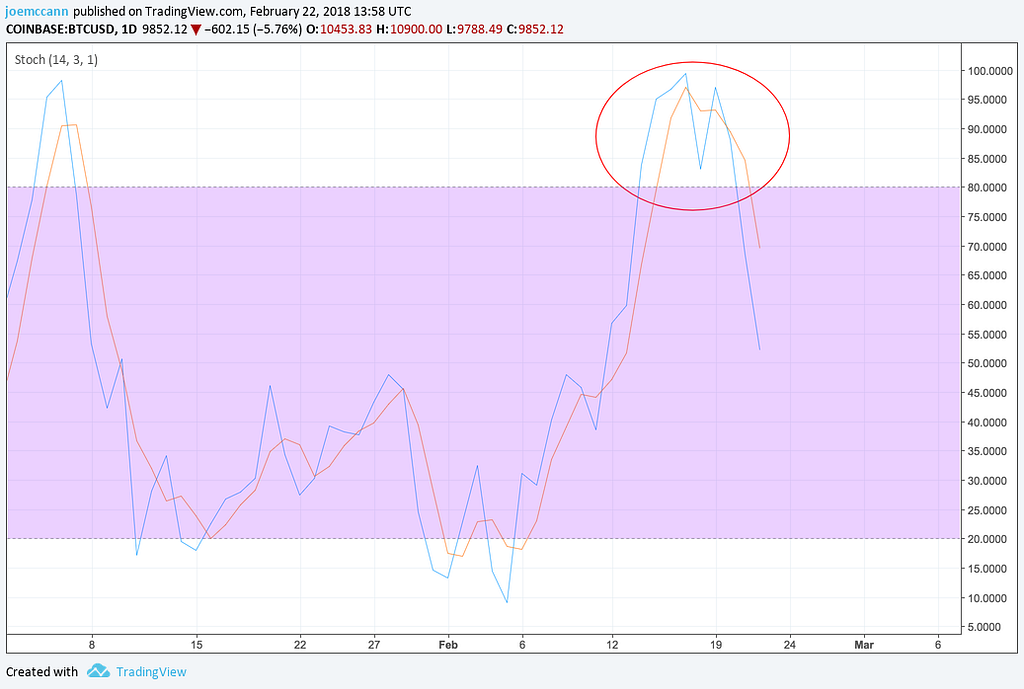 Stochastic Oscillator Is Overbought
This chart is known as the Stochastic Oscillator. The Stochastic Oscillator (SO) is a momentum indicator comparing the closing price of an asset to the range of its prices over a certain period of time.
In layman’s terms, when the SO is above 80 the asset is overbought and below 20 it is oversold. We can clearly see bitcoin well above 80, which is an overbought state and a reversal being even more likely.
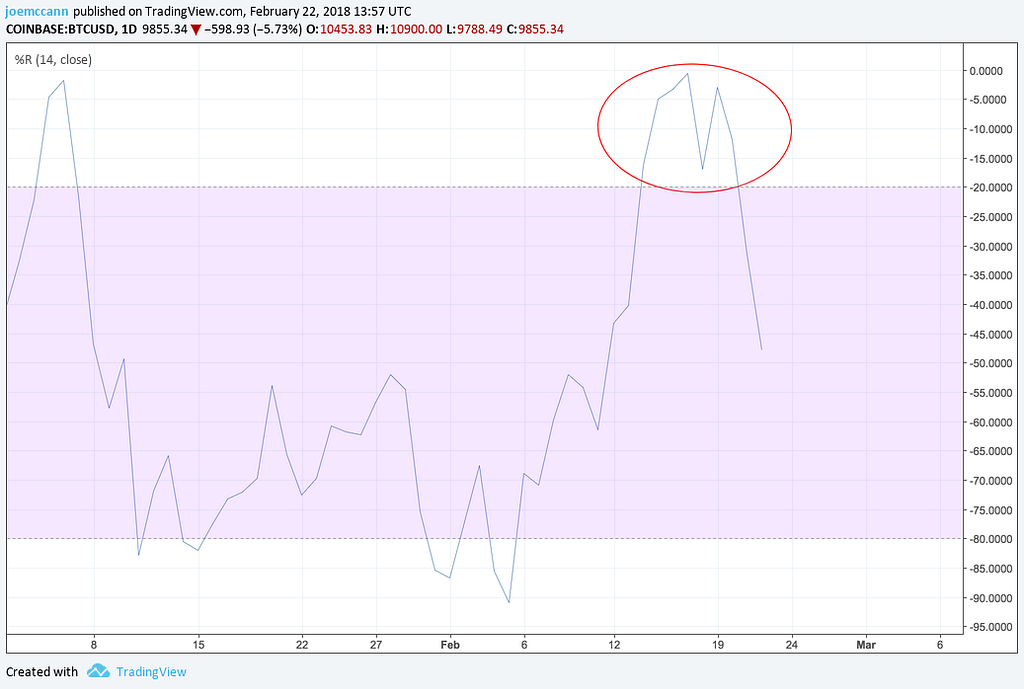
But there’s one last indicator that shows bitcoin’s imminent reversal: the Williams Percent Range, or Williams %R for short.
Williams %R, sometimes referred to as the Williams Percent Range, is another momentum indicator that measures overbought and oversold levels, by comparing the closing price of an asset to the high-low range over a period of time, typically 14 days.
Speak English, Joe!
In essence, when the Williams %R is above -20 it is overbought and when it is below -80 it is oversold.
We can easily see that bitcoin was well above -20 and a reversal being likely. Surely enough the Williams %R reversed along with the price of bitcoin.
Simple Math
Enough with the advanced math! How can we use these indicators to determine whether or not it is a good time to sell?
Simple. Let’s just add up the positive or negative indicators.
In this case, we only have negative indicators, and a lot of them.
- ✅ Failure at downward daily trend line (the red diagonal line).
- ✅ Failure to close above the 50 Day Moving Average.
- ✅ More selling volume than previous buying volume (bears in control).
- ✅ A “shooting star” candle formation.
- ✅ A nadir above the first Bollinger Band (overbought).
- ✅ A “double top” of the Relative Strength Index (RSI).
- ✅ An oversold state of the Stochastic Oscillator.
- ✅ An oversold state of the Williams Percent Range.
That’s eight indications of a reversal. Add these up and you have your answer — a reversal is imminent.
Where Does bitcoin Go From Here?
No one can predict the future and history doesn’t repeat itself, but it does influence the future. In this case, we can use math again, to get an idea of where bitcoin may stop declining and in fact, start it’s upward climb again.
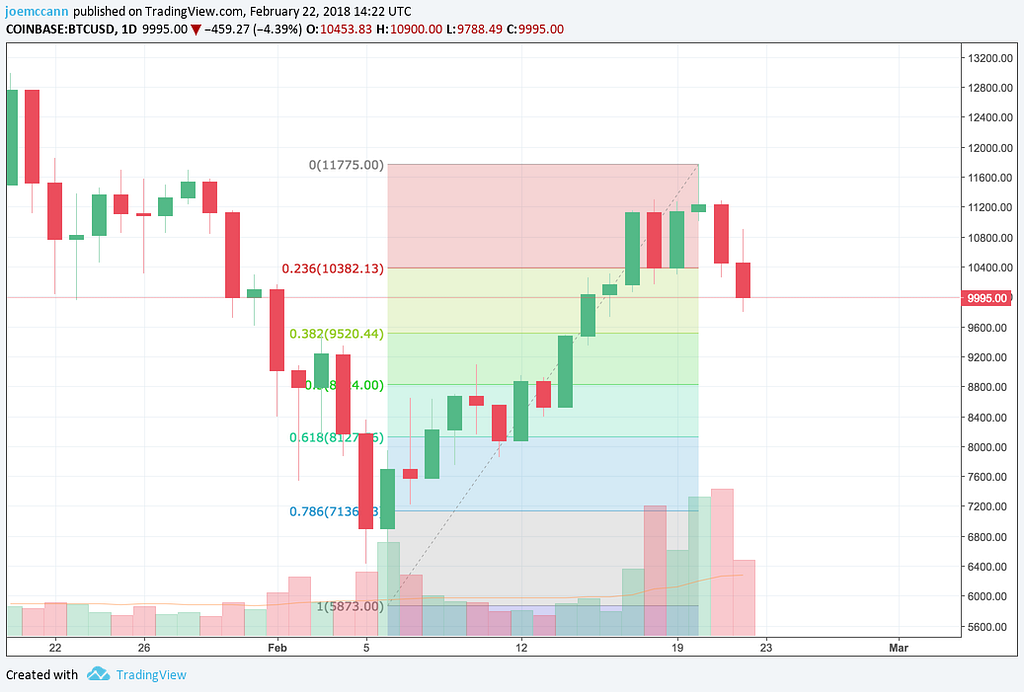 Fibonacci Retracement of bitcoin
This chart is represents what’s called a “Fibonacci Retracement”.
And yes, this we’re talking about this Fibonacci:
And the Fibonacci you are likely familiar with:
A Fibonacci retracement is used in technical analysis to identify areas of support (price stops going lower) or resistance (price stops going higher). Fibonacci retracement levels use horizontal lines to indicate areas of support or resistance at the key Fibonacci levels before the trend continues in the original direction. These levels are created by drawing a trend line between the high price (in bitcoin’s case, $11,775) and the low ($5,873) and then dividing the vertical distance by the key Fibonacci ratios of 23.6%, 38.2%, 50%, 61.8% and 100%.
Yeah, a lot of math, indeed.
In the chart, you can see $10,382 as the first Fibonacci support level (23.6% from the high of $11,725) which was breached today, February 22nd. The next support level is $9,520 (38.6%), followed by $8,824 (50%), $8,127 (61.8%) then $7,136 (which is actually 23.6% above the low of $5,873) and then finally a full retracement back to the low of $5,873 itself (100%).
These levels are of course not guaranteed but are great starting points to use with a number of other indicators to give you a better indication of when to start buying bitcoin again.
If you liked this post, join me at https://t.me/JoesCrypt and if you would like to get realtime notifications of various buying and selling opportunities, have a look at: https://t.me/CryptDexBot, currently in Alpha.
Disclaimer
The views and opinions expressed in this article are solely those of the authors and do not reflect the views of Bitcoin Insider. Every investment and trading move involves risk - this is especially true for cryptocurrencies given their volatility. We strongly advise our readers to conduct their own research when making a decision.
