Latest news about Bitcoin and all cryptocurrencies. Your daily crypto news habit.
ETH/USD: Price Consolidates After A Rebound
Key Resistance Levels: $600, $636, $700
Key Support Levels: $530, $489, $450
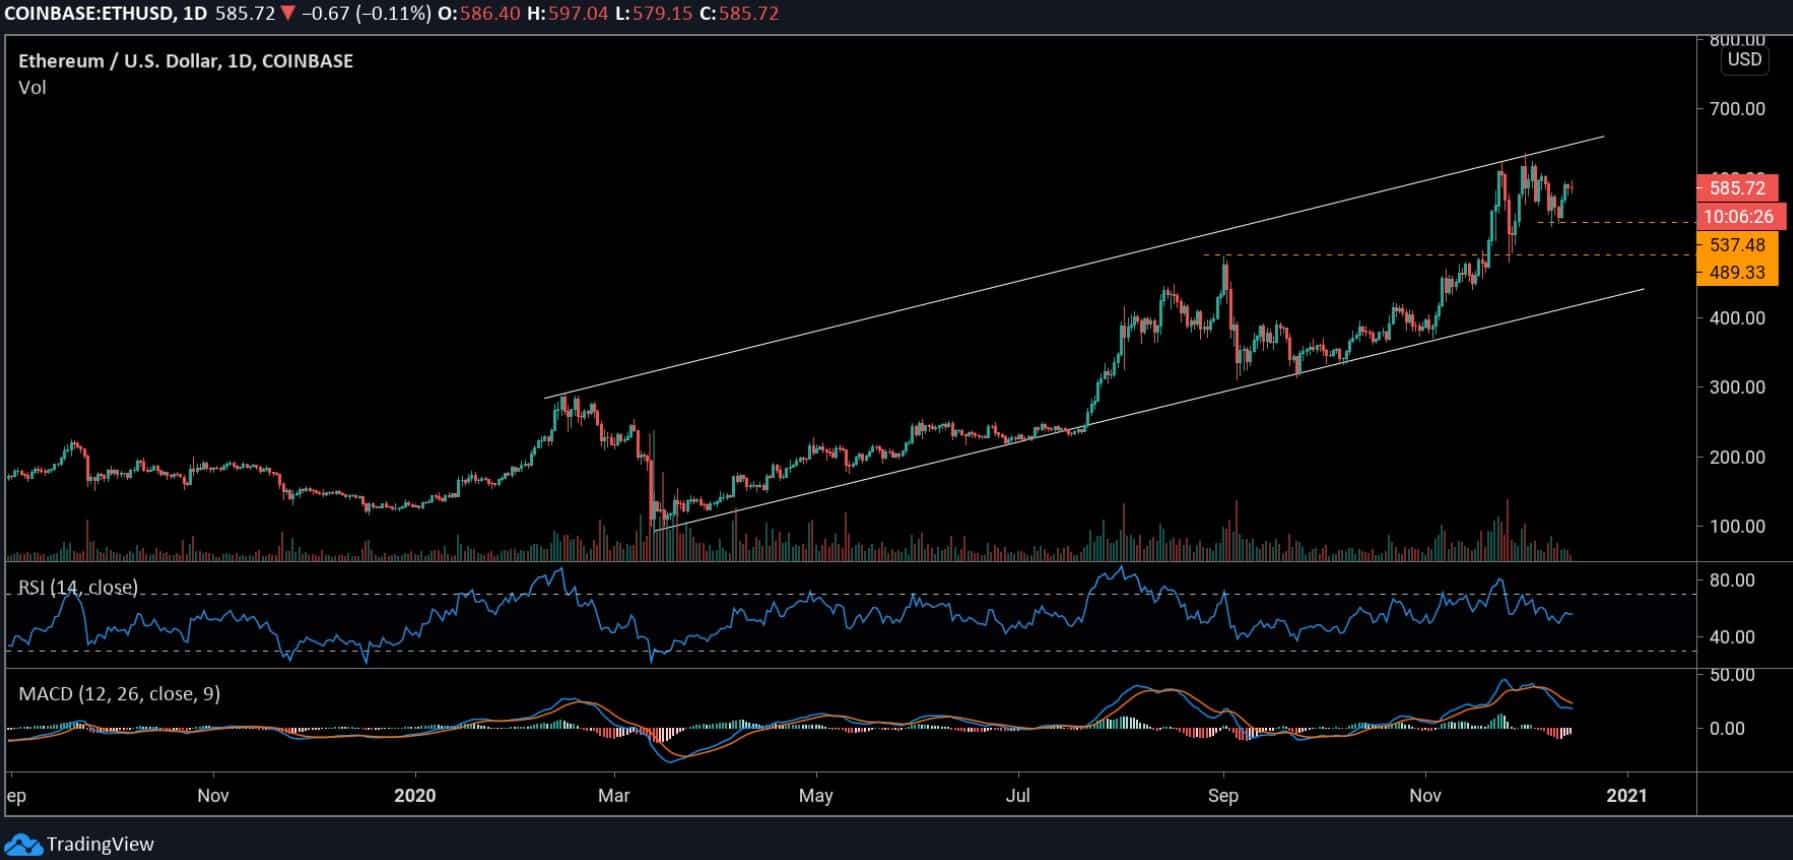
Ethereum saw a 2% increase over the past hours following recovery from $530 over the weekend. These gains have pushed the second largest coin by market cap to its current price of $586. ETH is likely to face critical resistance at $600.
Volatility may be low at the moment but its bullish trend is still looking strong in the long-term. Meanwhile, the last 21-day correction still keeps the market in favor of the bears. However, to reactivate a fresh increase, the $600 remains a key psychological level for the bulls to clear.
ETH/USD: Resistance and Support Levels
As mentioned above, if the price climbs further and increases above $600, the next resistance for the buyers would be $636 – the two years high – before advancing higher toward $700.
In the opposite direction, the first level of support is the current monthly low around $537. A drop beneath this level could see further losses to $489 and perhaps $450, where the channel’s support is holding. A breakdown from there may result in a complete mid-term reversal.
ETH/BTC: Ethereum Remains Indecisive
Key Resistance Levels: 0.0337 BTC, 0.0371 BTC, 0.041 BTC
Key Support Levels: 0.030 BTC, 0.028 BTC, 0.0263 BTC
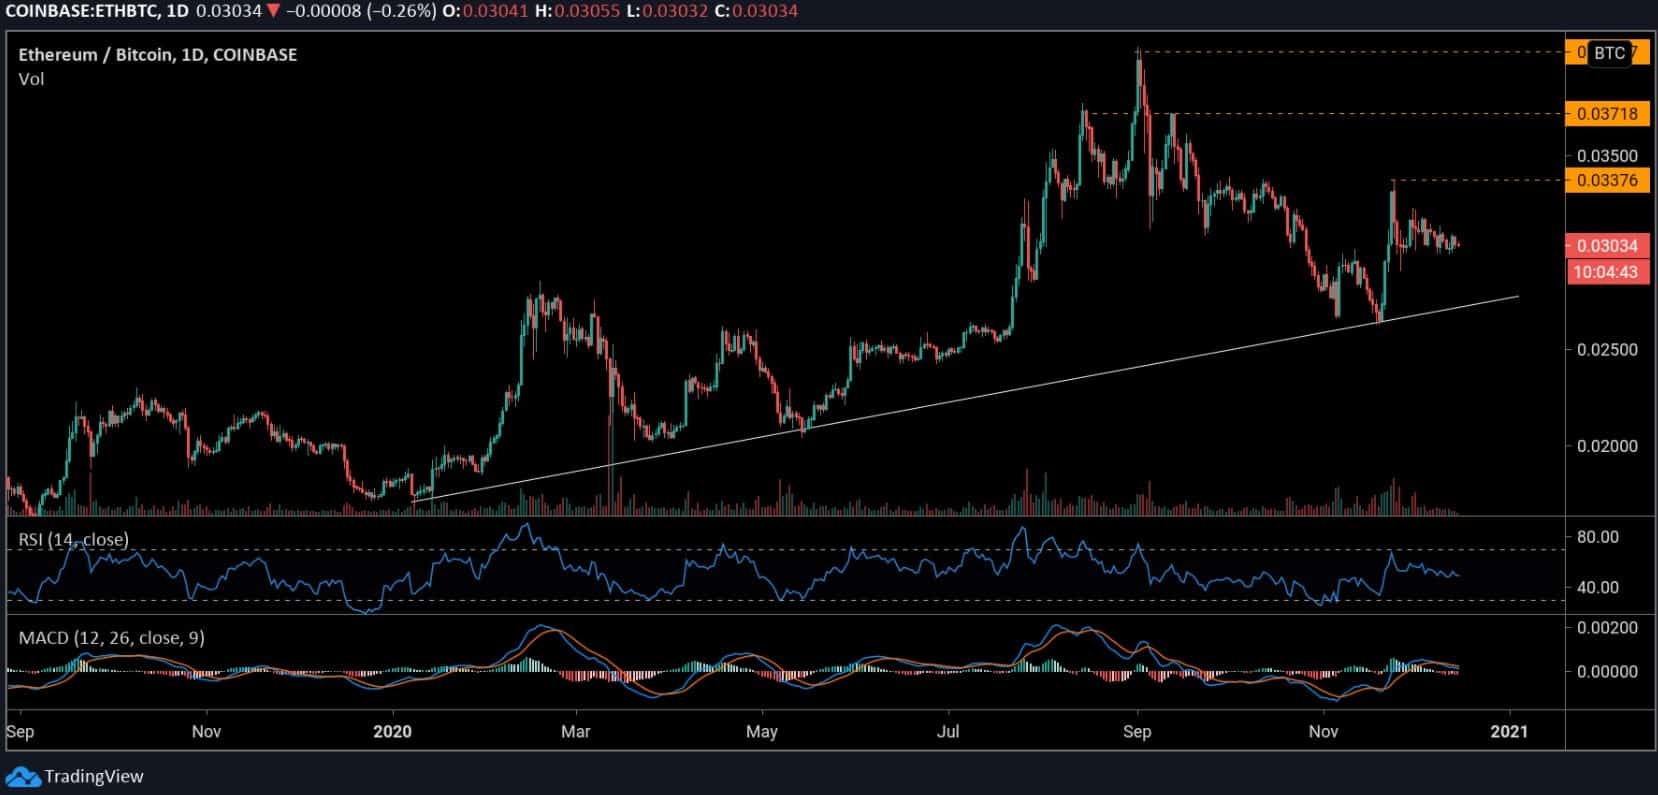
Against Bitcoin, ETH continued to hold the 0.030 BTC level as support since it saw a sharp rejection at 0.0337 BTC weeks back. Although the bears are still in charge, there’s hope for the bulls if this level continues to hold well. The price has been trading around this mentioned support for the past few hours now.
Considering the ascending trend line forming since January, the market is still charting in favor of the bulls from a long-term perspective. But the recent price actions suggest that bears are currently taking charge in the short-term.
ETH/BTC: Resistance and Support Levels
Breaking this crucial support, ETH may look for a key rebound at 0.028 BTC, around the long-term ascending line. From here, the next support may come around 0.0263 BTC.
On the other hand, if it can bounce off the daily RSI 50 level, the initial resistance to keep in mind is 0.0337 BTC. A push above this could send prices higher to 0.0371 BTC and potentially 0.041 BTC (November high). The MACD indicator suggests that there’s still hope for a recovery.
Disclaimer
The views and opinions expressed in this article are solely those of the authors and do not reflect the views of Bitcoin Insider. Every investment and trading move involves risk - this is especially true for cryptocurrencies given their volatility. We strongly advise our readers to conduct their own research when making a decision.

