Latest news about Bitcoin and all cryptocurrencies. Your daily crypto news habit.
- XRP has seen even more explosive price action since our previous market updates. As of this article’s writing, the altcoin has begun flirting with $0.25 for the first time in months, up over 100% from the March lows.
- The recent price action has convinced some analysts that XRP is about to enter a bull market phase.
- One trader went as far as to say that the recent price action is reminiscent of the 2017 bull run.
- Despite this, one analyst is reminding his followers that the asset is still facing down a pivotal macro resistance level. XRP failing to break this level may confirm that the altcoin is still in a macro downtrend that could end up with it setting new lows.
- The asset remains down over 90% from its all-time high price set during the peak of the last crypto market bubble.
XRP Is Still Facing Down a Pivotal Resistance
As crazy as this may sound, XRP is one of the best-performing assets of the past two days. It has outperformed both Bitcoin and Ethereum as those two market leaders have seen pullbacks.
Yet this price action hasn’t convinced everyone that the asset is in the clear.
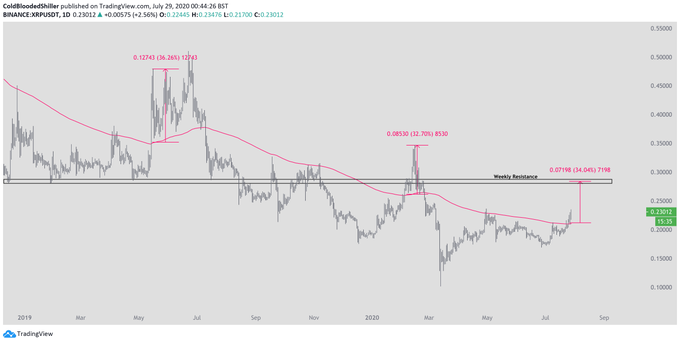
One trader shared that while XRP could surge 30% from current levels, it may see a harsh rejection at a “hugely significant” resistance:
“$XRP only really ramps up the pumps when it’s above the Daily 200EMA. Both of the last major moves really kickstarted once this was achieved. Past pumps average 33% so if we look at the same for this move we land right up against the hugely significant Weekly resistance.”
XRP price analysis by trader Cold Blooded Shiller (ColdBloodShill on Twitter). Chart from TradingView.com
This sentiment was echoed by another analyst, who argued that XRP has one of the “worst looking” charts out of the top cryptocurrencies:
“One of the worst looking charts in my opinion, even though we have seen some upside over the past month this really doesn’t matter considering we are yet to break $0.25… This region needs to be taken out and flipped before you can be really bullish, LTF rejecting.”
Bitcoin Dominance Favoring BTC Over Alts
Stepping back, it’s important to point out that Bitcoin dominance analysis suggests that BTC will outperform altcoins in the weeks ahead.
Macro BTC dominance chart with TD Sequential indicator shared by a Telegram channel. Chart from TradingView.com
As reported by Bitcoinist previously, the measure formed a Tom Demark Sequential “buy 9” just last week. The Tom Demark Sequential is a time-based indicator that prints “9 “candles when an asset/market is poised to see an inflection point.
This buy 9 suggests that BTC will outperform altcoins in the weeks ahead.
Featured Image from Shutterstock
Price tags: xrpusd, xrpbtc
Charts from TradingView.com
Despite Surge, XRP Is Still Facing Down "Hugely Significant" Resistance
Disclaimer
The views and opinions expressed in this article are solely those of the authors and do not reflect the views of Bitcoin Insider. Every investment and trading move involves risk - this is especially true for cryptocurrencies given their volatility. We strongly advise our readers to conduct their own research when making a decision.

