Latest news about Bitcoin and all cryptocurrencies. Your daily crypto news habit.

Quite often, MS SQL Server users, developers and administrators are faced with performance issues either in databases or the RDBM in general. This is why the MS SQL Server performance monitoring can be very important.
In this article, we’ll look at some aspects of this process, with the main question being — ‘How to detect which resources are currently lacking?’
Through the course of this guide, we are going to use a lot of different scripts. For them to work properly, we’ll first need to create the ‘inf’ schema in the desired database. This can be achieved by executing the following code:
use <database_name>;
go
create schema inf;
How to Detect a Lack of RAM
The first sign of a RAM deficit is MS SQL Server instance using all RAM that was specifically dedicated to it.
Let’s create the following inf.vRAM view:
With this, we can check if our MS SQL Server instance is currently using all dedicated memory:
select SQL_server_physical_memory_in_use_Mb, SQL_server_committed_target_Mb
from [inf].[vRAM]
If the SQL_server_physical_memory_in_use_Mb value doesn’t go lower than SQL_server_committed_target_Mb, then we will need to perform a wait statistics check.
To detect a lack of RAM through wait statistics, let’s create a inf.vWaits view:
In this case, the following query can help us detect RAM deficits:
SELECT [Percentage]
,[AvgWait_S]
FROM [inf].[vWaits]
where [WaitType] in (
‘PAGEIOLATCH_XX’,
‘RESOURCE_SEMAPHORE’,
‘RESOURCE_SEMAPHORE_QUERY_COMPILE’
)
Specifically, we need to focus on the Percentage and AvgWait_S values. If both of these values produce concerning results, there’s a very high chance of MS SQL Server lacking memory. Exactly what results can be considered unwanted depends heavily on your system. However, we can start at Percentage>=1 and AvgWait_S>=0.005 being decent signs of a RAM deficit.
To output these values to a monitoring system (i.e., Zabbix), we can create the following queries:
- Percentage of resources used by RAM wait types (calculated from the sum of all such wait types):
select coalesce(sum([Percentage]), 0.00) as [Percentage]
from [inf].[vWaits]
where [WaitType] in (
‘PAGEIOLATCH_XX’,
‘RESOURCE_SEMAPHORE’,
‘RESOURCE_SEMAPHORE_QUERY_COMPILE’
)
2) Time spent on RAM wait types, in ms (the greatest value chosen from the list of average delays of all such wait types):
select coalesce(max([AvgWait_S])*1000, 0.00) as [AvgWait_MS]
from [inf].[vWaits]
where [WaitType] in (
‘PAGEIOLATCH_XX’,
‘RESOURCE_SEMAPHORE’,
‘RESOURCE_SEMAPHORE_QUERY_COMPILE’
)
Based on the dynamics of these values, we can make an informed conclusion on whether there is enough RAM for our instance of MS SQL Server.
Detecting Excessive CPU Load
To detect a lack of CPU time, we can simply use the sys.dm_os_schedulers system view. If the runnable_tasks_count value is always greater than 1, there’s a very high chance that our instance of MS SQL Server requires more CPU cores for optimal operation.
To output this value to a monitoring system (i.e., Zabbix), we can use the following query:
select max([runnable_tasks_count]) as [runnable_tasks_count]
from sys.dm_os_schedulers
where scheduler_id<255
Based on the dynamics of the retrieved values, we can make an educated decision on whether there’s enough processor time (or amount of CPU cores) for our MS SQL Server instance.
However, you should keep in mind that the queries may themselves require multiple threads to be executed. Also, the optimizer can sometimes misjudge the query’s complexity. Thus, too many threads may be dedicated to executing the query — threads that cannot be processed simultaneously at this point in time. This creates an additional wait type which associated with a lack of processor time and an increasing queue for the schedulers that are using specific CPU cores. So, the runnable_tasks_count value will grow in such circumstances.
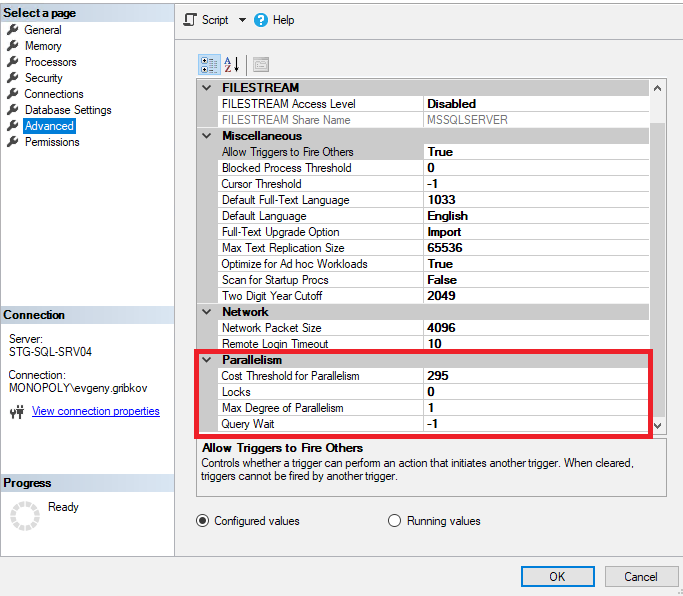
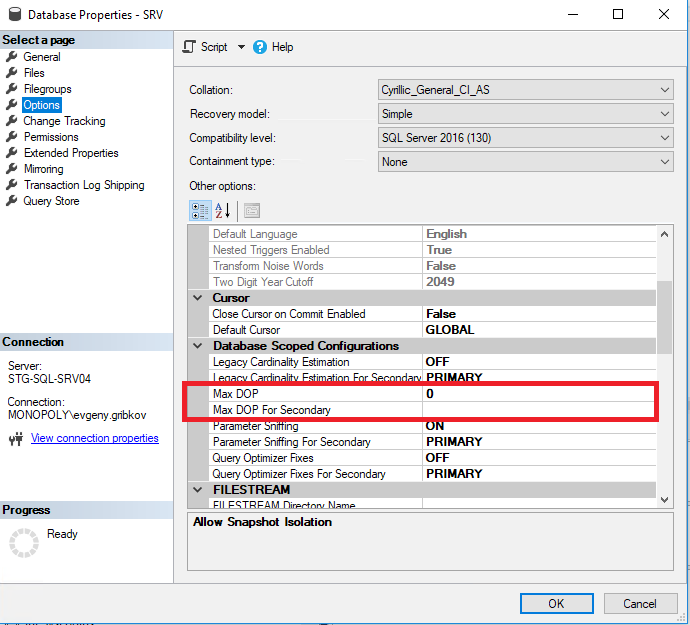
In this case, before increasing the amount of dedicated CPU cores, we would first need to configure the parallelism settings of our MS SQL Server instance. Additionally, starting from the 2016 version, we would also need to properly set up parallelism for all required databases:
 Fig.1. Configuring the parallelism settings of an MS SQL Server instance.
 Fig.2. Setting up parallelism for databases (starting from the 2016 version)
Here, we should consider the following parameters:
1) Max Degree of Parallelism — this sets the maximum amount of threads that can be dedicated to each query (the default value for this is 0 — this means that the limitations are placed automatically based on your OS and MS SQL Server edition)
2) Cost Threshold for Parallelism — estimated cost of parallelism (the default value is 5)
3) Max DOP — sets the maximum amount of threads that can be dedicated to each query on the database level. This value cannot be more than „Max Degree of Parallelism“. (the default value is 0 — which means that the limitations are placed automatically based on your OS and MS SQL Server edition, as well as on the entire server’s “Max Degree of Parallelism” value)
Here, it’s not really possible to devise one correct strategy for all situations, so you will need to analyze complex queries on a case-by-case basis.
I would personally recommend the following algorithm for configuring the parallelism settings in OLTP systems:
1) disable parallelism by setting the „Max Degree of Parallelism“ value to 1 for the entire instance
2) analyze the most complex queries and choose an optimal number of threads for them
3) set the „Max Degree of Parallelism“ value to the number we got in step 2 — both for individual databases and for the entire instance.
4) analyze the most complex queries and detect if there are any negative effects from multithreading. If this is the case, increase the „Cost Threshold for Parallelism“ value.
For systems like 1C, Microsoft Crm and Microsoft NAV, the best decision would be to disable parallelism.
The same solution applies if you use the Standard edition as it has limitations on the number of CPU cores.
However, this algorithm would not work for OLAP systems.
I would recommend the following parallelism setup algorithm for OLAP systems:
1) analyze the most complex queries and choose an optimal number of threads for them
2) set the „Max Degree of Parallelism“ value to the number we got in step 1 — both for individual databases and the entire instance.
3) analyze the most complex queries and detect if there are any negative effects from multithreading. If this is the case, either increase the „Cost Threshold for Parallelism“ value or repeat steps 1–2.
So, for OLTP systems, we aim for switching from single-threading to multithreading, while for OLAP systems, the opposite is true — we want to switch from multithreading to single-threading. In this way, we can choose the optimal parallelism settings both for the entire MS SQL Server instance and individual databases.
It’s also important to know that parallelism settings should be periodically reconfigured as the time passes based on the results of MS SQL Server performance monitoring.
SQL Server Monitoring in dbForge Studio For SQL Server
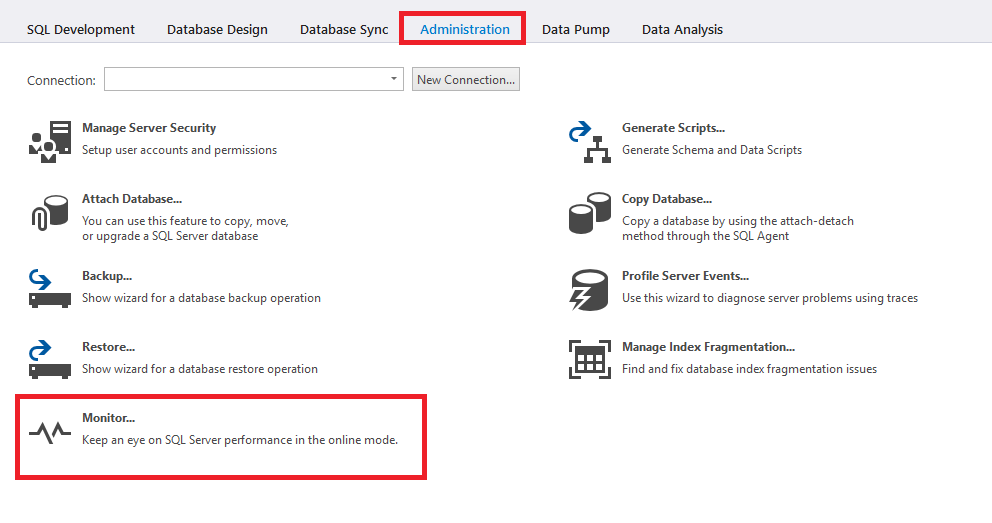
A SQL Server performance monitor is available in Devart’s dbForge Studio for SQL Server:
 Fig.3 SQL Monitor in dbForge Studio for FQL Server
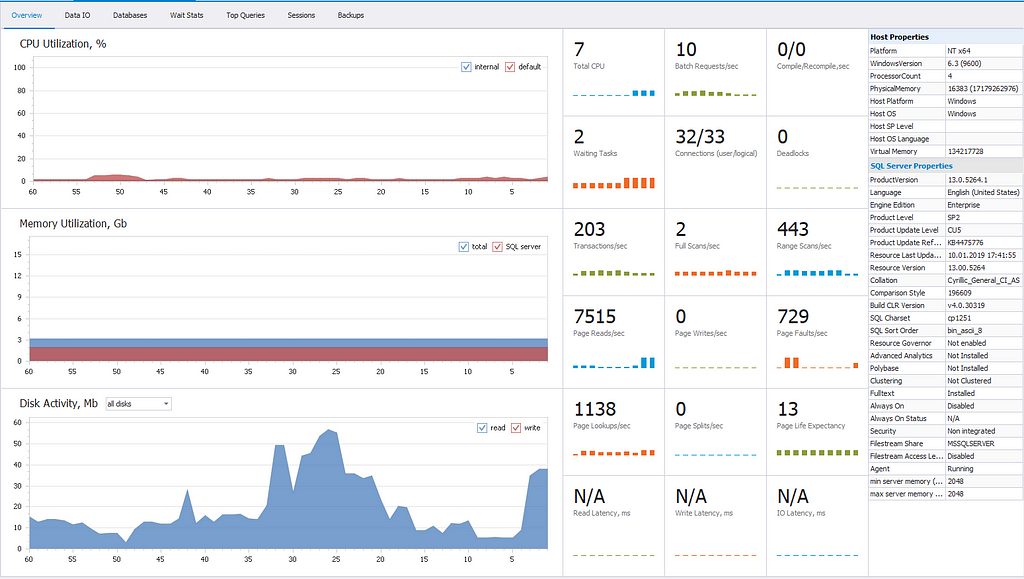
Let’s look at the main working window which shows the following statistics in real time:
 Fig.4 Overview Tab of SQL Monitor
- CPU Utilization, % — a diagram that shows CPU load created by the server
- Memory Utilization, Gb — a diagram that displays RAM usage (total — how much memory is used by all processes combined, sql server — how much memory SQL Server uses)
- Disk Activity, Mb — a diagram that shows disk write abd read operations
- Disk operations delay
- Total CPU — percentage of total CPU load
- Total CPU — percentage of total CPU load
- Deadlocks
- Waiting Tasks
- Connections (user/login)
- Transactions/sec
- Full Scans/sec
- Range Scans/sec
- Page Reads/sec
- Page Writes/sec
- Page Lookups/sec
- Page Splits/sec and Page Life Expectancy
- Page Daults/sec
- Host Properties (ProcessorCount, PhysicalMemory, Platform, WindowsVersion, Virtual Memory, Host Platform, Host OS, Host SP Level, Host OS Language)
- SQL Server Properties (ProductVersion, Language, Engine Edition, Product Level, Product Update Level, Product Update Reference, Resource Last Updated, Resource Version, Collation, Comparison Style, Build CLR Version, SQl Charset, SQL Sort Order, Resource Governor, Advanced Analytics, Polybase, Clustering, Fulltext, Always On, Always On Status, Security, Filestream Share, Filestream Access Level, Agent)
Summary
In the first part of the article, we looked at the ways in which you can monitor MS SQL Server activity to detect a lack of RAM.
We have also seen the main statistics provided in dbForge Studio for SQL Server by Devart that can help with MS SQL Server monitoring.
Some Aspects of MS SQL Server Monitoring. Part 1. was originally published in Hacker Noon on Medium, where people are continuing the conversation by highlighting and responding to this story.
Disclaimer
The views and opinions expressed in this article are solely those of the authors and do not reflect the views of Bitcoin Insider. Every investment and trading move involves risk - this is especially true for cryptocurrencies given their volatility. We strongly advise our readers to conduct their own research when making a decision.