Latest news about Bitcoin and all cryptocurrencies. Your daily crypto news habit.
 A piece of cake. Get it?
Node.js monitoring is a tricky task. There are certain challenges to look out for. Because Node.js is a dynamically typed programming language and single-threaded you give the interpreter and runtime a lot of freedom to make decisions. This can easily result in memory leaks and high CPU loads. Parallel execution is simulated in Node.js by using asynchronous execution of functions. But, if a single function blocks the thread or event queue, the application performance will take a huge hit.
This article will dive into how you can monitor your application and make sure these issues don’t happen. I’ll cover Application Performance Management (APM) and why it’s important, but also Log Management and how you can create structured logs to help you debug, troubleshoot and track errors in your application.
Ready? Let’s jump in.
What is Application Performance Management?
Monitoring your software revolves around making sure everything works the way it should. You want your users to have a pleasant experience in using your software. A proper definition of what monitoring is, by the dictionary, would sound something like this.
To observe and check the progress or quality of (something) over a period of time; keep under systematic review.
It sounds rather vague. So let’s skip the formalities and jump into some real-world use-cases. Monitoring provides a way of preventing the loss of customers and crucially, stops you from wasting time. Time is money, and preventing downtime, loss of resources and saving your product from performance issues will save you money in the long run; which is and should be the core focus of every business — to make money.
Application Performance Management (APM) defines a way to monitor the performance and availability of software applications. It’s standardized by showing charts with performance metrics for things like request count, response times, CPU usage and memory utilization. These charts show you averages, percentiles and any custom grouping you might want to define. I’ll walk you through this in the next few sections of this tutorial. You can easily add APM to your Node.js app with Sematext’s integration for Node.js.
What Node.js Metrics to Monitor?
There are a few main factors you want to take into consideration when monitoring your application. Ranging from general info about system health all the way to how your servers are utilizing memory and CPU cycles. I’ve covered this in more detail in part 1 of this series called Top Node.js Metrics to Monitor. Let’s do a quick recap before moving on.
System Health & Downtime
If your application isn’t working, your customers can’t spend money. As you can imagine, this is bad. What’s much worse is that it causes them to lose trust in you. The probability that they’ll come back is slim if they lose trust in you and your product. Your goal is to set up a monitoring solution to monitor how your system is behaving. It should notify you right away about downtimes, high latencies or any service issues that may occur.
Resource Utilization
Poorly-optimized services use more resources, cost more money and have higher latencies. Finding performance issues and giving you an easy way of solving them is why you need to choose your APM tool carefully. It should give you a way of improving your application so you don’t spend money, time and resources on unnecessary infrastructure because of your poor coding skills.
Eliminating performance bottlenecks ensures you don’t need to scale up your infrastructure when you have sudden spikes in traffic. That’s why monitoring CPU utilization and memory is a crucial step.
Node.js API Latency
It’s a fact that users don’t want to stick around and wait for your application to load. The mean wait-time is around 2 seconds. That’s how much time you have to make sure you don’t lose that customer for good. It’s no secret, the faster your product is, the more customers you’ll have. More importantly, user satisfaction will be higher.
What you can do to notice slow services is to collect data on a service level. If you have several APIs, make sure to analyze latency for each of them. This will give you more insight into the real reason why your services are slow.
Node.js Error Rates and Error Handling
Features can quickly turn into bugs. Failing code can go unnoticed for a long period of time if you don’t have a way of knowing about them. You can’t rely on your users telling you. If they stumble upon a problem, they’ll much more likely to leave your site than tell you.
To discover issues you need to monitor the amount and type of errors your application is producing. This includes 4xx/5xx status codes, runtime errors and application crashes. If you have a high number of errors, there’s a probability you have issues with code quality.
To keep error counts low, make sure to prioritize code quality, TDD and a nice CI/CD pipeline. This will create a sense of responsibility in your team and relieve a lot of stress for your developers because the testing and deployment process is automated.
If your APM tool is collecting error data as well, you’ll have a way of finding similar error patterns. This is incredibly convenient for saving time and improving your application’s stability and performance.
I’d also recommend pairing your monitoring tool with a log shipper. Using logs as support for your APM metrics will give you more fine-grained info about service-level performance. More about that in the next section.
What is Log Management?
Log Management is a crucial pillar for gaining proper insight into your application. From supporting APM with infrastructure-level logs to telling you more about your application life cycle with service-level logs, logs support you in every step of the way. From troubleshooting existing issues to planning new features, logging is a key step in implementing any new piece of code or fixing an old bug.
Logs paint a bigger picture, giving your APM supporting info that can often turn out to be crucial. Ideally, you’d always send all logs to the same central location, no matter their origin. Even if they can be entirely different such as infrastructure logs, database logs, or application logs, you should take them as a whole as they all impact your customers. You can capture server logs with Sematext Logagent.
What to log in Node.js?
It may be clear why you should log, but just to close the loop, let’s list the main reasons.
Node.js Performance Logs
APM tools will already show the performance of your application. The reason logging is important for performance is to get more detailed insight into which APIs, services, or functions have high latencies.
Debugging Node.js Logs
When things break you need a way to troubleshoot and find the issue. Debugging by analyzing logs and getting to the bottom of an issue is the first thing you will most likely do. Stuff happens. It gives you a way to see where the error occurred and show you a stack trace.
Error Tracking with Node.js Logs
To debug errors, you need to know they happened at all. Knowing when they occurred and how often they repeat, if they’ve been fixed, or if they return is crucial.
Analyzing Node.js Logs
Logs are rich sources of information. You can analyze logs to discover usage patterns to guide decisions.
You can get service level info with logs, which show the info about every API request in particular. This will help with troubleshooting, debugging and error tracking.
Monitoring for Node.js
Let me show you a nice and simple way of adding monitoring to your existing Express.js application. We’ll start with a simple server with a few API endpoints. First, create a new directory and name it nodejs-monitoring. Open up a terminal window, initialize NPM, and install a few modules.
$ npm init -y$ npm i express dotenv spm-agent-nodejs
This is everything you need in order to have an APM tool running and monitoring your application. Now, create two files, an app.js and a .env. Add this piece of code to the app.js.
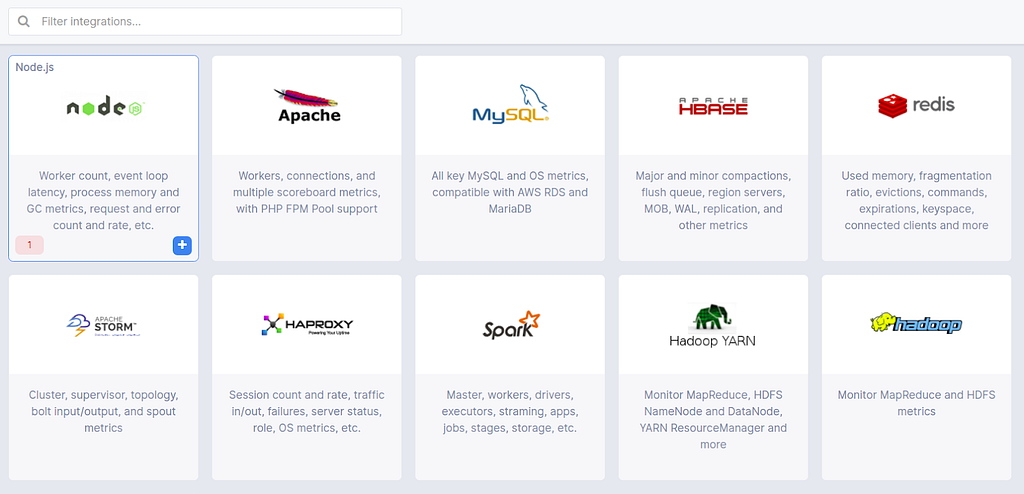
require('dotenv').config()require('spm-agent-nodejs')const express = require('express')const app = express()app.get('/api', (req, res, next) => { res.status(200).send('Api Works.')})app.get('/api/fast', (req, res, next) => { res.status(200).send('Fast response!')})app.get('/api/slow', (req, res, next) => { setTimeout(() => { res.status(200).send('Slow response...') }, 1000)})app.get('/api/error', (req, res, next) => { try { throw new Error('Something broke...') } catch (error) { res.status(500).send(error) }})app.listen(3000, () => console.log('Server is running on port 3000'))The Sematext Agent for Node.js requires a specific SPM_TOKEN environment variable to work correctly. That’s why we’re requiring dotenv at the top of the app.js. To get the token, which is the location where your Node.js application will send the metrics, you need to create a Sematext Monitoring App. Open up your browser, sign up to Sematext Cloud if you haven’t already, and click the blue Create Monitoring App button. This takes you to a screen where you have to choose which type of app you want to monitor.
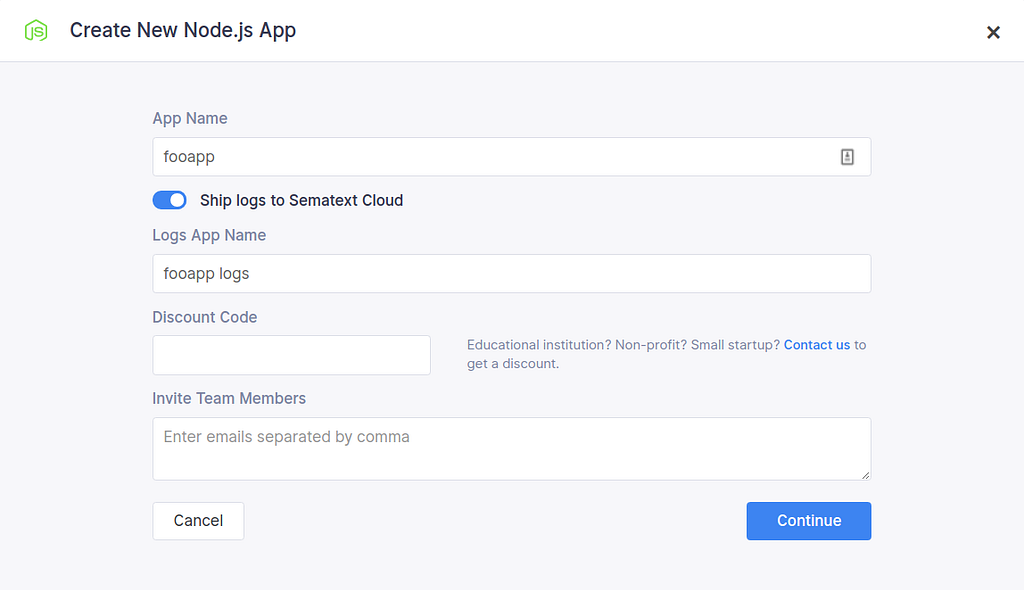
Give your app a name, and toggle the Ship Logs switch as well.
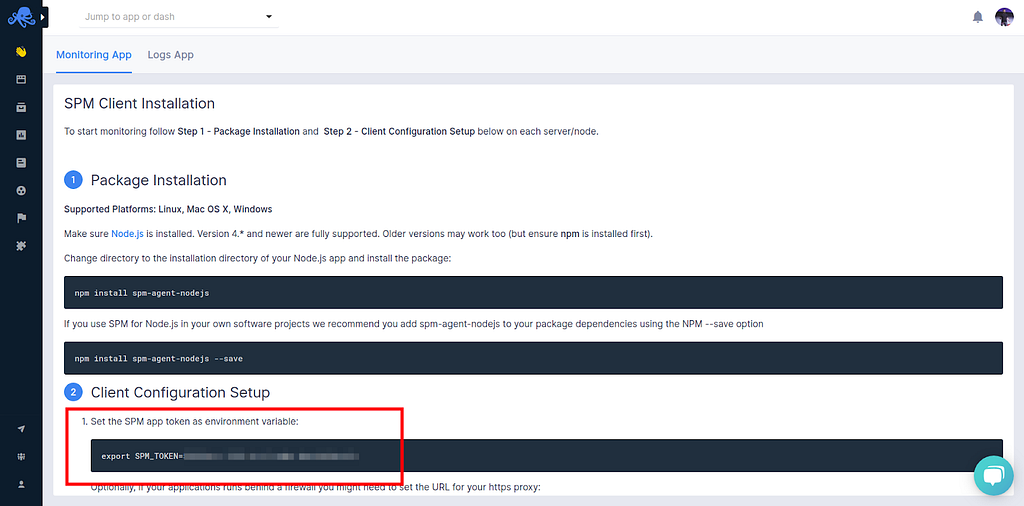
Click create and you’re done! The only thing now is to copy the SPM_TOKEN.
Once you have it copied, move back to the code editor. Open the .env file and add the token.
SPM_TOKEN=some-value-for-your-token
That’s it! Run your application and test the endpoints. You’ll see metrics show up in Sematext after a few moments.
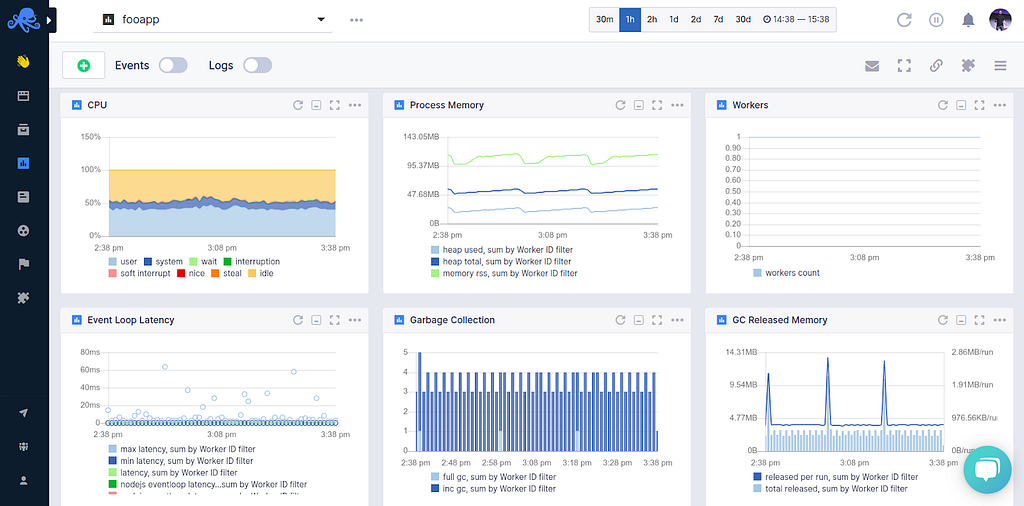
In the Sematext Node.js Monitoring App, you’ll see a predefined set of dashboards that show more than 70 different Node.js APM and infrastructure metrics in predefined charts grouped into an intuitively organized set of monitoring dashboards.
Alerting on Node.js Metrics
To save you time, Sematext automatically creates a set of default alert rules such as alerts for low disk space. You can create additional alerts on any metric. Watch Alerts in Sematext Cloud for more details.
When you create a Monitoring App, Sematext automatically creates a set of default alerts for letting you know about heartbeats and low disk space. You can create three types of alerts.
- Heartbeat alerts notify you when your server is down.
- Threshold-based alerts notify you when a metric value crosses a predefined threshold.
- Alerts based on statistical anomaly detection notify you when metric values suddenly change and deviate from the baseline.
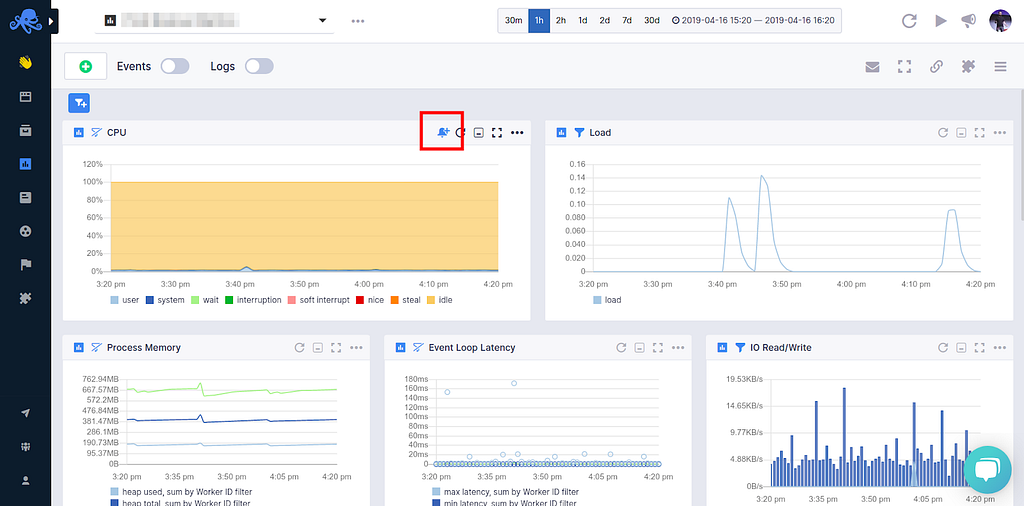
To create an alert you hover over a metric and press the tiny bell icon.
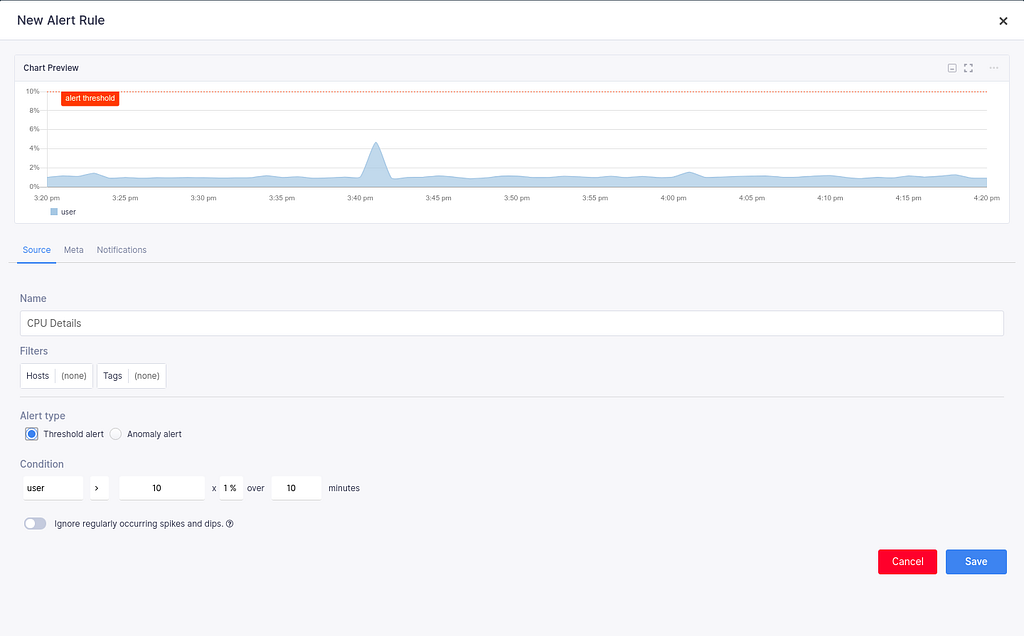
The alert rule applies the filters from the current view and you can choose various notification options such as email or configured notification hooks like Slack, Pusher, etc. Alerts are triggered either by anomaly detection, watching metric changes in a given time window or through the use of classic threshold-based alerts.
By adding one module, the Sematext Agent for Node.js, you have full system insight with three different types of alerts and notification hooks. You can also see detailed performance metrics for your Node.js application. What you don’t have is API and service level info about which requests are failing and how to troubleshoot them. This is where logging comes into play. Let’s add a way to structure and send logs to Sematext.
Log Management for Node.js
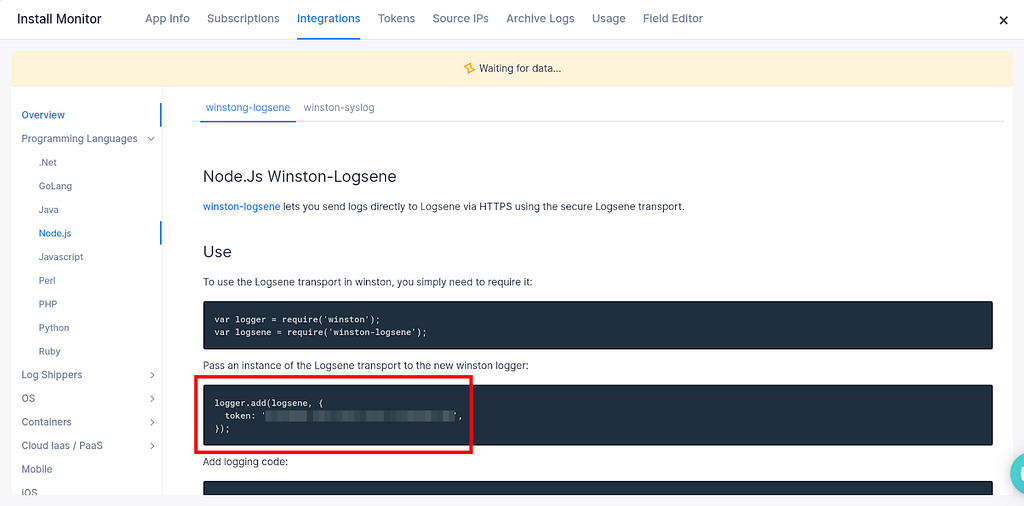
Adding log management is a bit more tricky, but nothing you can’t handle. Open up the Sematext Logs App you created alongside the Monitoring App. It’s easy to find in the left side-nav under Logs. Open the integrations guide and find the Node.js integration. Copy the token and add it to your .env file, right under the SPM_TOKEN.
SPM_TOKEN=some-value-for-your-tokenLOGS_TOKEN=some-value-for-your-token
Now you need to install a few more modules. There are a few, four to be precise.
$ npm install morgan morgan-json winston winston-logsene
Winston is the logger you’ll use, and the Winston-logsene module is an implementation of the Sematext log shipper that works seamlessly with Winston. Morgan is an HTTP logger that logs all HTTP requests hitting your APIs. The Morgan JSON module is a simple formatter for the message Morgan logs out.
The code edits are minor, here’s what your app.js should look like.
require('dotenv').config()require('spm-agent-nodejs')const express = require('express')const app = express()// add this part//////////////////////////////////const winston = require('winston')const morgan = require('morgan')const json = require('morgan-json')const format = json({ method: ':method', url: ':url', status: ':status', contentLength: ':res[content-length]', responseTime: ':response-time'})const Logsene = require('winston-logsene')const logger = winston.createLogger({ transports: [new Logsene({ token: process.env.LOGS_TOKEN, // token level: 'info', type: 'api_logs', url: 'https://logsene-receiver.sematext.com/_bulk' })]})const httpLogger = morgan(format, { stream: { write: (message) => logger.info('HTTP LOG', JSON.parse(message)) }})app.use(httpLogger)/////////////////////////////////app.get('/api', (req, res, next) => { logger.info('Api Works.') // added logger res.status(200).send('Api Works.')})app.get('/api/fast', (req, res, next) => { res.status(200).send('Fast response!')})app.get('/api/slow', (req, res, next) => { setTimeout(() => { res.status(200).send('Slow response...') }, 1000)})app.get('/api/error', (req, res, next) => { try { throw new Error('Something broke...') } catch (error) { logger.error(error) // added logger res.status(500).send(error) }})app.listen(3000, () => console.log('Server is running on port 3000'))With this setup, every HTTP request hitting your APIs will get logged and stored in Sematext Logs. Winston also lets you define custom debug, error, and info logs for troubleshooting your application.
By adding 25 more lines of code and you’ve added Log Management to your Node.js application. Pretty cool.
Node.js Log Search and Dashboards
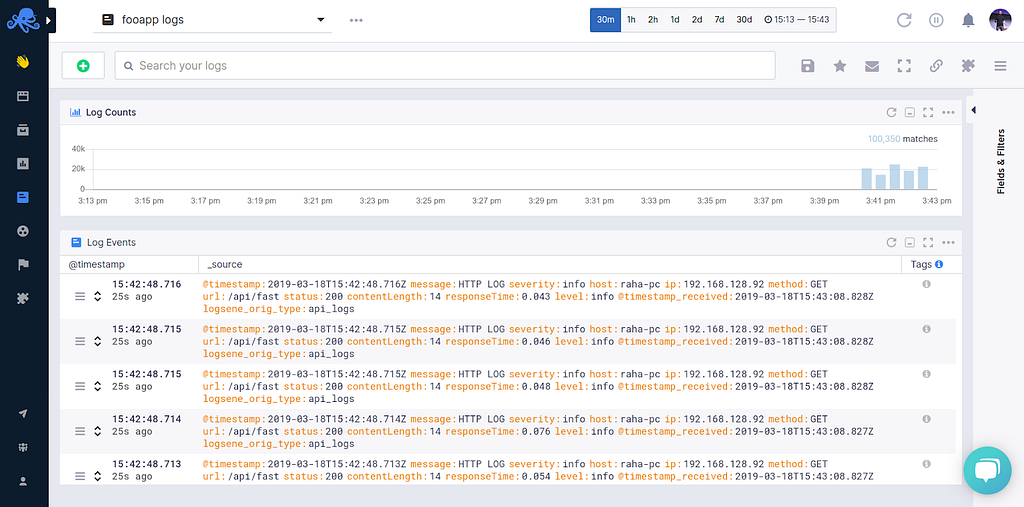
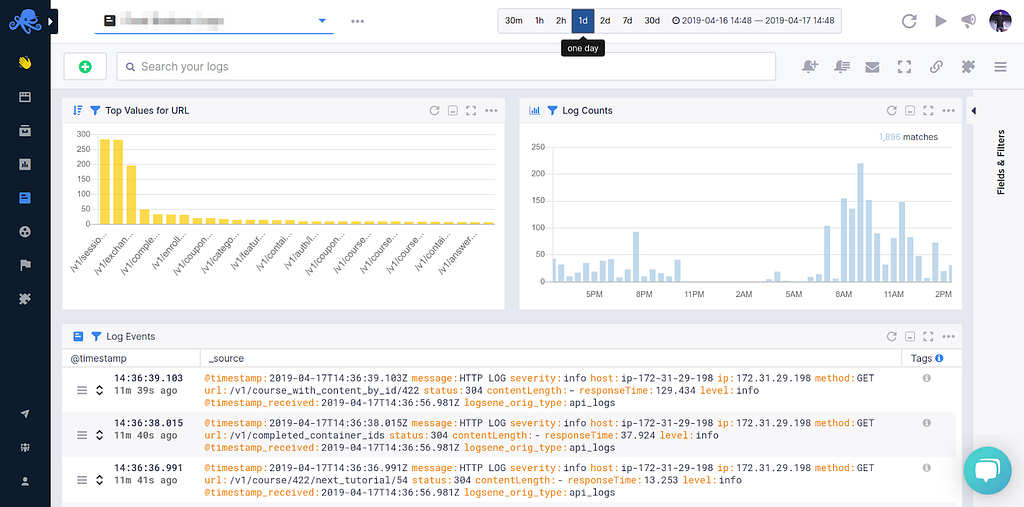
Once you have logs in Sematext you can search through them when troubleshooting, save queries you run frequently or create custom logs dashboards.
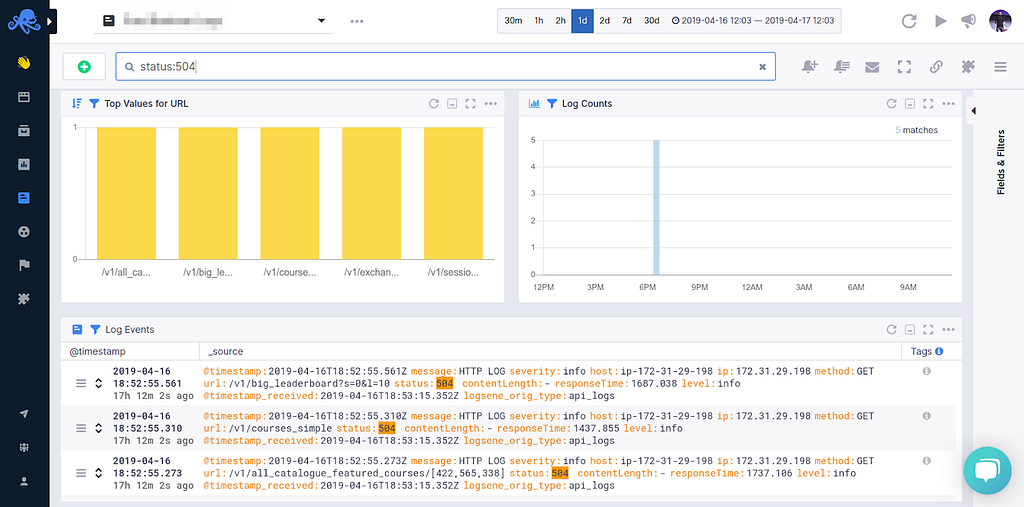
Searching logs is natural and works just like you would search for things with Google.
- Use AND, OR, NOT operators: (error OR warn) NOT exception
- Group AND, OR, NOT clauses with parentheses: message:(exception OR error OR timeout) AND severity:(error OR warn)
- Use + and — to include and exclude: +message:error -message:timeout -host:db1.example.com
- Use field references: message:timeout
- Use quotation marks to search for phrases: message:”fatal error”
Digging through logs can be a repetitive process. You will use the same searches over and over again. To avoid this, you can save queries and instantly run them again without having to type anything. Check out the using logs for troubleshooting guide and how it makes your life easier.
Alerting on Node.js Logs
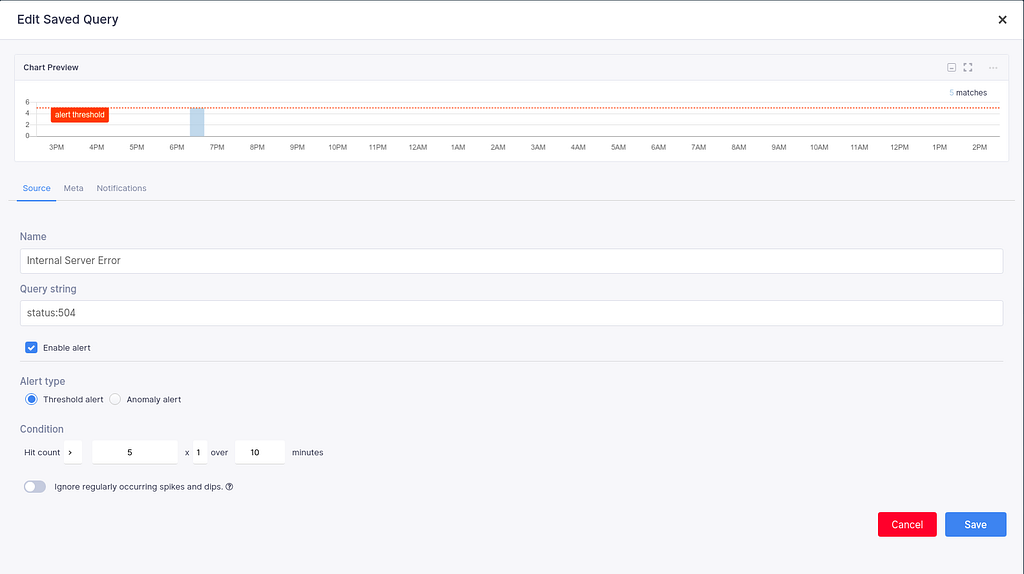
To create a Logs alert run a query that matches the log events you want to be alerted about. Write the query in the search box and click to the tiny bell icon.
Similar to the setup of alert rules for metrics, we can define threshold-based or anomaly detection alerts based on the number of matching log events the alert query returns.
Check out the Alerts guide in the docs to read more about creating alerts for logs and metrics.
Node.js Metrics and Log Correlation
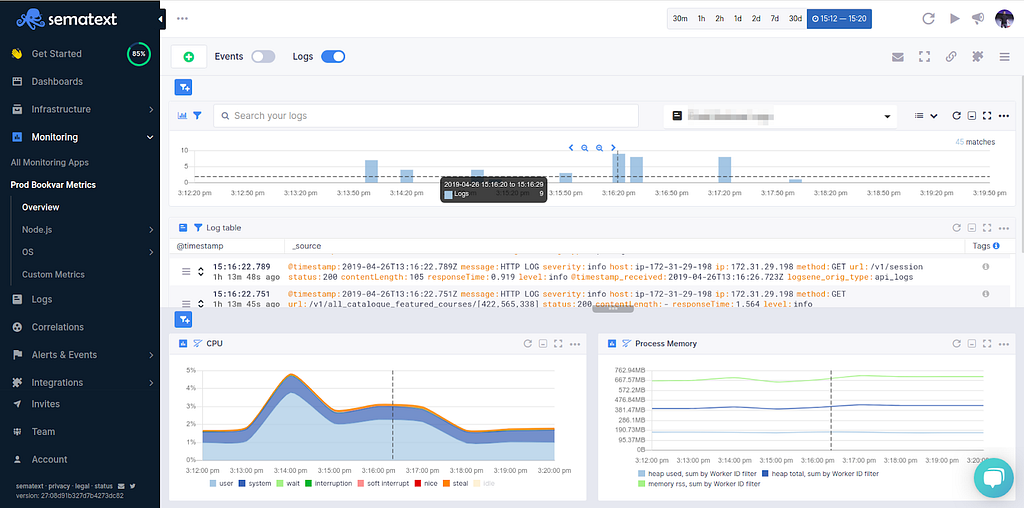
How do you troubleshoot your Node.js applications? I tend to check for spikes in my metrics, then digging down to find the root cause of the problem. In the majority of the cases, I scour logs for fine-grained info that caused the spike. Sematext makes it simple. Logs and metrics are linked and you can see in the same timeline what log correlates to which spike in metrics.
The logs are also centralized. Searching and filtering them is blazing fast, and the filtering syntax I showed above is straightforward. Having metrics, logs, and events on the same screen linked with the same timeline is so satisfying and makes my life easier when troubleshooting.
Which Node.js Metrics Should You Watch Out For?
Node.js is based upon the Google Chrome V8 JavaScript engine. As any modern programming language, it has Garbage Collection that reclaims memory used by variables that are no longer needed. The issue with this type of garbage collection is that it stops the program execution.
The key takeaway here is that latency is connected to throughput. Node.js is single threaded, but has non-blocking I/O interactions because of its asynchronous nature, meaning concurrency can increase during load. High latency and concurrency will increase memory usage. When the memory usage spikes, it will also increase the garbage collection activity, costing precious CPU cycles.
With regard to garbage collection metrics, you should first measure all the time spent on garbage collection. If there is a growing trend in garbage collection activity, you can expect CPU and memory usage to spike rather quickly as well.
Conclusion
In this article, you’ve learned about the concepts of monitoring and logging a Node.js app by using Application Performance Management and Log Management tools. We’ve covered the key things to look out for to keep your system healthy while keeping latencies as low as possible. By using APM to give you an overview of what’s going on and Log Management to drill down to the details about service-level info, you can gain proper insight into your system’s performance.
You have also learned how to add Sematext APM and Log Management to your existing Express.js application. All you needed was to add 26 lines of code and a few NPM modules.
We used out-of-the-box and custom dashboards, metrics and log correlation, anomaly detection, and alerts. And with other open-source integrations, like MongoDB or Nginx, you can easily monitor Node.js alongside all other technologies in your infrastructure. When choosing a tool for monitoring your application, make sure to pick one that is capable to give you full observability. Seeing metrics for all the systems that surround your Node.js apps is precious.
If you need an observability solution for your software stack, check out Sematext. We’re pushing to open source our products and make an impact. If you’d like to try us out and monitor your Node.js applications, sign up to get a 30-day pro trial, or choose the free tier right away.
Hope you guys and girls enjoyed reading this as much as I enjoyed writing it. If you liked it, slap that tiny share button so more people will see this tutorial. Until next time, be curious and have fun.
Originally published at https://sematext.com on May 6, 2019.
Node.js Monitoring Made Easy was originally published in Hacker Noon on Medium, where people are continuing the conversation by highlighting and responding to this story.
Disclaimer
The views and opinions expressed in this article are solely those of the authors and do not reflect the views of Bitcoin Insider. Every investment and trading move involves risk - this is especially true for cryptocurrencies given their volatility. We strongly advise our readers to conduct their own research when making a decision.
