Latest news about Bitcoin and all cryptocurrencies. Your daily crypto news habit.
 Source: Memegenerator
Data Visualisation is an integral part of the analytical process, it allows you to tell a story about your data in a way that is easy to communicate to all business units and gives you an overview of how different facets of your business are performing. It is analogous to a movie; sometimes the best way to communicate a message is through a visually appealing modem capable of capturing people's attention and increasing recall.
It goes without saying that unlike the image above, visualisations produced must be accurate, especially if these visualisations inform reports that are used to guide business and marketing decisions.
Quite recently I was contracted to work as an analyst for a department in a big bank. While I was disappointed to discover that they actually don't keep wads of cash in the building, I found the work quite interesting. One of the tasks I had to complete involved developing reports to visualise digital marketing data. One of these reports, without divulging too much, involved visualising data from Google My Business (GMB).
In line with this task let's create a scenario. Imagine you work in a big corporation, with multiple branches across a country/the world. All the physical branches are listed on GMB because you want people to find your branches with ease and you want to attract potential new customers from people carrying out a search query related to your industry. Each month you would like to get a summary of the searches, actions and views carried out pertaining to your branch such as; total map views, total actions, total views, top viewed locations and top 10 locations by searches and actions carried out by users. You could probably create these visualisation on Excel, Google Data Studio and possibly Tableau, but for the purposes of this blog, I decided to create a web app using Flask that would allow users to upload the discovery CSV extracted from GMB, clean up the CSV and create visualisations with just a single click.
Having never created a web-app on Python, I settled for flask because from my research, it appeared to be relatively easy to understand.
Creating the folder for the app
The Flask documentation has a pretty easy to follow tutorial on how to set up the virtual environment and installing dependencies to start the project off. The first step involved creating the project folder and the virtual environment on my Jupyter terminal (my default shell is bash). After setting this up and activating my virtual environment I went on to create a requirements.txt file. This file consists of all the libraries I would need to install to run my app. The idea behind this is to allow another end-user who wants to interact with my app to recreate the virtual environment on his/her machine along with the libraries required for the app to run.
#requirements.txt
Flask==0.12.3click==6.7gunicorn==19.7.1itsdangerous==0.24Jinja2==2.9.6MarkupSafe==1.0pytz==2017.2requests==2.13.0Werkzeug==0.12.1pandas==0.23.0matplotlib==1.4.2numpy=1.8.2
The requirements file was created in the same folder I had just created. After creating this file I installed the libraries listed in my requirements file using pip.
pip install -r requirements.txt
Building the web app
After loading the relevant libraries. The first step was allowing users to upload a report.
UPLOAD_FOLDER = ‘./Downloads/gmbreports’if not os.path.exists(UPLOAD_FOLDER): os.makedirs(UPLOAD_FOLDER)ALLOWED_EXTENSIONS = ‘csv’app = Flask(__name__)app.config['UPLOAD_FOLDER'] = UPLOAD_FOLDERdef allowed_file(filename): return '.' in filename and \ filename.rsplit('.', 1)[1].lower() in ALLOWED_EXTENSIONSWith this code, I restricted the uploads allowed to CSV formatted files and specified that the file uploaded would be saved under the downloads/gmbreports folder in my local machine. I added a condition that if the path did not exist, it had to be created.
I then created an instance of the Flask class for my web app, this 'starts off' my flask web app.
Interface
Since the purpose of the app is to take in input in the form of a CSV and produce a report, I had a create a function that would prompt users to upload a CSV.
@app.route('/', methods=['GET', 'POST'])def upload_file(): if request.method == 'POST': if 'file' not in request.files: flash('No file part') return redirect(request.url) file = request.files['file'] if file.filename == '': flash('You need to upload a csv file') return redirect(request.url) if file and allowed_file(file.filename): filename = secure_filename(file.filename) file.save(os.path.join(app.config['UPLOAD_FOLDER'], filename)) return redirect(url_for('uploaded_file', filename=filename)) return ''' <!doctype html> <title>Google My Business Discovery Report Builder</title> <h1>Google My Business Discovery Report Builder</h1> <p>This web app allows you to build a report based on the discovery csv extracted from your Google My Business Account, giving you visualisations about the volume of searches and actions carried out based on each location of your branch listed on Google My Business.</p> <form action="/transform" method="post" enctype="multipart/form-data"> <p><input type="file" name="file"> <input type="submit" value=Visualise> </form> '''
The @app.route part of my code is a decorator that tells flask the URL that should trigger the upload_file function to run. This function checks if the file uploaded is in the allowed format (CSV), saves the file in the specified folder and returns the HTML with the front-end interface for my app.
The HTML is essentially an upload form which runs a function I have named transform. This function cleans up the CSV and creates visualisations based on the data in the document.
The function to clean up and create visualisations
Since the core functionality of this app is to take a CSV extracted from GMB with a certain format, clean it up and return about 8 visualisations based on the data presented, my next step involved creating the 'main function' that would carry out this transformation
def transform(): disc = open(‘clean.csv’) disc2 = open(‘clean_two.csv’,’w’) #cleaning up csv for row in disc: row = row.strip() row = row[1:-1] row = row.replace(‘“”’,’”’) disc2.write(row+’\n’) disc2.close() disc.close() discovery = pd.read_csv(‘clean_two.csv’) discovery_clean = discovery.iloc[1:] cols = list(discovery_clean.columns[4:]) discovery_clean[cols] = discovery_clean[cols].apply(pd.to_numeric,errors=’coerce’)
Originally the CSV returns what is supposed to be numerous columns in one line (not divided as columns), a common feature, however, is that each column name is encased in double quotation marks. To clean this up I converted the double quotation marks to single quotation marks - by doing this I can leverage the pd.read_csv to read each text in the quotation mark as a column name, then each new line as a row under the columns.
As part of the clean up I removed values appearing in the second row as these values could not be classified as columns or values attributable to each column, these were descriptions of the columns.
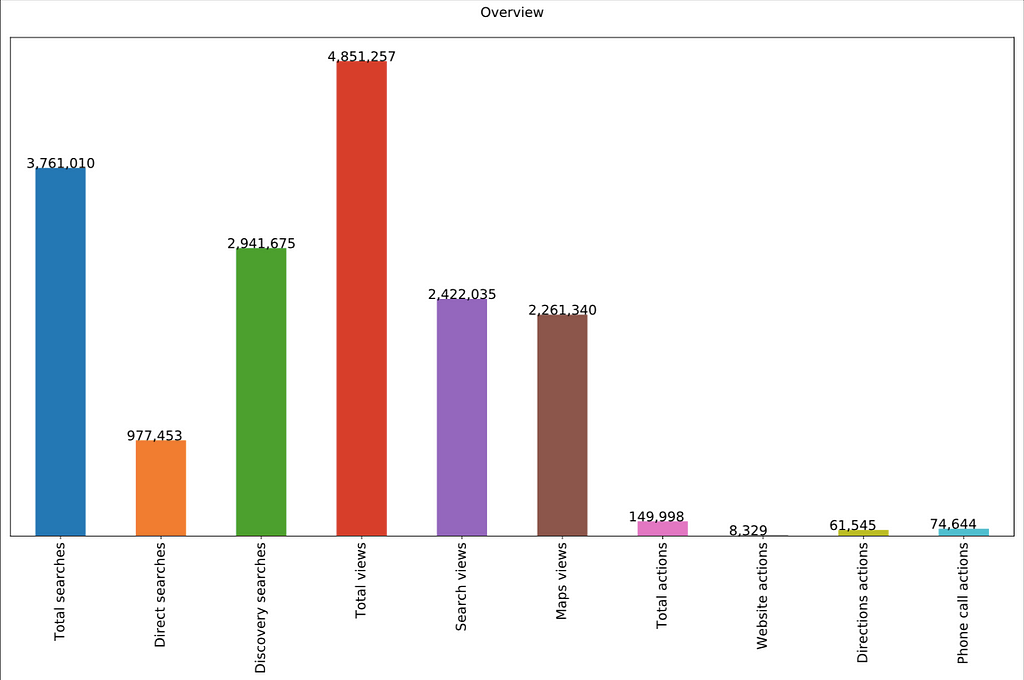
with PdfPages('plots.pdf') as pdf: #first figure plt.figure(figsize=(20,10)) ax = discovery_clean[cols].sum().plot.bar(figsize=(20,10)) ax.axes.get_yaxis().set_visible(False) ax.set_title('Overview\n',fontsize='15',color='black') ax.xaxis.set_tick_params(labelsize=15) for x in ax.patches: ax.text(x.get_x()-.09,x.get_height()+20,\ f'{int(x.get_height()):,}',fontsize=15,color='black') plt.rcParams['figure.figsize']=(20,10) pdf.savefig(bbox_inches='tight') plt.close()Continuing with the transformation function, I wanted the visualisations to be returned in pdf format, with each visualisation creating its own page. Using the PdfPages function I created the wrapper/framework to create multiple pdf pages and started off by creating a visualisation summarising key actions carried out across all locations on GMB over the course of the period represented by the document.
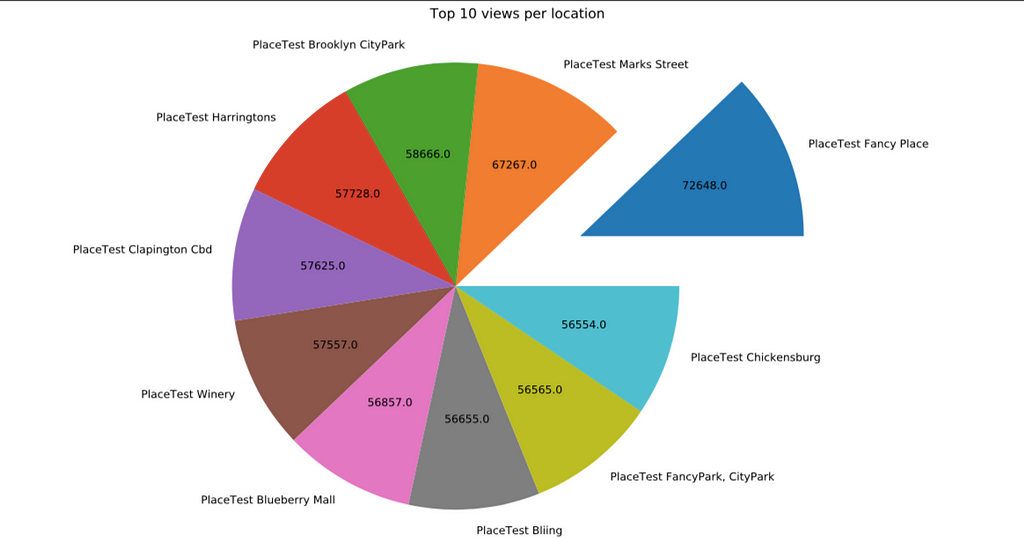
plt.figure(figsize=(16,8))mpl.rcParams['font.size'] = 12disc_plot = discovery_clean.groupby('Business name')['Total views'].sum().nlargest(10)labels = list(disc_plot.index)nums = (disc_plot.values).astype(int)def actual_nums(vals): a = np.round(vals/100.*nums.sum()) return aexplode = []for v in nums: if v == max(nums): explode.append(0.3) else: explode.append(0)plt.pie(nums,labels=labels,autopct=actual_nums,explode=explode,radius=0.50)plt.tight_layout()plt.title("Top 10 views per location\n",fontsize=15,color='black')plt.axis('equal')pdf.savefig(bbox_inches='tight')plt.close()The second visualisation returns a pie chart showing the top locations with the highest views and exploding the piece of the pie with the largest value. Since a pie chart defaults to returning the percentages, I created a function to convert the percentages to their numerical equivalent. I made sure to size this chart and subsequent charts in such a way that would save them to a pdf, with each chart being a page and without getting cut off.
Creating the report
In total 8 charts are created in my report.
@app.route('/transform',methods=["POST"])def transform_view(): request_file=request.files['file'] request_file.save('clean.csv') if not request_file: return "No file" result = transform() print(result) return send_file('plots.pdf', as_attachment=True)
One of the things I wanted was for the report to be in pdf format and to be saved as an attachment that would be automatically downloaded when I pressed the upload button on my web app. Setting as_attachment to true allows my function to save my report as an attachment that is downloaded on my local machine after the report is created.
Sample of output
Running the app on bash by referencing the file name (main.py) produces a link to the web app, upon clicking the link my browser opens the web app.
 Google My Business Discovery Report Builder web -app
Not having added any CSS to the app this then returns the relatively simple looking web app where I can upload the discovery CSV file extracted from Google My Business and create the report with the summary visualisations.
 Summary of Google My Business searches and actions
 Top 10 locations based on Google My Business Views
The output produced by the function is a report that is easy to understand and produce, eliminating the need to produce new visualisations each time the discovery CSV is extracted from Google My Business.
Fin.
Feel free to reach out with any comments, criticism or just follow my uncontroversial tweets @emmoemm.
Building a web app in Python to visualise Google My Business Discovery data was originally published in Hacker Noon on Medium, where people are continuing the conversation by highlighting and responding to this story.
Disclaimer
The views and opinions expressed in this article are solely those of the authors and do not reflect the views of Bitcoin Insider. Every investment and trading move involves risk - this is especially true for cryptocurrencies given their volatility. We strongly advise our readers to conduct their own research when making a decision.

