Latest news about Bitcoin and all cryptocurrencies. Your daily crypto news habit.

UI2code uses deep learning to analyze a UI design and convert it directly into skeleton code for front-end developers, saving them huge amounts of time when implementing designers’ work into apps. The first stage of this conversion process is layout analysis, and for an app with a simple white background, slicing image information into GUI elements can be as satisfyingly simple as slicing a cake.
To get an overview of Alibaba’s UI2code, find out here:
However, in the majority of cases, it can feel more like trying to gut a fish for the first time: the results can be a bit messy until you’ve fine-tuned your approach. This was the case for staff working on Alibaba’s Xianyu app, a platform for users to sell second-hand goods.
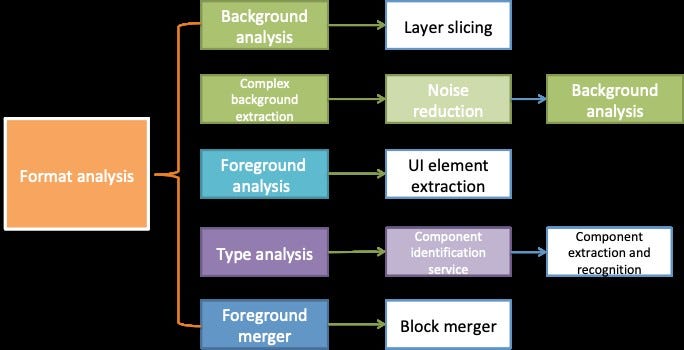
Specifically, they encountered difficulties with the background analysis and foreground analysis parts of the process, which is shown in its entirety in the following figure.
Background/foreground analysis entails the slicing of UI visuals into GUI elements using context separation algorithms:
· Background analysis: uses machine vision algorithms to analyze background color, gradient direction, and connected regions of the background.
· Foreground analysis: uses deep learning algorithms to collate, merge, and recognize GUI fragments.
This article presents the experience and results of the Xianyu team in fine-tuning the background/foreground analysis algorithms. Foreground analysis is more complex and required much more fine-tuning; for this reason, the majority of this article is devoted to this topic.
Background Analysis
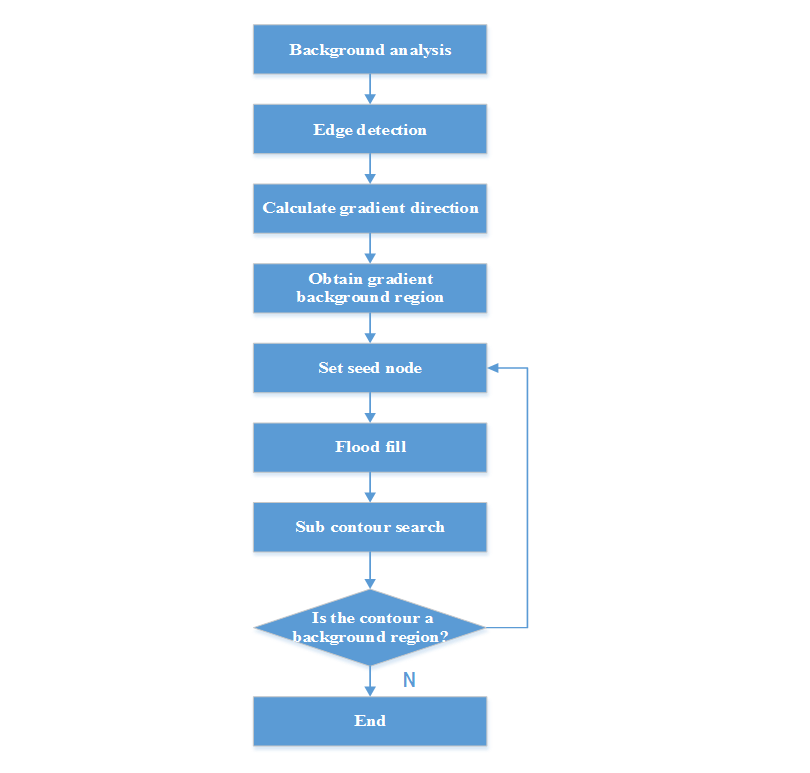
The key to background analysis is to find the connected areas and area boundaries. This section goes through the background extraction process step by step, using the actual Xianyu UI as an example.
This step seeks to obtain solid-color and gradient background regions by:
· Identifying background blocks
· Calculating the direction of the gradient change through edge detection algorithms (such as sobel, Laplacian, canny, etc.)
The background region extraction algorithm, which is based on the Laplacian operator, is as follows:
Simple and extended templates are shown below.
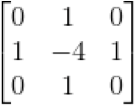
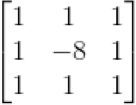 Simple (left) and extended (right) templates for the Laplacian operator
The smaller the value obtained when the region point is multiplied by the template point, the flatter and therefore closer to the background the region is. If the outcome is a gradient region, then calculate the direction of the gradient (i.e. left-to-right, right-to-left, top-to-bottom, or bottom-to-top).
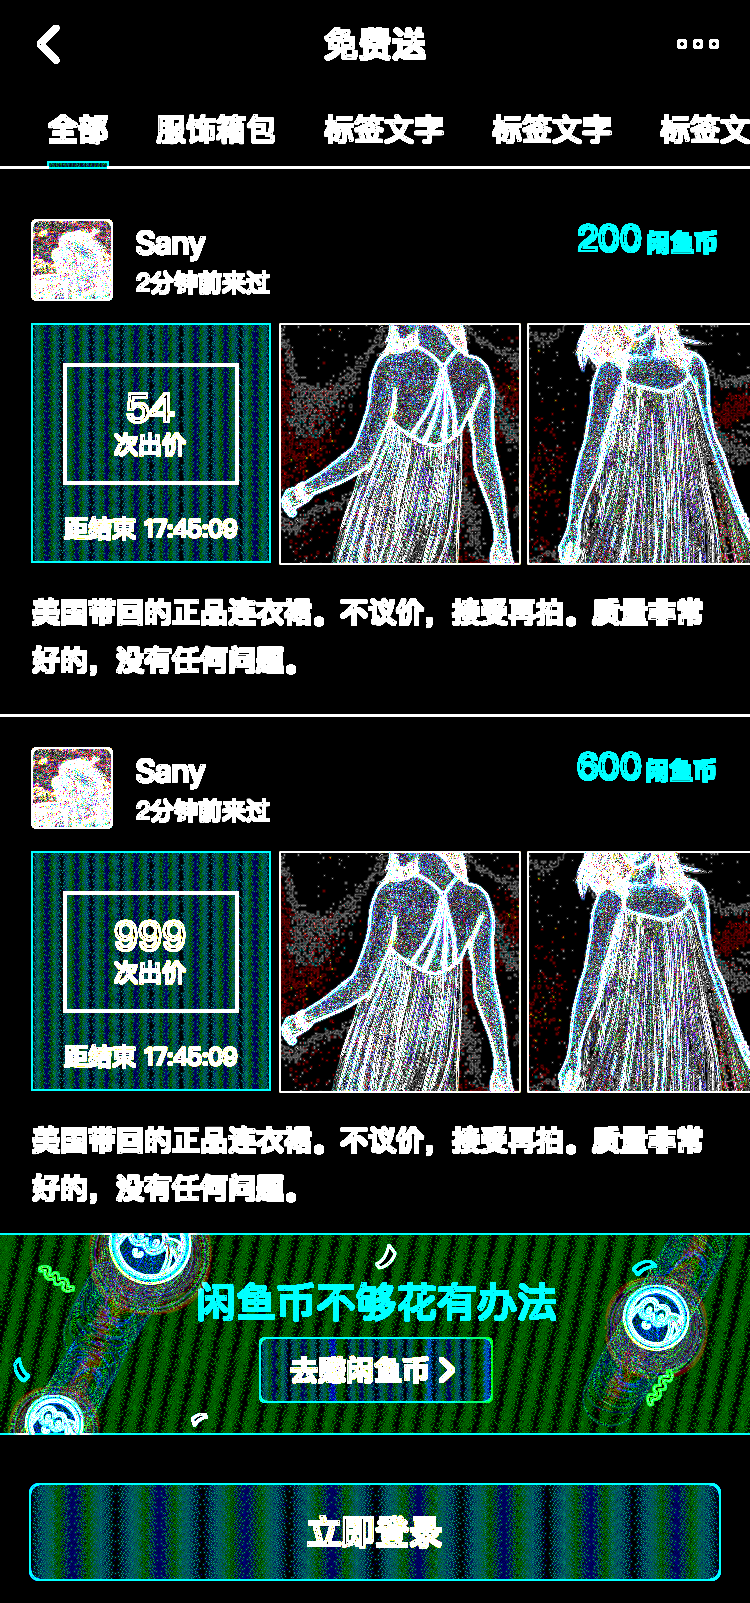
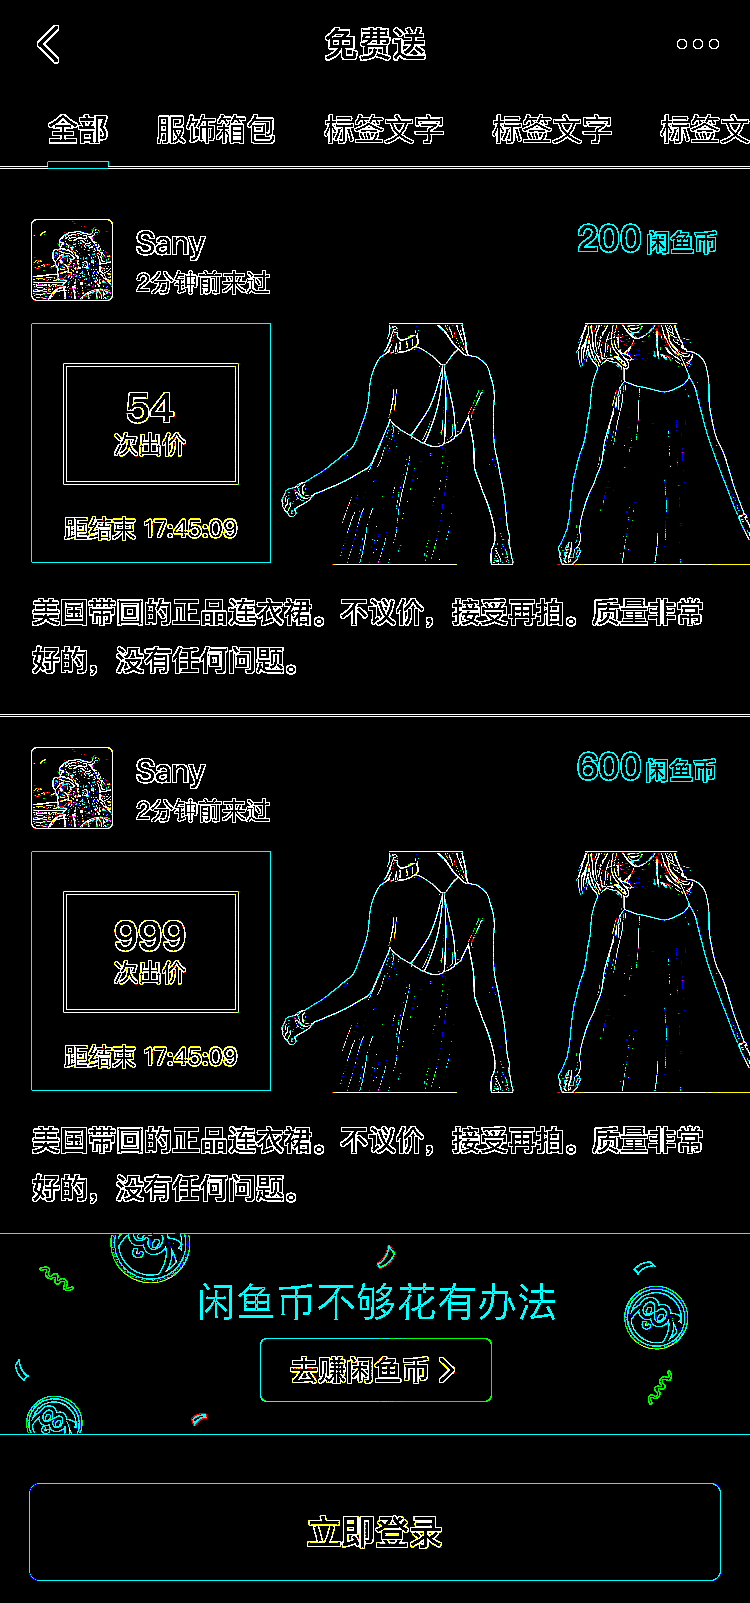
The extraction effect is as follows:
Although the background contours of the image have been well extracted, the outcome for gradients is quite poor. If when calculating the gradient direction it is determined that a gradient is indeed present, proceed to step 2 to refine the extraction result.
Step 2
Based on the flood fill algorithm, select a seed node of the flood to filter out the noise of the gradient background.
def fillcolordiffusewaterfromimg(taskoutdir, image, x, y, thresup = (10, 10, 10), thresdown = (10, 10, 10), fillcolor = (255,255,255)): “”” Flood fill: will change the image “”” # Get height and width of image h, w = image.shape[:2]
# Create a mask layer of h+2, w+2,
# Here you need to pay attention to the default rules of OpenCV,
# The shape of the mask layer must be h+2, w+2 and must be a single channel with 8 bits. I don’t know why.
mask = np.zeros([h + 2, w + 2], np.uint8)
# At this point the flood fill is run, and the parameters represent:
# copyImg: The image to be filled
# mask: The mask layer
# (x, y): The position at which to start filling (starting seed point)
# (255, 255, 255): Fill value; the filling color here is white
# (100,100,100): The maximum negative difference between the starting seed point and the pixel value of the entire image
# (50,50,50): The maximum positive difference between the starting seed point and the pixel value of the entire image
# cv.FLOODFILL_FIXED_RANGE: The method for processing images, which is generally used to process color images
cv2.floodFill(image, mask, (x, y), fill_color, thres_down, thres_up, cv2.FLOODFILL_FIXED_RANGE)
cv2.imwrite(task_out_dir + “/ui/tmp2.png”, image)
# mask is a very important region. It shows which regions are filled with colors
# For UI automation, the mask can be set as shape, and the width and height are less than 1.
return image, mask
The effect after processing is as follows:
Extract the GUI elements through UI slicing (the slicing method is as mentioned previously).
80% of the GUI elements have now been successfully extracted; however, the elements of the overlay layer are still not parsed.
Step 4
Find symmetrical contour regions using Hough Line, Hough Circle and contour searches, then repeat step 2 to 4 on the extracted contour regions until the desired result is achieved.
 Results of Hough line/circle and contour search
Extraction of complex backgrounds is the basis for subsequent foreground analysis. After extracting background regions, analyze foreground regions through connected region identification, then analyze foreground categories through component identification; finally, split and merge the foreground through semantic analysis.
Summary
For relatively simple gradient backgrounds, the above four steps are sufficient to produce satisfying outcomes. In a nutshell, the process is to search for specific contour regions based on the idea of Hough Lines and Hough Circles, analyze these contour regions in detail, then eliminate gradient backgrounds through flood fill.
For complex backgrounds, we can find specific content using target detection, then use Markov random field (MRF) to refine the edge features.
Foreground Analysis
The key to foreground analysis is the completeness of component slicing and recognition. Component fragmentation can be prevented through connected region analysis, AI-based component type recognition, and fragment merging based on component types identified. These steps should be repeat until no feature attribute fragments remain.
Still, there are some situations which are more complicated than this. One example is card extraction in the context of the waterfall card layout.
For pages in the Xianyu app, waterfall card recognition is an important step in layout analysis. The requirements are as follows:
· The card should be recognized when it is completely displayed in the screen capture image, even if partially obscured by an icon)
· The card should not be recognized when it is partially obscured by the background.
The waterfall card layout shown in the following figure is prone to being missed or misidentified due to the compact layout and diverse styles.
 Examples of waterfall card layouts: the bottom-right card in (a) is partially obscured by an icon and the color of the image in the top-right card in (b) is similar to the background color
The Xianyu team adopted a novel approach to card recognition that fuses traditional image processing methods with deep learning:
· Traditional image processing, based on edge gradient or connected region identification, extracts card contours according to the grayscale or shape features of the image itself. It has the advantages of high intersection over union (IOU) and fast computing speed. The disadvantages are its susceptibility to interference and low recall.
· The deep learning method, based on target detection or feature point detection, learns the style characteristics of the card in a supervised manner. The advantages here are resistance to interference and high recall. The disadvantage is that the computing speed is slower, the reasons being that the IOU is lower than traditional methods due to the regression process, and a large number of manual annotations are required.
The Xianyu team’s integrated approach benefits from the advantages of both, featuring high precision, high recall and high IOU. The rest of this section outlines the traditional, deep learning, and integrated approaches in more detail.
Traditional approach
Overview
The algorithm flow of the traditional image processing approach is as follows:
(1) Convert input waterfall card images to grayscale images and enhance them with contrast-limited adaptive histogram equalization (CLAHE).
(2) Use the Canny operator for edge detection to obtain a binarized image.
(3) Use morphological expansion on the binarized image and connect the open edges.
(4) Extract the outer contours of continuous edges, discard smaller contours based on the area size that the outer contour covers, and output candidate contours.
(5) Use the Douglas-Peucker algorithm for rectangular approximation, retain the outer contour that most resembles a rectangle, and output new candidate contours.
(6) Project candidate contours obtained from step 4 horizontally and vertically to get smooth contours as output.
 Card contour extraction process
Steps 1–3 of the algorithm flow cover edge detection while steps 4–6 cover contour extraction. Let us now look at each of these stages in more detail.
Edge detection (steps 1–3)
For various reasons, images are degraded during conversion to grayscale and need to be enhanced to improve the effectiveness of edge detection. Using a single histogram of the entire image for equalization is obviously not the best choice, because the contrast of different regions of the intercepted waterfall image may vary greatly, and the enhanced image may produce artifacts. The adaptive histogram equalization (AHE) algorithm improves on the single histogram approach with the introduction of block processing, but AHE sometimes amplifies the noise while enhancing the edge.
The latest approach, CLAHE, further improves upon AHE by using a contrast threshold to remove noise interference. As shown in the following diagram, CLAHE does not discard the part of the histogram that exceeds the threshold, but distributes it evenly between other bins.
 Diagram of CLAHE contrast limit
The Canny operator is a classic edge detection operator that gives accurate edge position. There are four basic steps in the Canny detection process:
(1) Use a Gaussian filter to reduce noise.
(2) Calculate the magnitude and direction of the gradient using FD approximation of first-order partial derivatives.
(3) Use non-maximum suppression on the gradient magnitude.
(4) Detect and connect edges using a dual-threshold method. Multiple attempts will be needed to select the best dual-threshold parameters.
The detected edges may be broken in some positions. This can be rectified through morphological dilation on the binarized image using structural elements of particular shapes and sizes.
The results of edge detection at each stage are shown in the following figure.
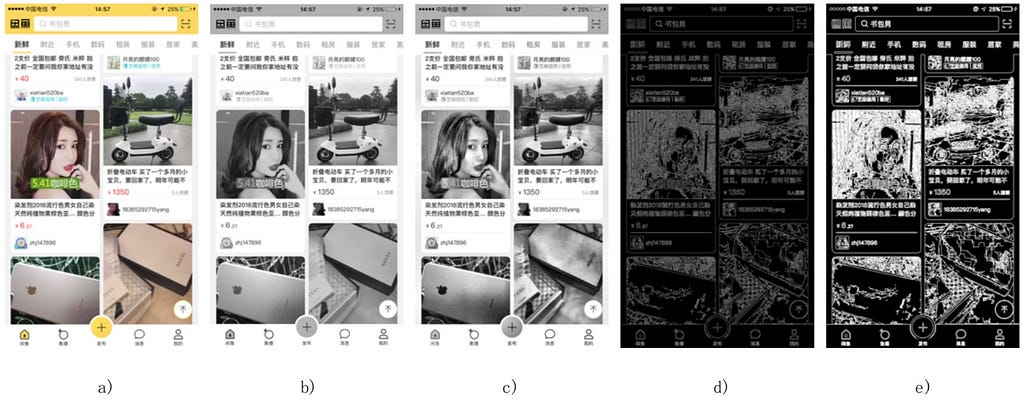 a) original image; b) grayscale conversion; c) CLAHE enhancement; d) Canny detection; e) morphological dilation
Notes:
· In c), the contrast threshold for CLAHE enhancement is 10.0 and the size of the region is (10, 10).
· In d), the dual threshold for Canny detection is (20, 80).
· In e), the structural element of the morphological dilation is a crosshair of size (3, 3).
Contour extraction (steps 4–6)
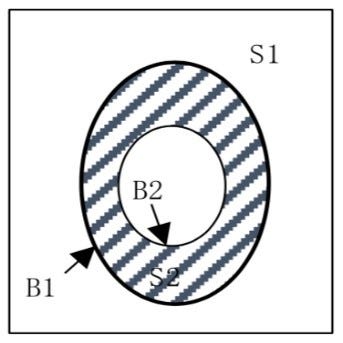
After the morphological dilation on the binary image, we first extract the outer contour of continuous edges. The following figure shows a binary image with only 0 and 1. Assume that:
· S1 is a group of background points with a pixel value of 0.
· S2 is a group of foreground points with a pixel value of 1.
· The outer contour B1 is a bunch of foreground points at the farthest edge.
· The inner contour B2 is a bunch of foreground points in the innermost area.
Perform a row scan on the binary image and assign different integer values to different contour boundaries to determine the type of the contours and the hierarchical relationship between them. After extracting the outer contour, calculate the contour area, discard outer contours of relatively small areas, and output the first-stage candidate contours.
The waterfall card contours in Xianyu are rounded-corner rectangles. In this case, the Douglas-Peucker algorithm can be used on the extracted candidate contours for rectangular approximation, and retain those outer contours which resemble a rectangular shape. The Douglas-Peucker algorithm fits the set of points represented by a curve or polygon into a set of fewer points, thereby keeping the distance between two sets of points to a set precision level. Then, the second-stage candidate contours are output.
Eliminate the burr effect by horizontally and vertically projecting the first-stage candidate contours that correspond to the positions of the second-stage candidate contours, and output the rectangular contours.
The results of contour extraction at each stage are shown in the following figure.
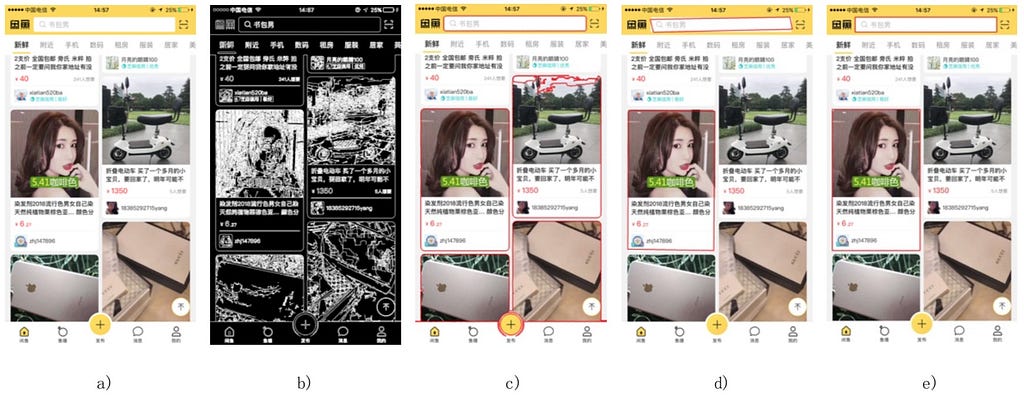 a) original image; b) morphological dilation; c) first-stage candidate contours (shown in red); d) second-stage candidate contours (shown in red); e) final output of rectangular contours (shown in red)
Notes:
· In c), the threshold value of the area covered by the contour is 10,000.
· In d), the precision of the Douglas-Peucker algorithm is 0.01*[contour length].
· All extracted contours mentioned in this article contain search boxes.
Deep learning approach
As discussed earlier, using traditional image processing methods to extract contour features raises a problem: when the image is not clear or is obstructed, the contour cannot be extracted (i.e. the recall is low).
Object detection algorithms based on the convolutional neural network (CNN) can learn more representative and distinctive features through inputting a large amount of sample data. At present, object detection algorithms are mainly divided into two factions:
· The one-stage flow represented by you only look once (YOLO) and single-shot detector (SSD) networks.
· The two-stage flow represented by the region CNN (R-CNN) family.
One-stage flow and two-stage flow
· The one-stage flow classifies and regresses predicted targets directly. It is fast, but has a low mAP compared to a two-stage flow.
· The two-stage flow generates a candidate target area before classifying and regressing predicted targets, so it is easier to converge during training. Its mAP is higher, but it is slower than the one-stage flow.
Object detection reasoning, which is used in both one-stage and two-stage flows, is shown in the following figure.
 Target detection reasoning process
The process is as follows:
· Input an image to the feature extraction network (classical CNN networks such as VGG, Inception, Resnet, and so on, are optional) to get the image features.
· Send the specific region features to the classifier and the regressor for category classification and position regression, respectively.
· Output the category and position of the box.
Faster R-CNN
The biggest contribution of Faster R-CNN to the R-CNN family is that it integrates the process of generating candidate target regions into the entire network. This results in a significant improvement in overall performance, especially in terms of detection speed.
The basic structure of the Faster R-CNN is shown in the following figure. It is composed of four parts:
(1) Conv layers
A set of basic conv+relu+pooling layers used to extract features of the image that are then shared with the subsequent RPN networks and fully-connected layers.
(2) Region Proposal Network
Generates candidate target boxes, which are judged to be in the foreground or the background through softmax. The position of candidate boxes is corrected using regression.
(3) RoI pooling
Collects the input feature map and candidate regions. Candidate regions are mapped to fixed size regions and sent to subsequent fully-connected layers.
(4) Classifier
Calculates the specific category of the candidate box. The position of the candidate box is again corrected using regression.
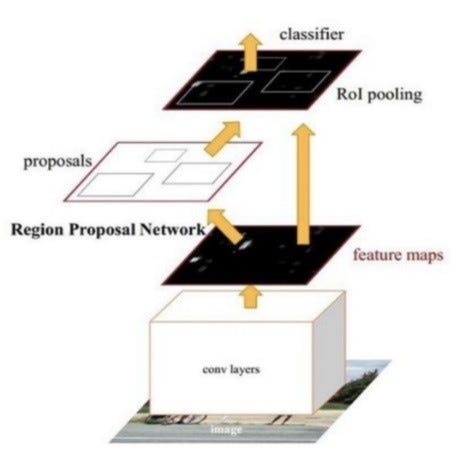 Basic structure of the Faster R-CNN
The results of using Faster R-CNN for waterfall card recognition are shown in the following figure.
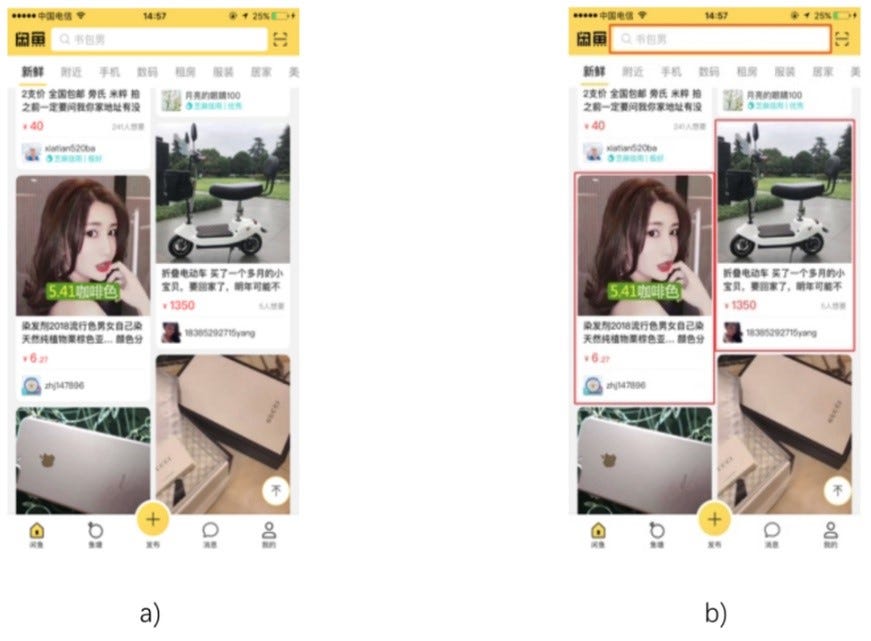 a) original image; b) recognized cards (shown in red)Integrated approach
Traditional image processing can obtain card positions with high IOU, but the recall is not high due to the ways the cards are displayed. Meanwhile, deep learning methods have high generalization capabilities and achieve high recall, but the card position cannot be obtained at a high IOU in the regression process.
As we have seen, in practice this means that for the above image:
· Traditional image processing cannot detect the top-right card.
· Deep learning detects both the top-right and top-left cards, but their boundaries almost overlap.
Fusing the results obtained by the two methods achieves better results with high precision, high recall and high IOU.
The integrated process is as follows:
1. Input an image, run the traditional image processing method and deep learning method in parallel, and obtain the extracted card boxes trbox (traditional) and dlbox (deep learning) respectively.
IOU is benchmarked by trbox, while precision and recall are benchmarked by dlbox.
2. Filter trbox.
The rule is to keep trbox when the IOU of trbox and dlbox is greater than a certain threshold (for example, 0.8); otherwise discard it and get trbox1.
3. Filter dlbox.
The rule is to discard dlbox when the IOU of dlbox and trbox1 is greater than a certain threshold (for example, 0.8); otherwise keep it and get dlbox1.
4. Correct the position of dlbox1.
The rule is that each edge of dlbox1 moves to a straight line closest to it, with the constraint that the distance of movement cannot exceed a given threshold (for example, 20 pixels), and the moving edge cannot cross the edge of trbox1. A modified dlbox2 is thereby obtained.
5. Output trbox1+dlbox2 as the final merged card box.
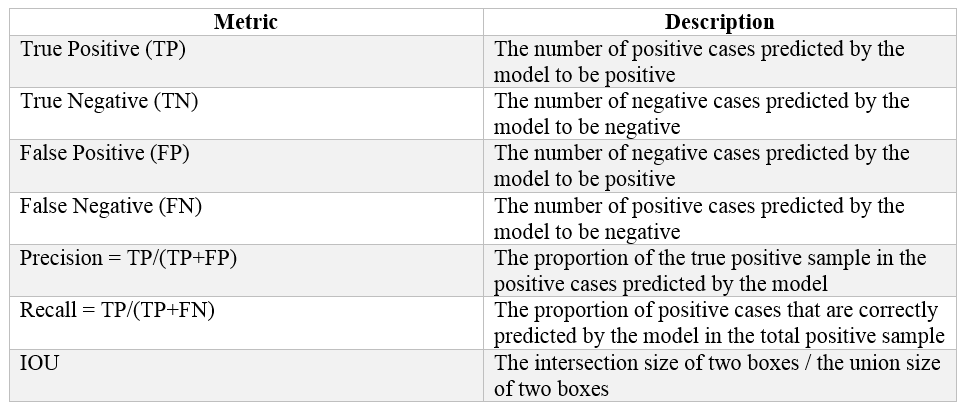
The following table describes the performance metrics used to measure the performance of the integrated approach.
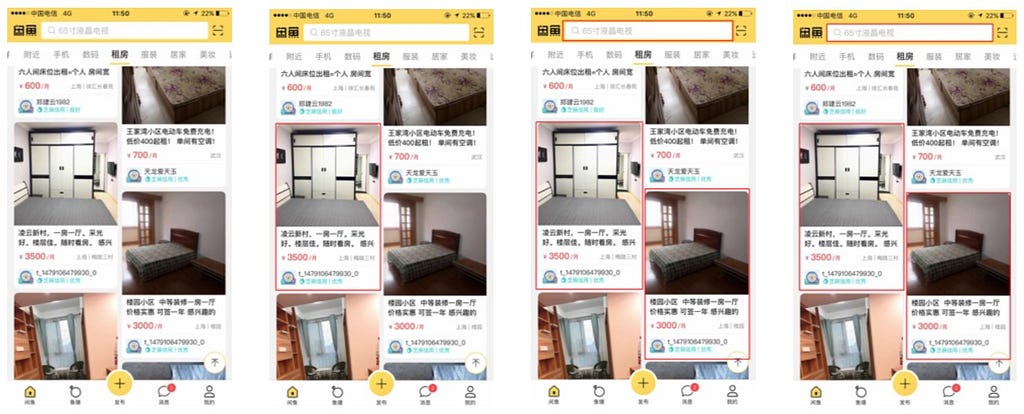
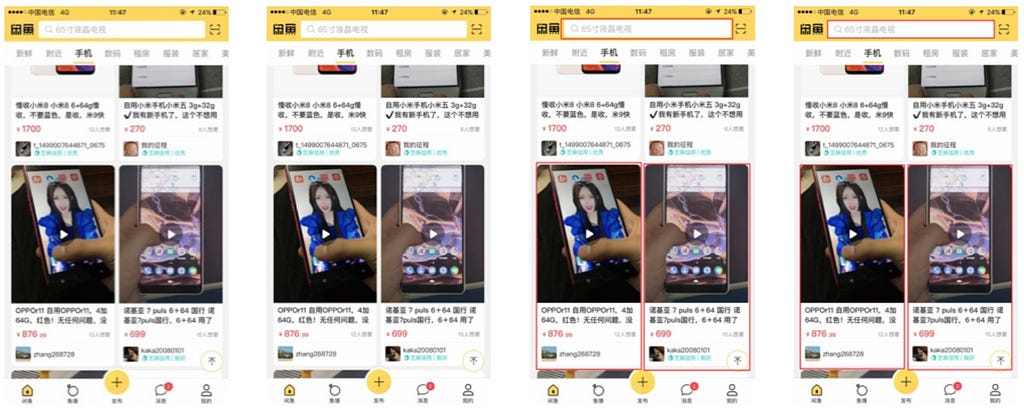
The below image compares the card recognition results of each method.
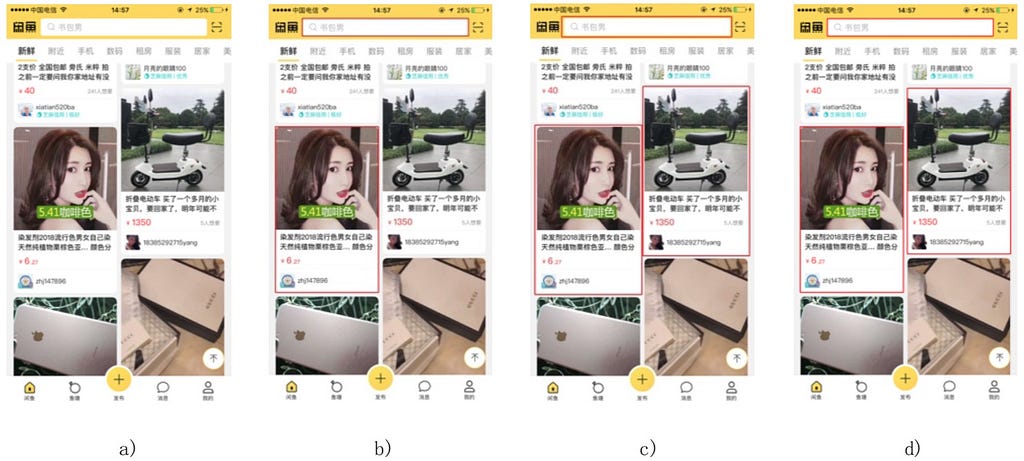 a) original image; b) traditional image processing; c) deep learning; d) integrated approach (combines b) and c))
Clearly, image d) has a better recall than b) and a better IOU than c).
Further examples are shown in the three image sets below. For each row of images:
· The first column shows the original image.
· The second column shows the results of traditional image processing.
· The third column shows the results of deep learning.
· The fourth column shows the results of the integrated approach.
Card contours are accurately recognized in the first two rows. In the third row, the bottom edge of the card is not perfectly fit. This is because when the dlbox1 position is corrected in the fusion step, the traditional image processing method is used to find the nearest straight line in the range, which is affected by the image style. The straight line found is not the expected bottom edge of the card.
Testing
The traditional, deep learning, and integrated approaches were tested on 50 Xianyu waterfall card images, captured at random, which contained a total of 96 cards between them (search boxes excluded). 65 cards were recognized by the traditional approach, 97 cards by the deep learning approach, and 98 cards by the integrated approach.
The precision, recall, and IOU are shown in the following table. The results confirm that the integrated approach combines the advantages of the traditional and deep learning approaches.
 Summary of test resultsNext steps
The integrated method proposed by the Xianyu team achieves high precision, high recall and high IOU in recognition tasks; however, it is not without its drawbacks. For example, the correction of component elements during the fusion process is interfered with by the image style. Future work should seek to optimize this part of the process.
(Original article by Chen Yongxin陈永新, Zhang Tonghui张仝辉 and Chen Jie陈浩)
To get an overview of Alibaba’s UI2code, find out here:
Alibaba Tech
First hand and in-depth information about Alibaba’s latest technology → Facebook: “Alibaba Tech”. Twitter: “AlibabaTech”.
UI2code: How to Fine-tune Background and Foreground Analysis was originally published in Hacker Noon on Medium, where people are continuing the conversation by highlighting and responding to this story.
Disclaimer
The views and opinions expressed in this article are solely those of the authors and do not reflect the views of Bitcoin Insider. Every investment and trading move involves risk - this is especially true for cryptocurrencies given their volatility. We strongly advise our readers to conduct their own research when making a decision.
