Latest news about Bitcoin and all cryptocurrencies. Your daily crypto news habit.
The stock market is one of the most dynamic and volatile sources of data.The data is generated every second as the money never sleeps. The change in the values of stocks is a result of the change in the market and sentiments of the people.
In this project, we’ve tried to predict the stocks of National Stock Exchange (NSE) India in Top gainers and Losers over a period of time. Which will be used in clustering the stocks.
This is a python based project and uses Machine learning to predict the value of the stock for the next day.
Since the data we’ve considered is from NSE, we’re using nsepy and nsetools library to obtain the data. nsepy provides the day-to-day data for the provided symbol.
Taking 4 companies for prediction
- Brigade Group
- Godrej Properties Limited
- ITC Limited
- Reliance Industries Limited
Preprocessing
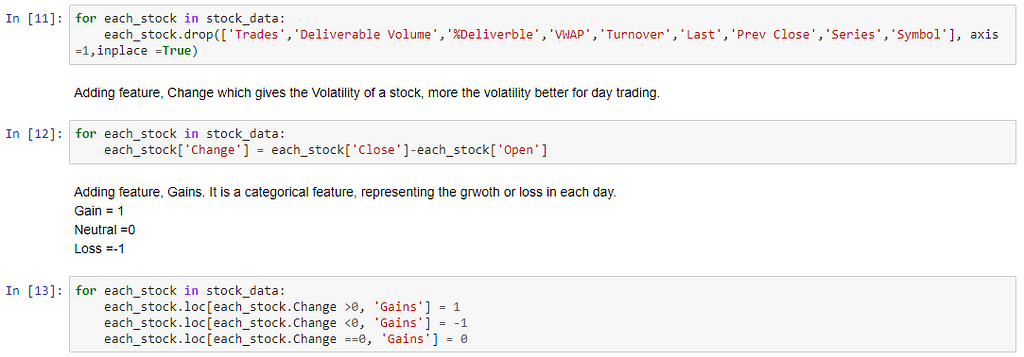
The model uses mainly 4 features for prediction — OPEN, HIGH, LOW, CLOSE. Therefore, we’re dropping the extra features present in the DataFrames.
2 features are added to the DataFrames, which provides insight.
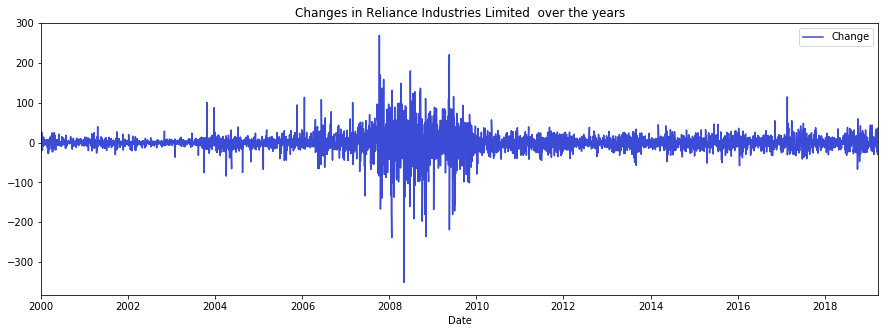
- Change- which represents the change or volatility in the stock, every day.
- Gain- Categorical feature representing gain or loss in day-to-day value.
Once the extra features are dropped, we have the df.head() and df.describe() of the listed stocks, providing the first 5 values and statistical description of DataFrames, respectively.
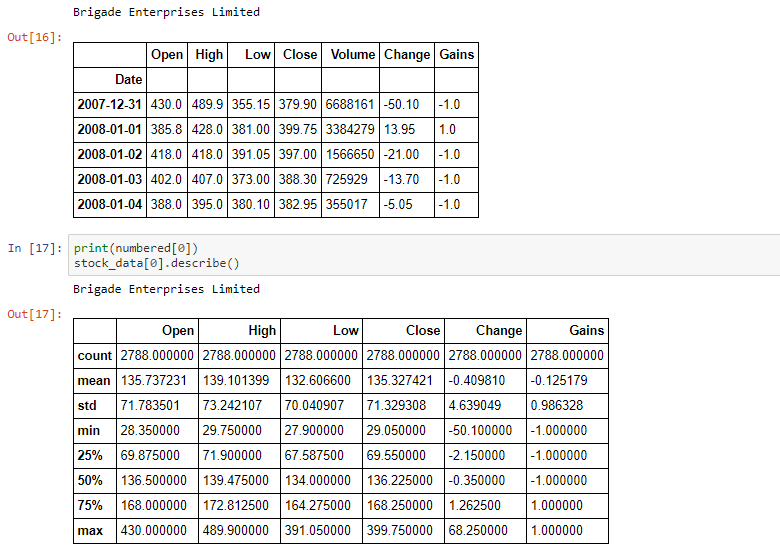 Brigade Enterprises Limited
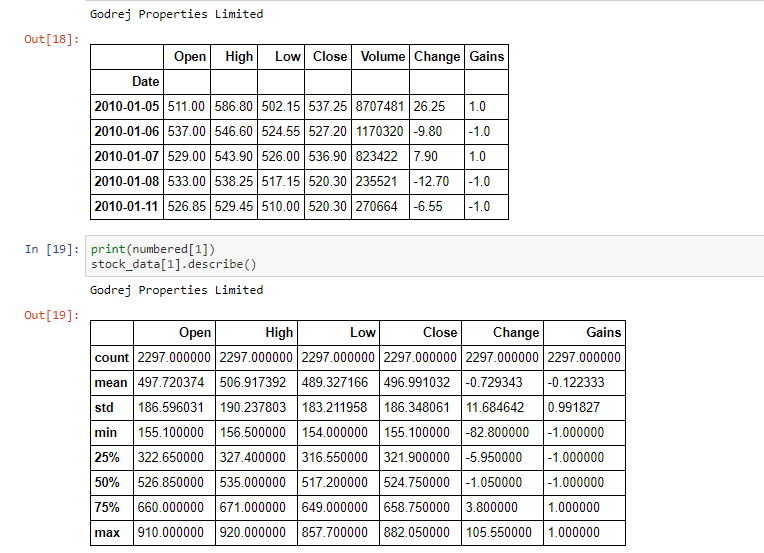 Godrej Properties Limited
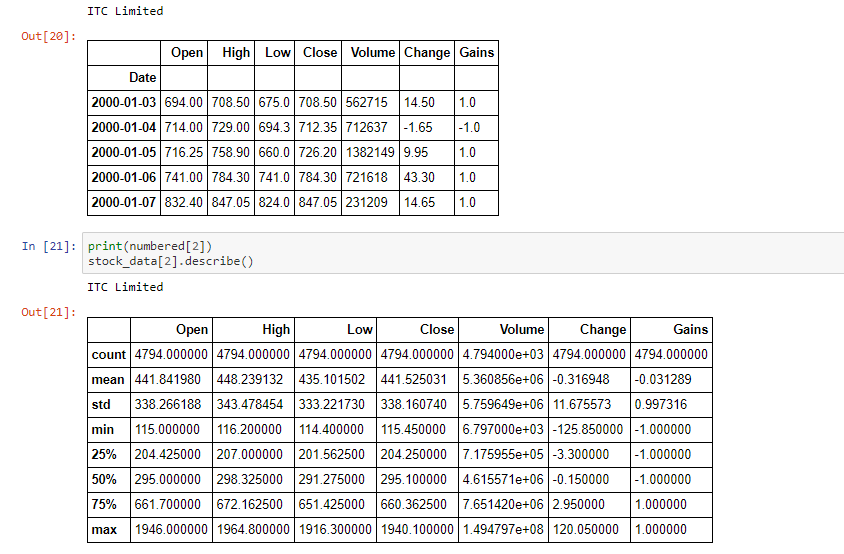 ITC Limited
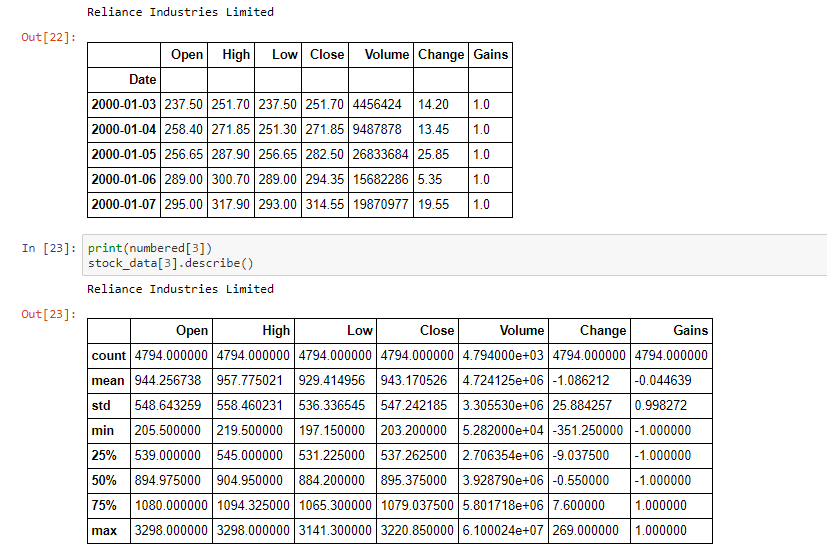 Reliance Industries LimitedVisualization
Visualizing the features over the years, which gives us information about the company’s past trends and volatility.
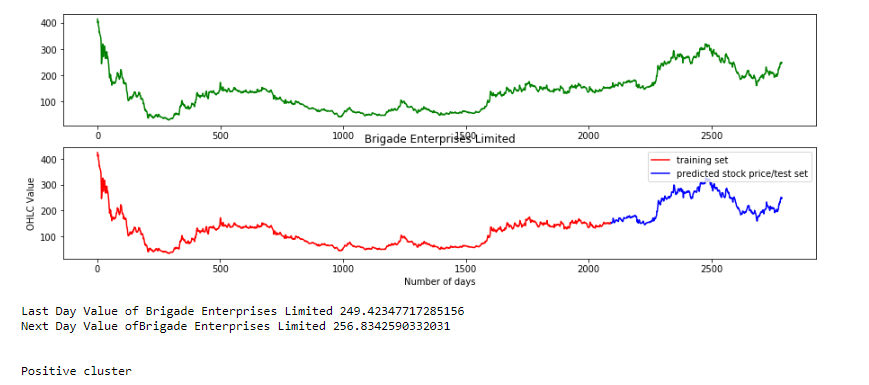
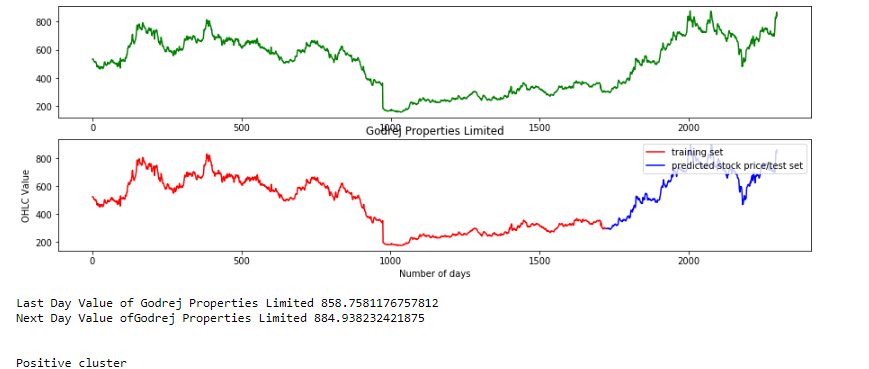
Also, included OHLC, HLC and Closing value graph over the years, which is used to illustrate movements in the price of a financial instrument over time
Brigade Group
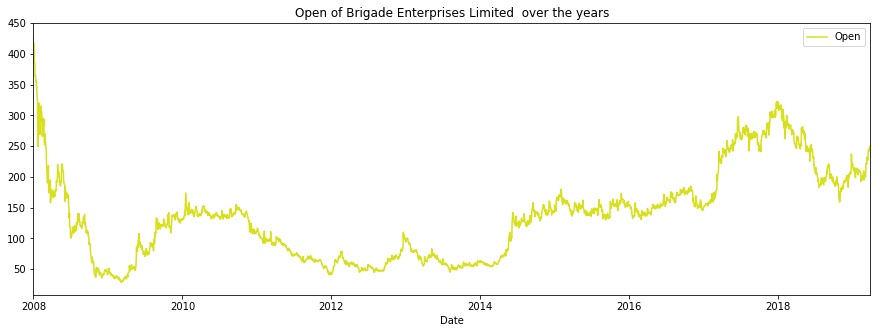
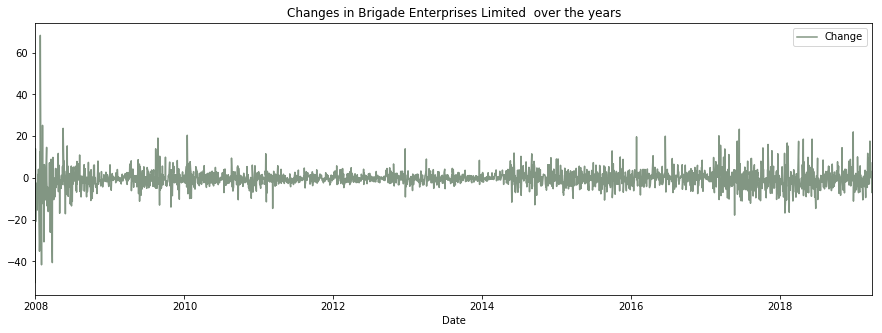
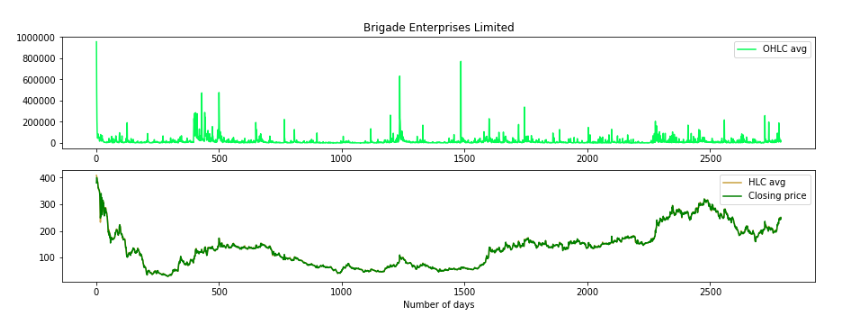 OHLC and HLC Values over the years
Godrej Properties Limited
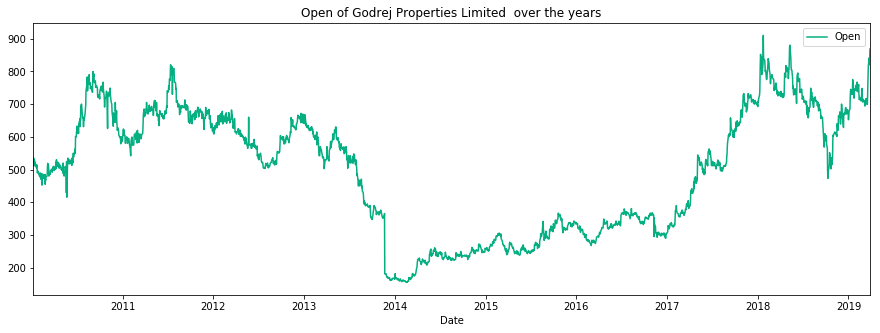
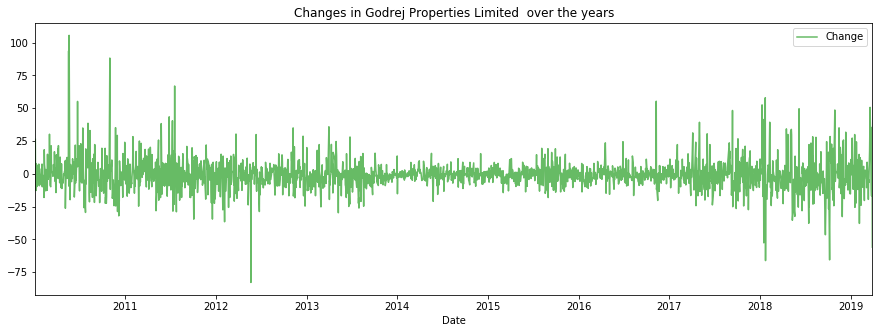
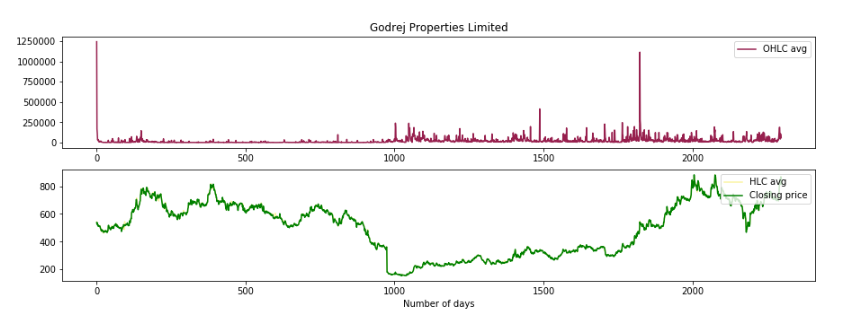 OHLC and HLC Values over the years
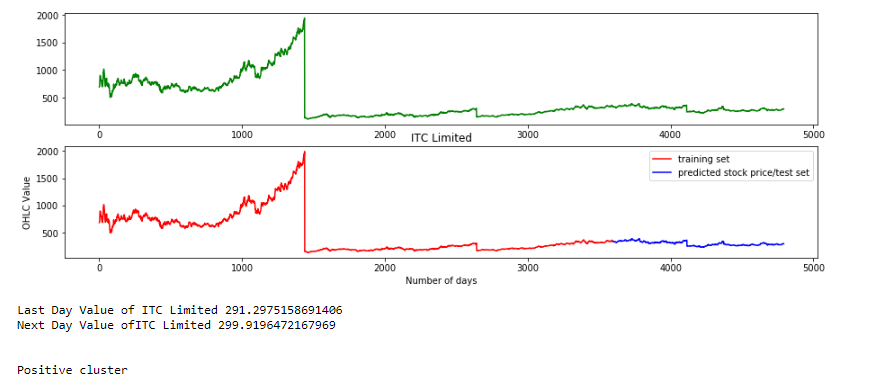
ITC Limited
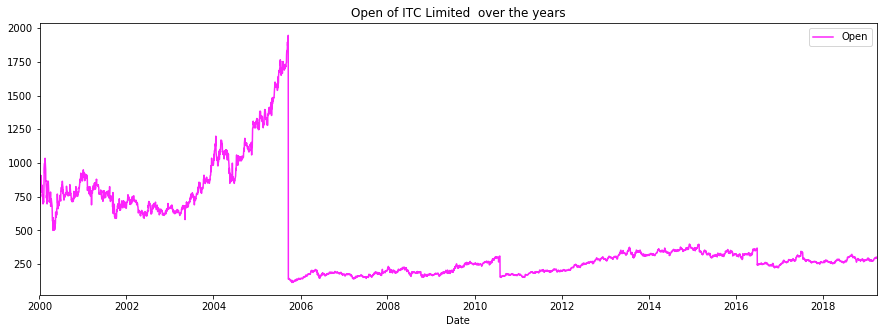
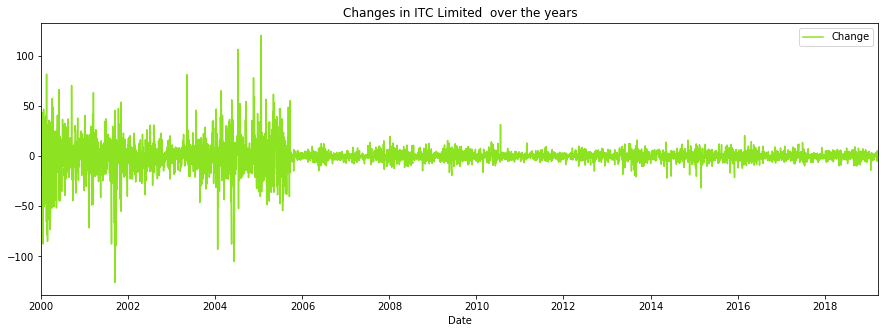
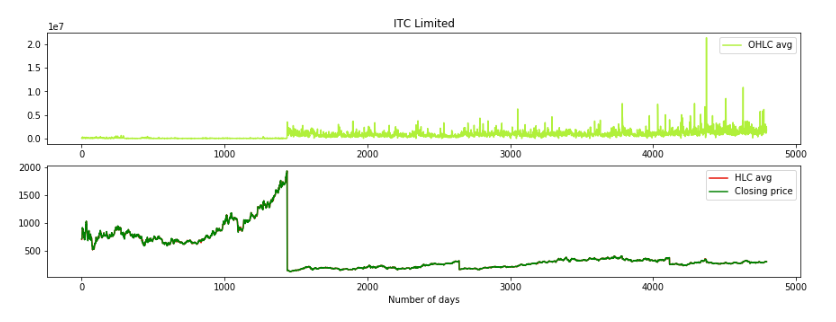 OHLC and HLC Values over the years
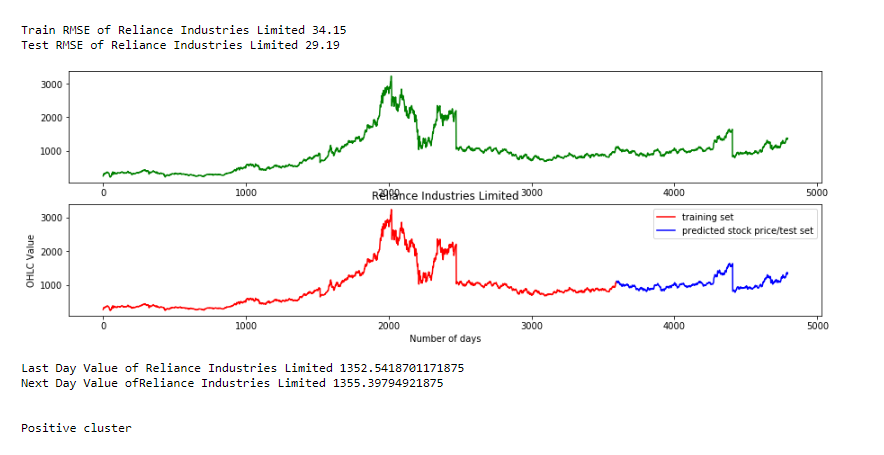
Reliance Industries Limited
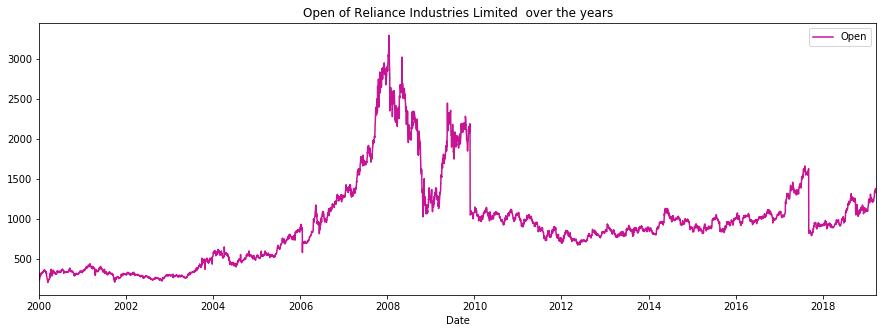
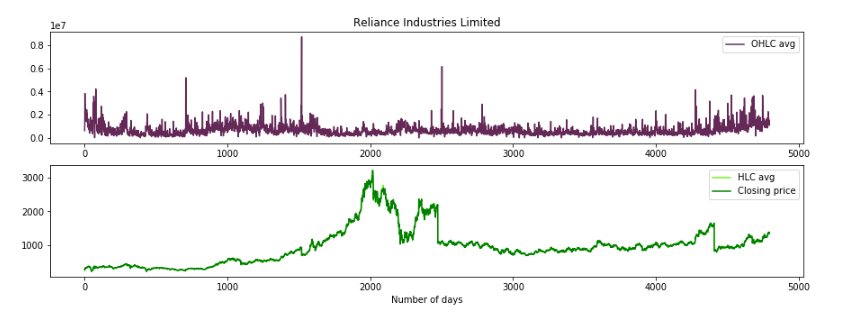 OHLC and HLC Values over the yearsPrediction
The prediction is done using lstm (Long Short Term Memory networks ) because they are pretty good at extracting features in time series data.
The Train-Test split is done in 75–25 % ratio.
For a total 5 cycle for each stock.
After the training for each stock individually, the model predicts on the test dataset and computes the RMSE (Root Mean Square Error).
We get the following results for the same.
Brigade Group
RMSE on test dataset 5.13
Godrej Properties Limited
RMSE on test dataset 14.72
ITC Limited
RMSE on test dataset 6.38
Reliance Industries Limited
RMSE on test dataset 29.19
This post includes one of the modules of the complete project, which is to predict using neural networks. Another aspect of the project includes the sentiment part of the project about the company stock.
When combined the result of both module we can cluster the stocks in gain or lose.
For the complete code, please visit my github repository:
sahilverma0696/Stock-market-prediction-clustering
Stock Market Prediction & Clustering was originally published in Hacker Noon on Medium, where people are continuing the conversation by highlighting and responding to this story.
Disclaimer
The views and opinions expressed in this article are solely those of the authors and do not reflect the views of Bitcoin Insider. Every investment and trading move involves risk - this is especially true for cryptocurrencies given their volatility. We strongly advise our readers to conduct their own research when making a decision.
