Latest news about Bitcoin and all cryptocurrencies. Your daily crypto news habit.

First, a short disclaimer: I don’t want you to invest in anything. And this article doesn’t contain any investment advice. Actually, I will give YOU an opportunity to force me to invest my own money 🤔🤔🤔
A while ago, I have written an article about how I tried to crack the stock market in my teens. The idea was simple —my teenage self wanted to use social sentiment and search trends to predict stock performance. Back then, I had no idea what I was doing, and it ultimately failed.
However, I never really gave up on that idea. So last month when I launched Crunchdex, I told myself I will try it again using all the tricks I have learned over the past 9 years.
If you don’t want to read the whole article, here are the main takeaways: — I trained a model for listed SaaS Companies (with preference for self-service software tools / mainly small-cap and mid-cap) — My model correctly predicted the direction the stock price is going to take in 91.75% cases — The predicted portfolio gain was 13.51% — The actual portfolio gain was 24.26% (+10.75% more than I predicted) — If this article gets 1,000 👏, I will invest $10.000 of my own money based on my model. And you can follow it in real time.
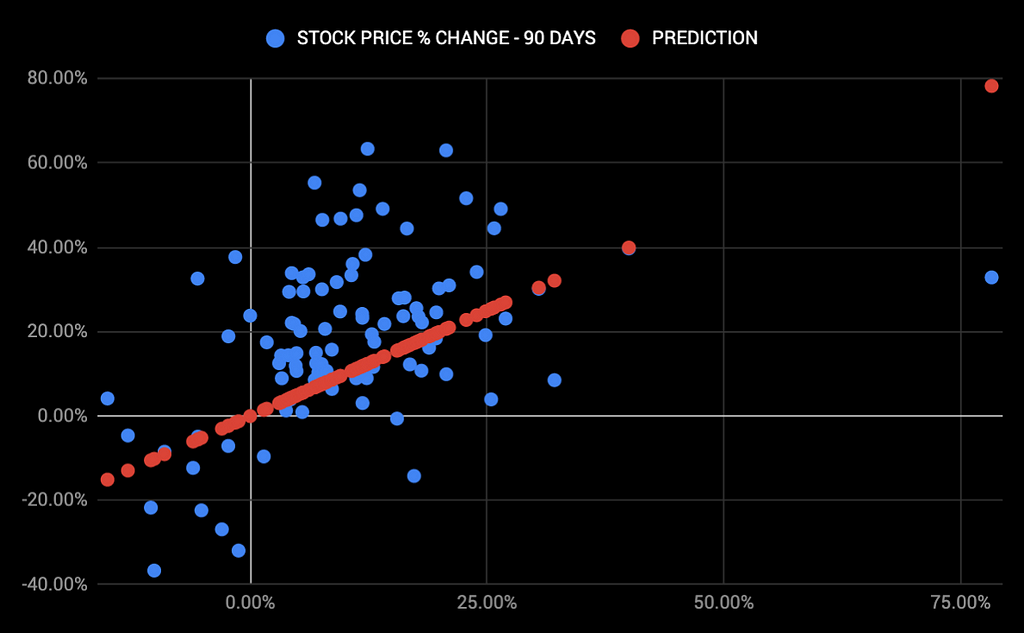
 Scatter Chart — Prediction vs Stock Price Change (90 Days)A Bit of Context
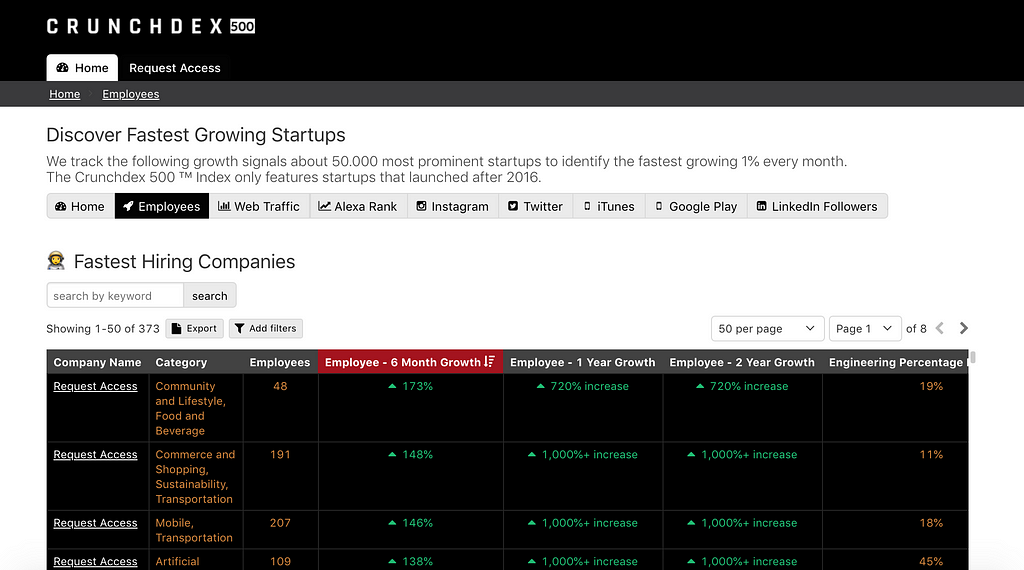
I started Crunchdex with one ‘simple’ mission — to identify the 1% fastest growing companies through enormous amount of data and growth signals. Think of it as ‘Bloomberg for Startups’.
We track millions of websites every day. We look at alternative data like Employee Growth, Web Traffic, Social Engagement, Job Listings, App Reviews and many other. Then, we identify the fastest growing companies. And either feature them in one of our Indexes or in our clients’ custom databases.
The exciting part is that this alternative data can be also used for listed companies. In fact, many sophisticated quantitative hedge funds already use this type of data, and 50% of institutional investors plan to increase their usage of alternative data in the coming year.
Building a Predictive Model (aka the boring part, feel free to skip)
I pulled data of ~4,000 listed companies, and enriched them with literally every growth signal we currently cover. Then, I tried to see if there has been historically any correlation between the various growth signals and stock performance.
I quickly noticed two things:(a) Alternative Data shows a much higher correlation for small-cap and mid-cap companies. (b) Our current growth signals work best for SaaS companies & for Direct to Consumer Goods / B2C Online Services and Marketplaces.
I have decided to start by building a predictive model for SaaS. I am not going to disclose exactly which growth signals it includes. Simply because I am considering how to productise it. However, below is a sneak peek of the process and results.
First, I identified all self-service SaaS companies. — Why? Users interact directly with the tool, which surfaces quite a few growth signals. — How? The easiest way is to scrape all websites and see if there is a ‘sign in’, ‘register’ or a ‘pricing page’ + exclude websites which have an ‘investor’ tab in the menu, etc.
Then, I identified all growth metrics which have historically shown the highest correlation and created a model which weights their importance accordingly. — Why? Obviously, not all growth signals can be treated equal. In addition, some growth signals can’t produce the same level of growth over a specific period of time. For example, a company is more likely to double their website traffic every month than to double their headcount.
And finally, I used the model to predict the Stock Price change in 90 Days. And I made a reminder for myself to check it later. Full disclosure, I thought it was a total waste of time and that it was never going to work.
How Accurate Is It?
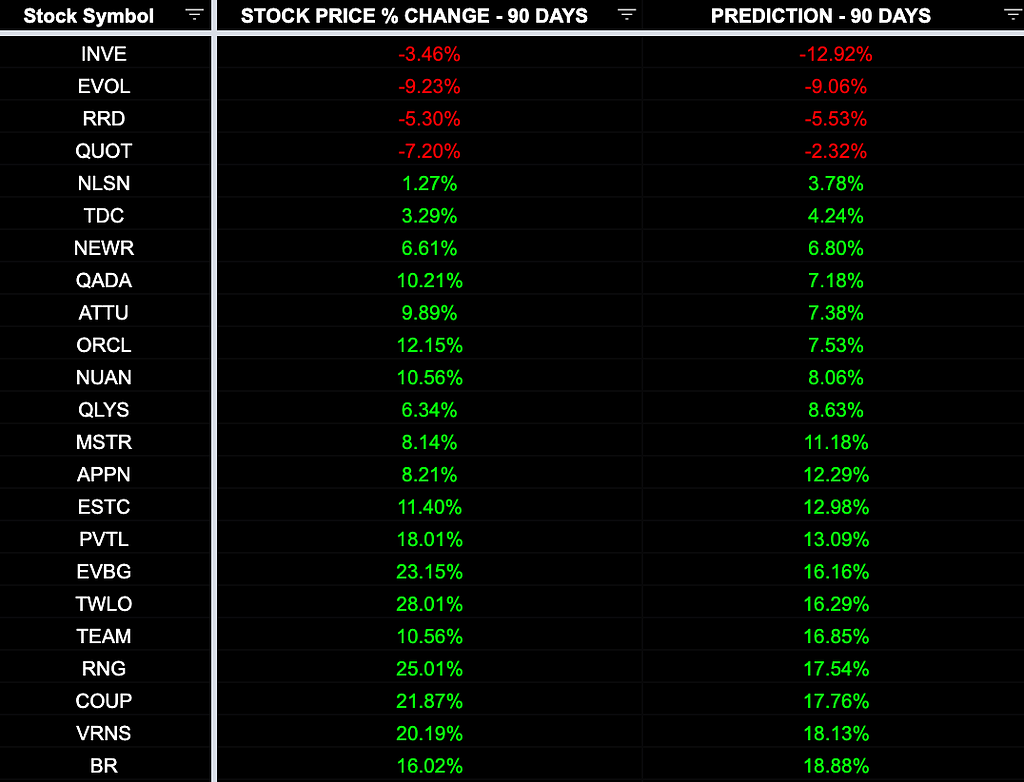
Below is a small sneak peek of my predicted stock price change and the actual change over the same time period. As you can see it is far from perfect. Especially, if you also have a look at the scatter chart above you can quickly notice that while the model predicts fairly accurately the decrease and increase in stock price, it’s not very precise when it comes to the actual price change.
So while the model was indeed correct in 91.75% of the cases about which direction the stock is going to take, it’s still going to take an enormous amount of data and effort to get it right. And maybe, it will never predict the actual stock price accurately. In fact, no one can do that. However, being right about the direction 9 out of 10 times, is certainly promising. And I will continue improving the model.
Had I invested in the stocks for which the model predicted an increase in stock price, I would have made a 24.26% return in 90 days. My prediction of 13.51% gain turned out to be rather pessimistic.
What’s Next
While I am really excited about the results of this experiment, I can imagine many of you will remain sceptical.
So let me put my money where my mouth is. If this article gets over 1,000 claps, I will share publicly my predictions for the next 90 days, and invest $10.000 of my own money solely based on these predictions.
Want to see that? Give it a 👏 or two 😁
If you want to talk to me — tweet to me or email meIf you want to see what I am up to — sign up for my newsletter 🚀🚀🚀
Crunchdex Predicts Stock Performance with 92% Accuracy was originally published in Hacker Noon on Medium, where people are continuing the conversation by highlighting and responding to this story.
Disclaimer
The views and opinions expressed in this article are solely those of the authors and do not reflect the views of Bitcoin Insider. Every investment and trading move involves risk - this is especially true for cryptocurrencies given their volatility. We strongly advise our readers to conduct their own research when making a decision.

