Latest news about Bitcoin and all cryptocurrencies. Your daily crypto news habit.
Stock indices are an age-old construct in traditional equity markets. They are designed to track the performance of the stock market as closely as possible. Ideally, any change in the overall market represents an exactly proportional change in the index.
Indices, naturally, have been ported over to cryptocurrency. And here in the land of blockchain, they serve two purposes.
Cryptocurrency Indices
The ideal cryptocurrency index consists of every single coin in the market, weighted by market cap. Unfortunately, creating such a portfolio is infeasible because of minimum trading amounts and trading fees. The only option left is to take a sample.
In principle, the larger the sample, the more accurate it will be in tracking the overall market. But as the sample grows larger, the more difficult and costly it is to maintain.
Most indices take the top N coins by market capitalization because the top coins capture a higher % of the total market cap.
But if we simply weighted the top 20 coins by market cap, we would end up with a portfolio that is extremely top-heavy. The index wouldn’t do a great job at capturing the risk & performance of the lower-capped coins.
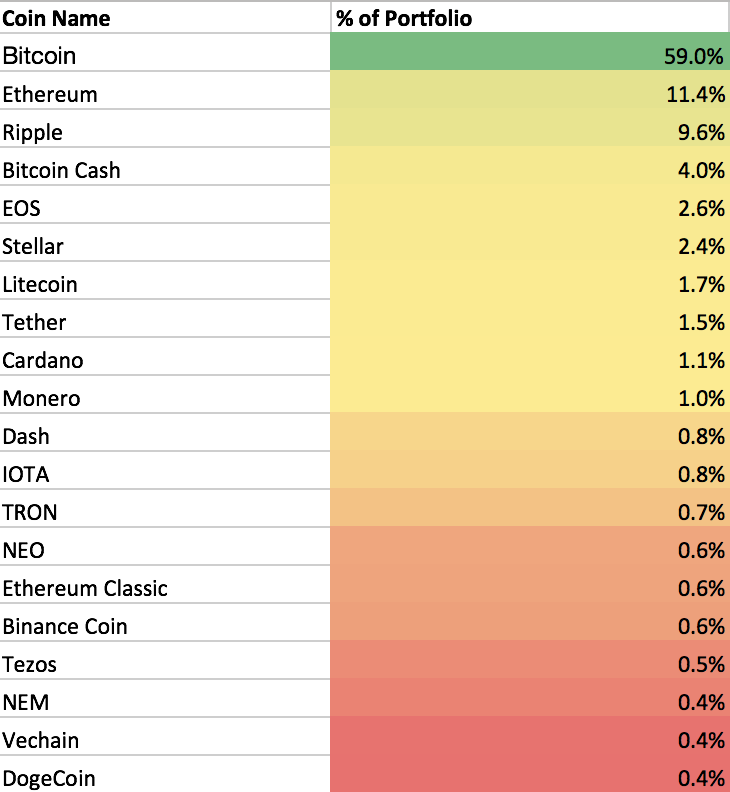 Bitcoin makes up almost 60% of the entire portfolio, while ranks 15–20 make up only 3.4% of the portfolio.
In order to capture the exposure of lower-capped coins, indices use an array of different construction methods. Each claim to be the best in their own right.
In this article, we’re going to be putting these ambitious claims to the test by:
Calculating the Pearson correlation coefficient between each index and the movement of the entire cryptocurrency market.
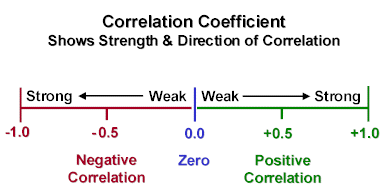
A correlation coefficient of +1 implies that the pair will always move in the same direction. Conversely, a correlation coefficient of -1 implies that the pair will always move in the opposite direction. If the correlation coefficient is 0, this suggests there is no observable linear relationship between the two.
Analyzing the statistical error between each index and the total cryptocurrency market.
Even indices correlations close to +1 can end up having disparate returns compared to the market because errors are compounded and grow larger over time.
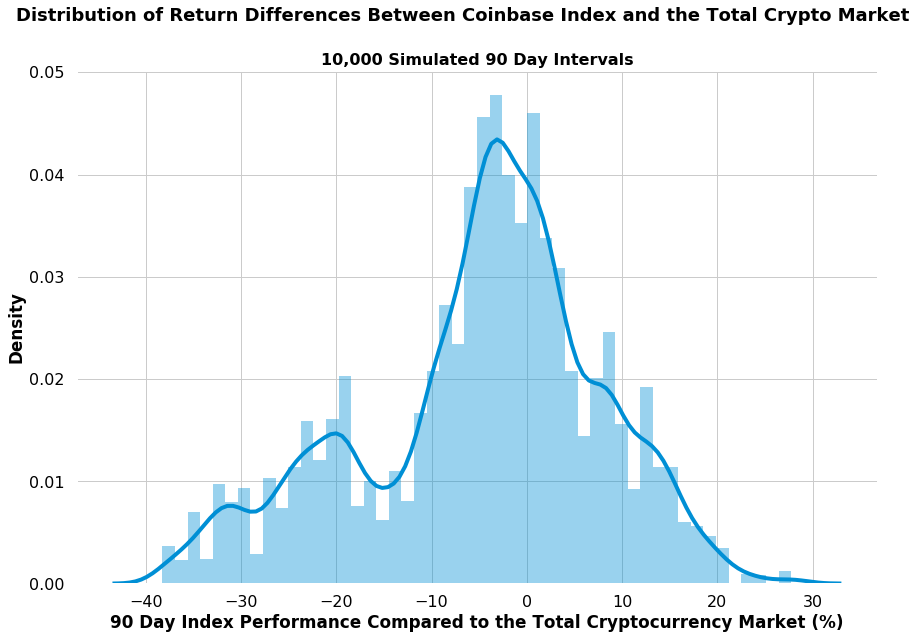
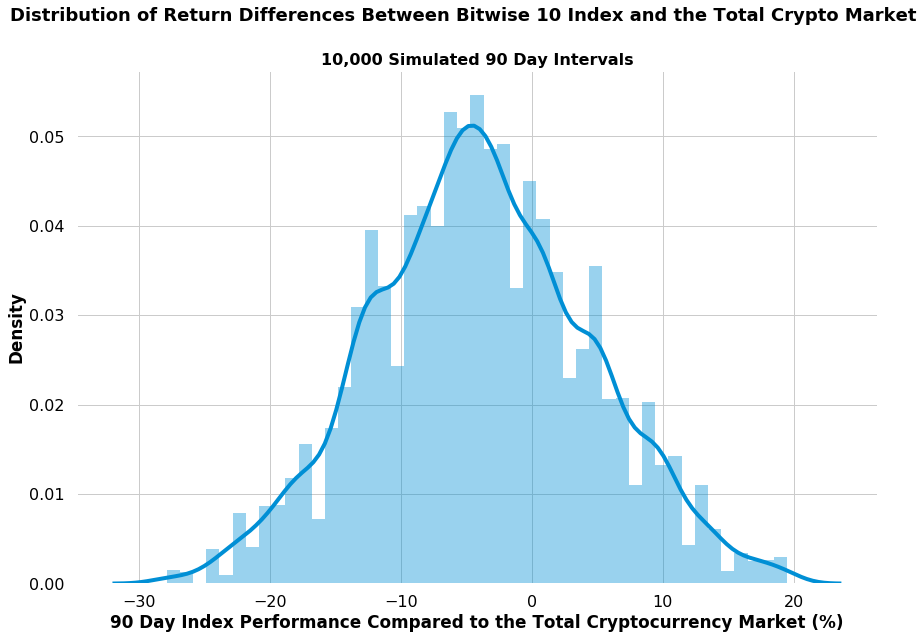
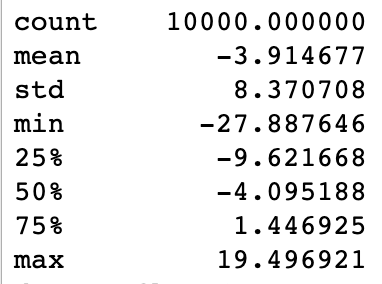
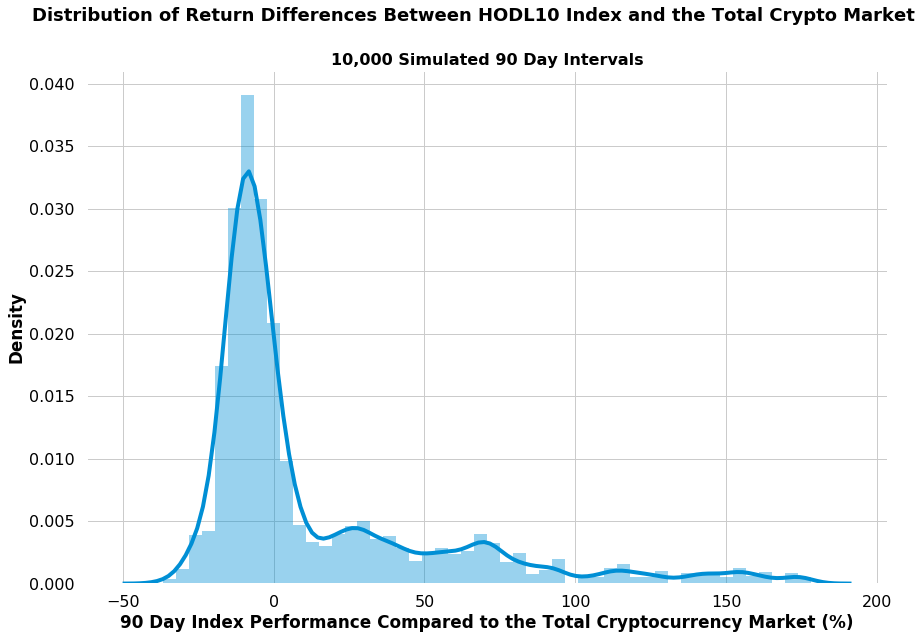
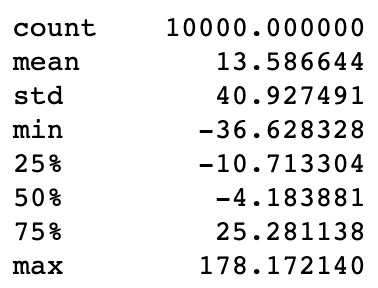
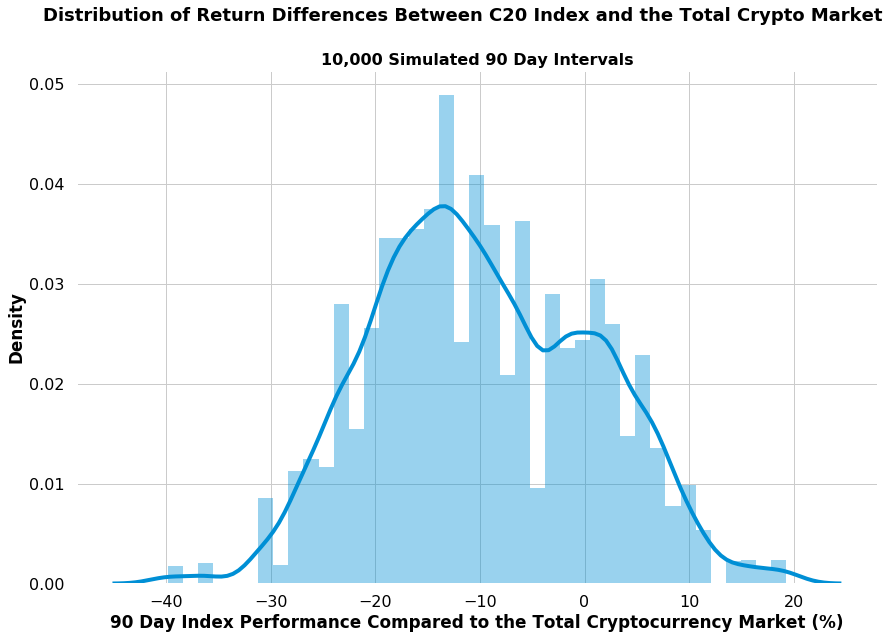
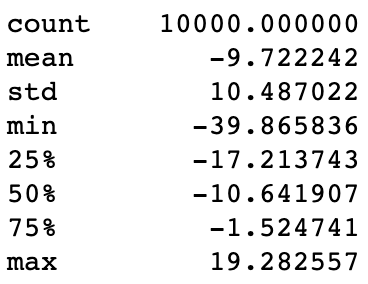
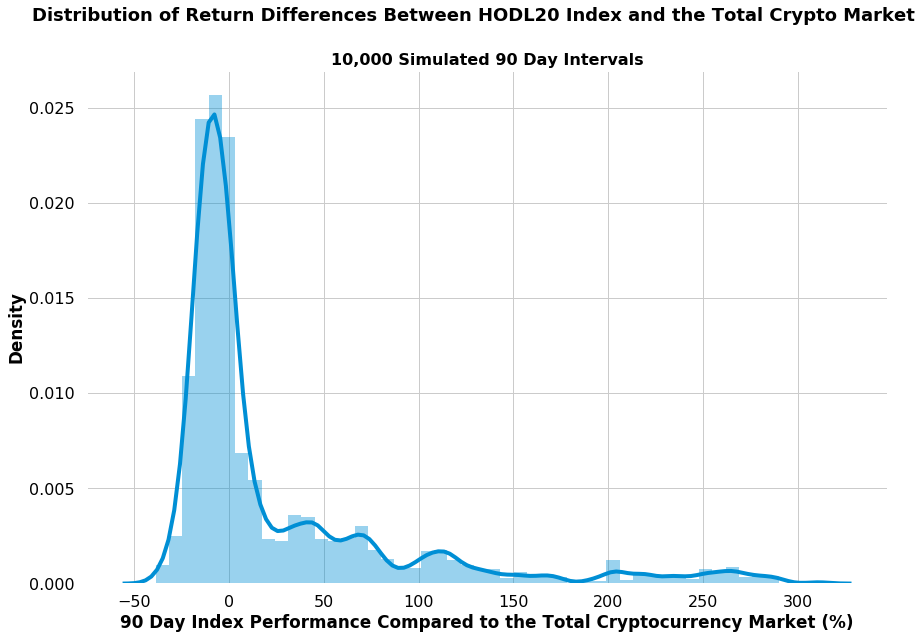
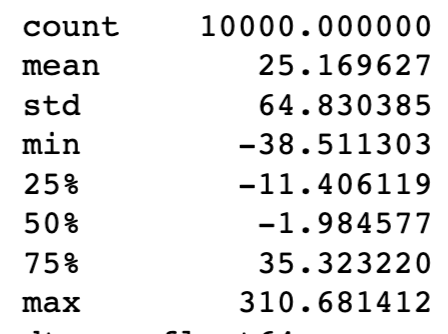
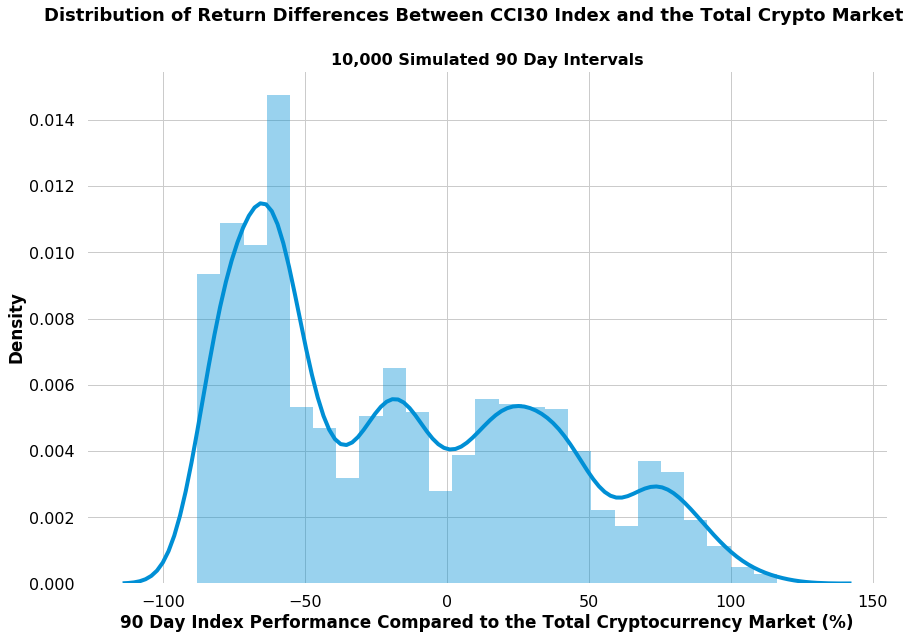
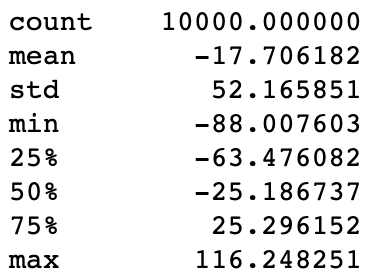
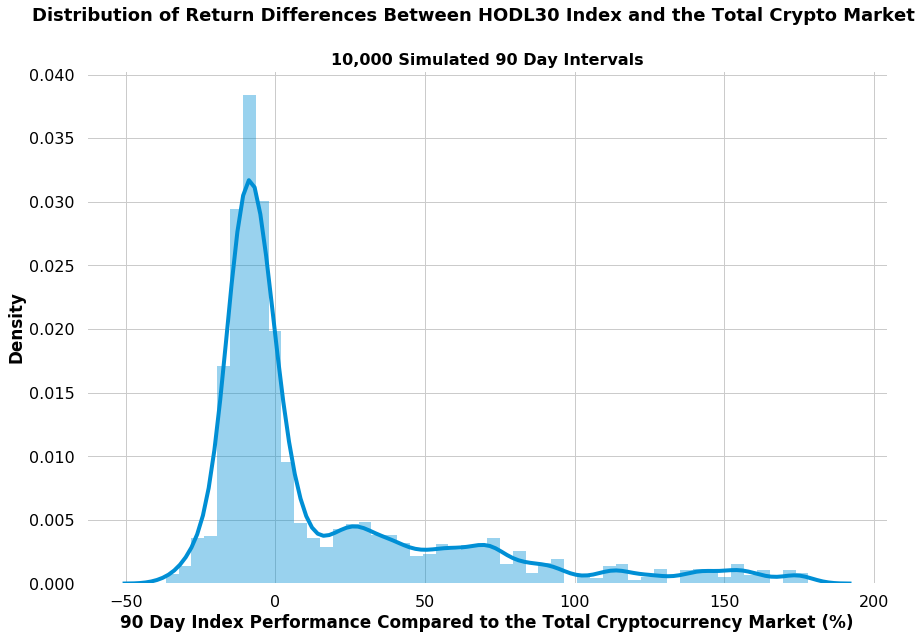
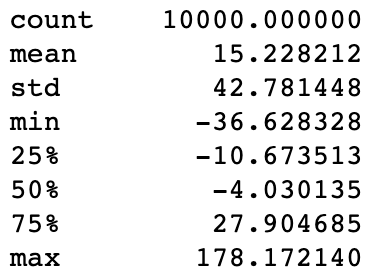
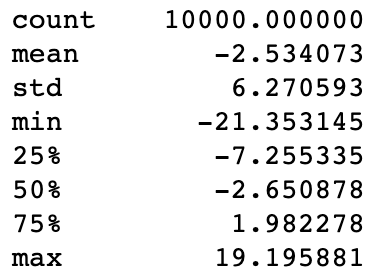
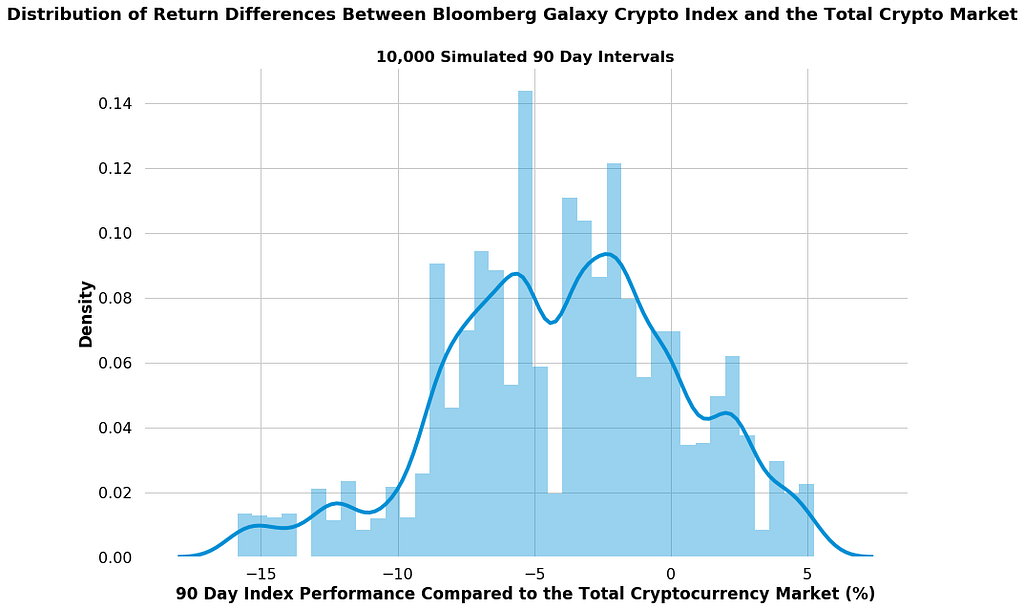
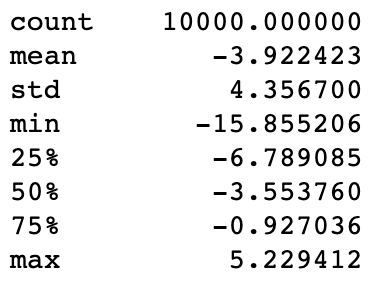
That’s why we’re also going to need a different metric, one that evaluates how well the index performs in relation to the total market. We’re going to derive this metric computationally by taking 1,000 random snippets of time series data that span 90 days each. For each time window, we’re going to compute how many percentage points the index underperforms, or outperforms, the overall market by.
Indices We’re Going to Review & Analyze
Through a critical lens, we will explore how different well-known cryptocurrency indices are constructed, and evaluate how well they track the market. These indices include:
- The Coinbase Index
- Bitwise10
- HODL10
- Crypto20
- HODL20
- CCI30
- HODL30
- CRIX
- The Bloomberg Galaxy Crypto Index
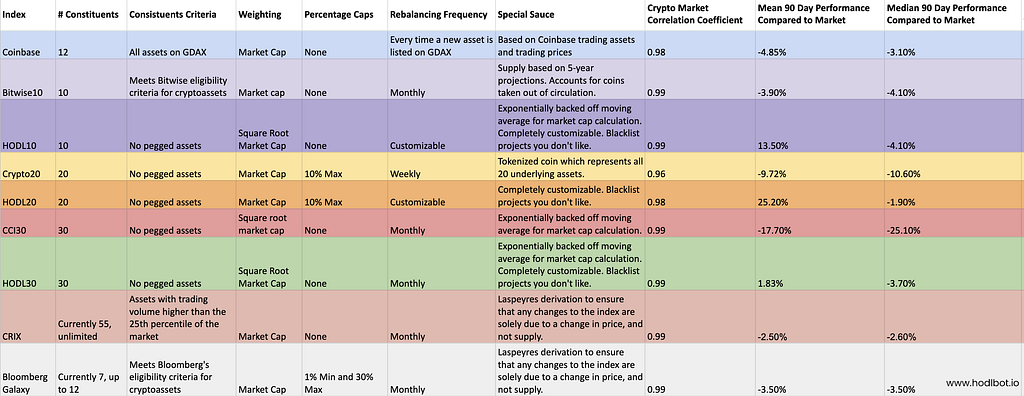
TLDR: a summary of findings are presented here for readers who do not want to go in-depth.
Review of Cryptocurrency Indices
The Coinbase index fund is only available to accredited investors who live in the US. In an effort to make matters simple for investors, Coinbase takes custody of the underlying assets.
Indexing Methodology
The Coinbase index fund includes every coin on its native exchange, GDAX, and weighs them by market capitalization. Keep in mind that these 12 coins are by no means the top 12 by market cap, but simply what it is listed on GDAX.
Rebalancing Frequency
Coinbase does not follow a standard rebalancing period. Instead, the Coinbase index is rebalanced every single time a new asset is listed or de-listed from the exchange.
Special Considerations:
- Coinbase calculates market capitalization based on a fixed supply figure it sets on 5 PM PST Jan, 1, on the calendar year the asset was added to GDAX. Supply adjustments are made every year by multiplying the previous year’s supply with the percentage by which the supply increased after one year.
- The price for each constituent asset is the last trade price on the GDAX USD order book.
Pearson’s Correlation Coefficient: 0.98
There are 2 major reasons that cause the index to differ from total market movement.
- The index uses GDAX prices. There are bound to be inaccuracies when comparing GDAX prices to Coinmarketcap prices.
- The index only consists of 12 coins and not even the top 12 coins by market cap. The index is missing many large-capped coins that are not listed on GDAX. In addition, the index also does not do a good job of capturing the performance of lower-capped coins, especially during “Altcoin” season.
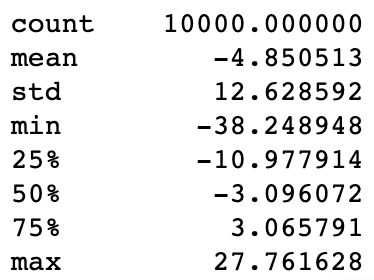
Historical Performance Compared to the Total Cryptocurrency Market
2. Bitwise10
Bitwise has a series of index funds that it offers to accredited US investors. The Bitwise10 is the company’s flagship index fund. It aims to capture the performance of large-cap cryptocurrencies.
Indexing methodology
The Bitwise10 weighs the top 10 coins by market cap. However, Bitwise removes coins that fail to meet their eligibility criteria. Stablecoins are omitted from the indices. Projects like Binance Coin, Cardano, and TRON are also removed. You can read more about the eligibility criteria here.
Rebalancing Frequency
The Bitwise10 is rebalanced once every month.
Special Considerations
Bitwise indices adjust for free float. For a given cryptocurrency, Bitwise makes a prediction of the number of coins that will never enter the tradeable market and leaves it out of the supply.
Bitwise also adjusts for supply inflation, by calculating market cap based on a projected 5-year coin supply.
Bitwise’s other indices, Bitwise 20, Bitwise 70, Bitwise 100, are constructed in a similar manner. Coins in the index abide by the same eligibility requirements and their supplies are also adjusted for free float and inflation.
Pearson’s Correlation Coefficient:0.99
3.HODL10 Index
The HODL10 is an index offered by HodlBot. Rather than investing in a fund, HodlBot trades the assets in your Binance account to match the composition of the index.
Indexing methodology
The HODL10 weighs the top 10 coins by square root market cap.
Rebalancing Frequency
The default rebalancing period is 28 days. But you can customize it to whatever.
Special Considerations
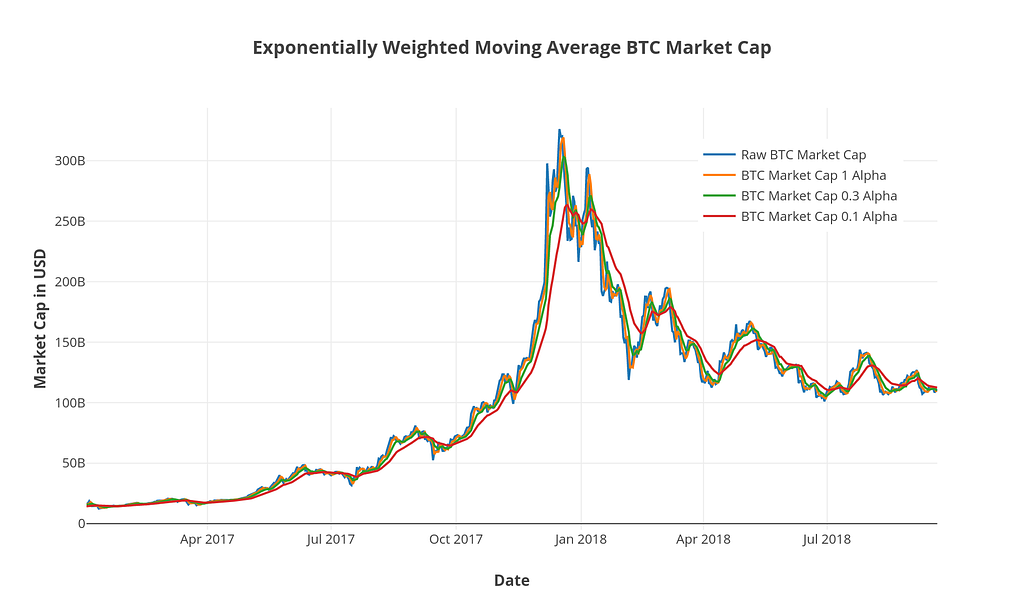
The market cap is not computed as an instantaneous number. Instead, the HODL10 uses an exponentially weighted moving average of market capitalization in an attempt to escape some of the day-to-day volatility in the market. This way, the constituents do not change as often.
Pearson’s Correlation Coefficient:0.99
4. Crypto20
Crypto20 (C20) is a tokenized cryptocurrency index fund. Each token represents a small basket of the underlying coins and is theoretically redeemable for their value.
Indexing methodology
C20 weighs the top 20 coins by market capitalization but caps each individual holding to 10%. Anything above 10% gets redistributed to all the coins below by weighted market capitalization until the entire sum of the portfolio adds up to 100%.
Rebalancing Frequency
Rebalances are made every week.
Special Considerations
In order to calculate market cap, C20 uses the current coin supply and multiplies it by their own volume-weighted trading price. The price is volume-weighted based on which exchanges C20 purchases their underlying assets. Typically, C20 will purchase their coins from exchanges like Kraken, Huobi, Poloniex, Bitfinex, and Binance.
Pearson’s Correlation Coefficient:0.96
The C20 token has a lower correlation coefficient than most other indices.
This is because the price of the C20 token does not always reflect the net asset value (NAV) of its underlying assets. On its most exuberant day, C20 traded 45.6% above the fund’s NAV. A few months later, C20 traded at a -4.3% discount to NAV.
When NAV goes below the C20 token, C20 give token holders a way to liquidate their token at NAV price and get ETH in return. C20 relies on market arbitrage to keep the C20 token from never going below NAV. But this does not always happen due to market illiquidity.
5. HODL20
Indexing methodology
HODL20’s indexing methodology is very similar to C20. HODL20 weighs the top 20 coins by market capitalization but caps each individual holding to 10%. Anything above 10% gets redistributed to all the coins below by weighted market capitalization until the entire sum of the portfolio adds up to 100%.
Rebalancing Frequency
Unlike C20 which rebalances weekly, the HODL20 by default rebalances every month. But you can also customize rebalancing period to be whatever you’d like.
Special Considerations
Also unlike C20, the HODL20 is not a token. Anyone with a Binance account can instantly trade into the HODL20 for free.
The benefit of holding the underlying assets directly is that the price never changes from NAV. Also, all underlying assets traded separately in very liquid markets. At any time, an investor can choose to liquidate their holdings at the going market price.
The model also enables customization. You can set your own rebalancing period and blacklist any coins you do not want in the index.
Pearson’s Correlation Coefficient:0.98
Despite having an almost identical indexing strategy compared to C20, the HODL20 has a slightly higher correlation coefficient because all underlying assets in the index are tradeable at exactly the market price.
6. CCI30
The CCI30 is an index designed by Igor Riven, professor of mathematics at Temple University. The only way to invest in the CCI30 is the cryptos fund. If you are not an accredited investor or reside in the US, you can not invest in the fund
Indexing Methodology
The CCI30 is a top 30 index. Each coin is weighted by its square root market cap.
Rebalancing Frequency
The index is rebalanced once every month.
Special Considerations
The CCI30 uses an exponentially backed off moving average for market cap, just like the HODL10. The CCI30 also ignores all stablecoins.
Pearson’s Correlation Coefficient:0.99
7. HODL30
Indexing Methodology
The HODL30 is very similar to the CCI30 index. Both indices weigh the individual coins by square root market cap and use an exponentially backed off moving average instead of calculating market cap as an instantaneous number.
Rebalancing Period
The default rebalancing period for the HODL30 is every 28 days. But you can customize this to whatever you’d like.
Special Considerations
The HODL30 and CCI30 use a different constant when calculating the exponentially backed off moving average. The constant used determines how much volatility is “smoothed” out.
Unlike the CCI30, the HODL30 is not a fund. Anyone with a Binance account can instantly trade into the HODL30 for free. Because it is not a fund, you can customize rebalancing frequencies, blacklist any coins you don’t want in the index, and cash out anytime.
Pearson’s Correlation Coefficient:0.99
8.CRIX
CRIX is a cryptocurrency index and not an investable fund. It was made specifically to help investors get a pulse on the cryptocurrency market. It was designed by Humboldt-University’s very own, Dr Wolfgang Karl Härdle.
Indexing Methodology
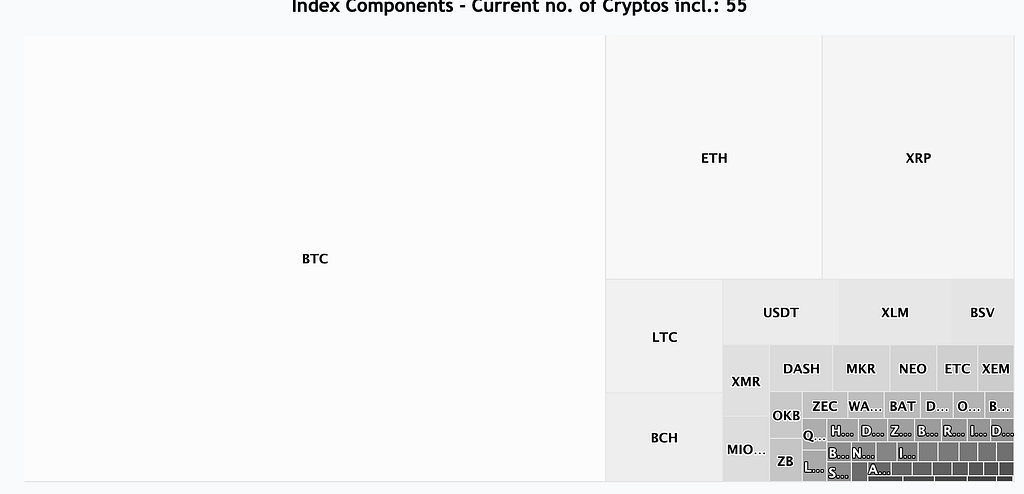
The CRIX index does not have a fixed number of constituents. Instead, it includes all assets with an average trading volume higher than the 25th percentile of the market. As of March 28, 2019, the CRIX index contains 55 coins. Every holding is weighted by market cap.
Rebalancing Period
Monthly rebalances are made only to percentage allocations, but not the number of constituents. Every quarter, the number of constituents is re-evaluated.
Special Considerations
The CRIX is a market index that uses Laspeyres derivation to ensure that any changes to the index are solely due to a change in price, and not supply. You can read more about the formula here.
Pearson’s Correlation Coefficient:0.99
9.Bloomberg Galaxy Crypto Index
The Bloomberg galaxy crypto index is a cryptocurrency index designed by Bloomberg, in partnership with Galaxy Crypto.
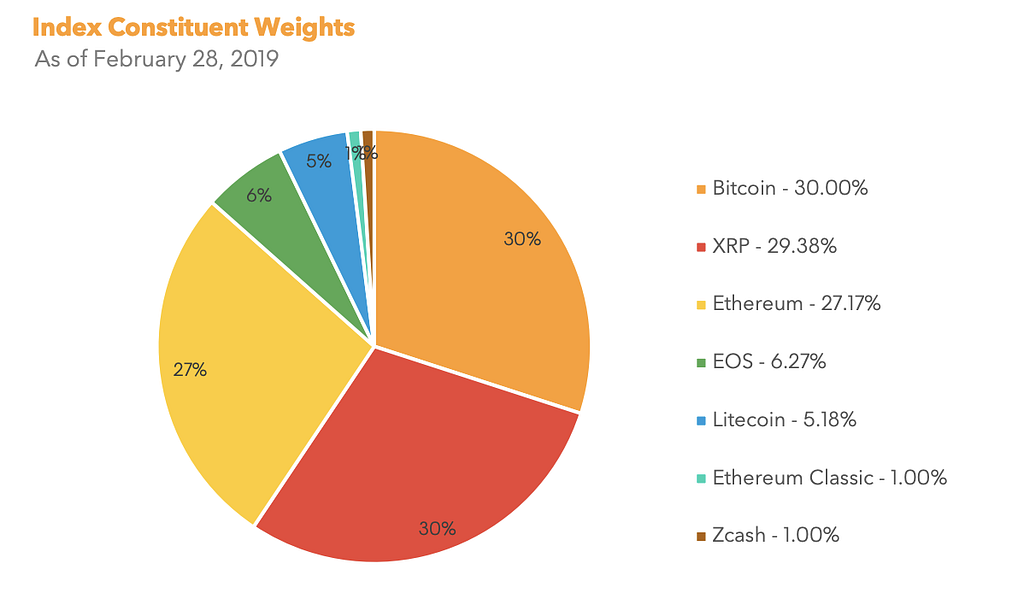
The index contains at most, 12 cryptocurrencies ranked by market capitalization. In the index, Bloomberg asserts that no constituent can exceed 30%, or be below 1%.
Rebalancing Frequency
The Bloomberg Galaxy Crypto Index is rebalanced once every month.
Special Considerations
Stablecoins are blacklisted. Only consistent coins with a 30-day median trading volume greater than $2 million are considered. Prices are averaged across Bloomberg-approved pricing sources and are based on the average mid-point between bids and asks.
The Bloomberg Galaxy Crypto Index also uses a Laspeyres derivation to ensure that any changes to the index are solely due to a change in price, and not supply.
Pearson’s Correlation Coefficient:0.99
10. Create Your Own Index with HodlBot
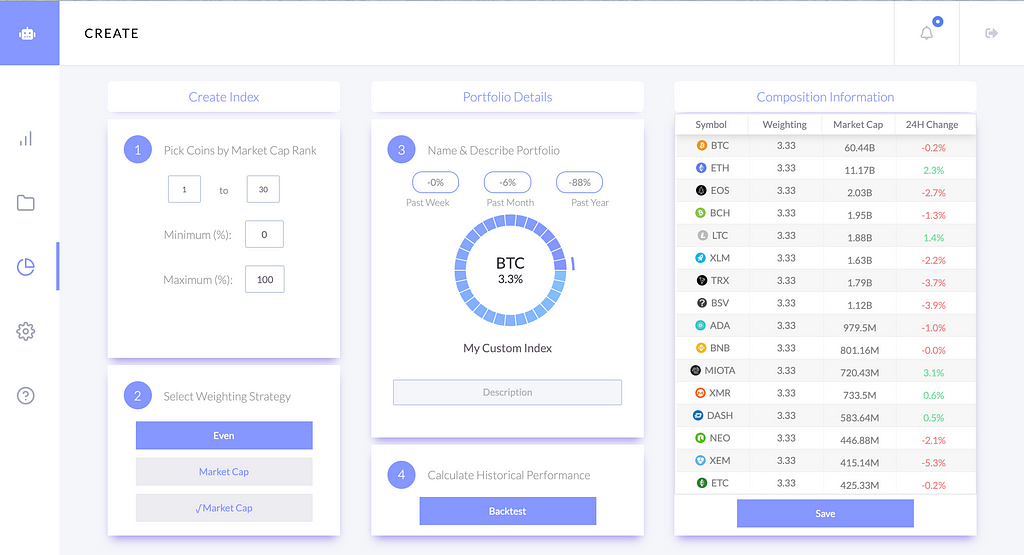
If none of the indices fit exactly what you’re looking for, you can create your own index with HodlBot. We’ve taken all common indexing methodology and made them available and customizable piece-meal.
- Choose a starting market cap rank and an ending market cap rank. e.g. ranks 20–40. This determines the # of coins in your index.
- Set minimum and maximum percentage caps.
- Select a weighting strategy (even, market cap, square root market cap)
- Backtest your strategy to see how your index would have performed in the past
- Blacklist coins you don’t like
- Customize your rebalancing period.
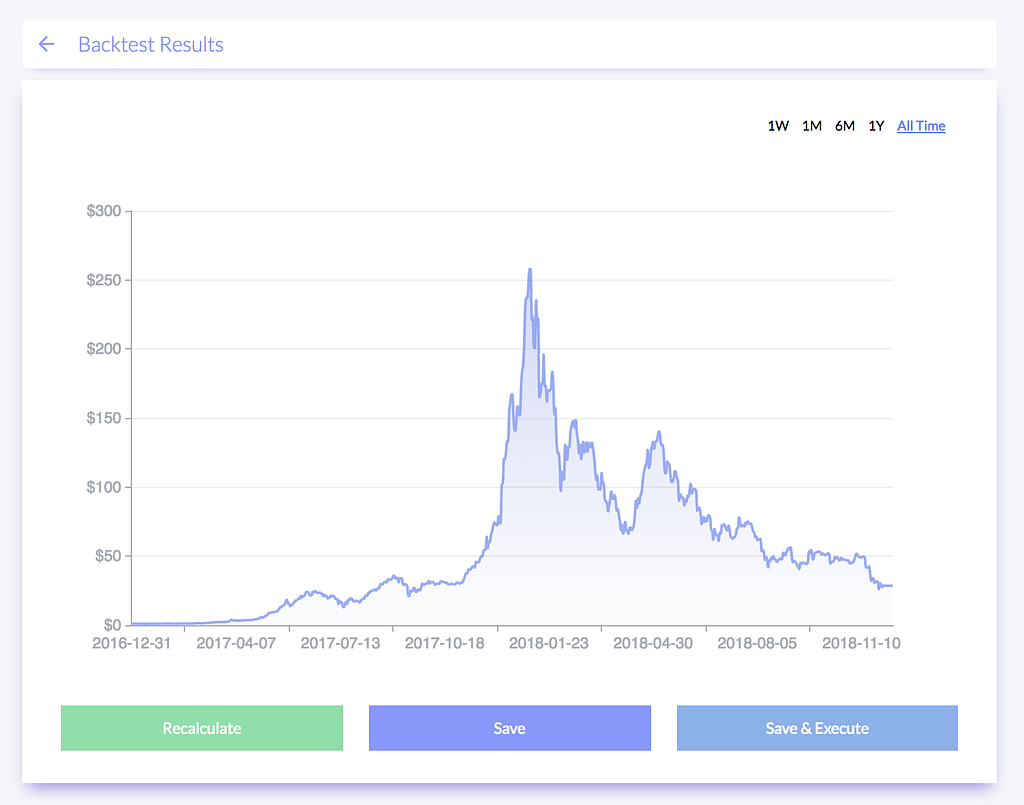 Historical backtest of custom index built on HodlBot
Why Do You Care About Indices So Much?
I’m the founder of HodlBot.
We made a tool that makes it super easy for everyday cryptocurrency investors to index the market. We created the HODL10, HODL20, and HODL30 indices. You can get set-up with one of the HODL indices in an instant. Or you can create your own custom index.
If you want to talk about this article, you should join our Telegram group of 500+ members.
Originally published at HodlBot on March 30, 2019.
The Ultimate Guide to Cryptocurrency Indices was originally published in Hacker Noon on Medium, where people are continuing the conversation by highlighting and responding to this story.
Disclaimer
The views and opinions expressed in this article are solely those of the authors and do not reflect the views of Bitcoin Insider. Every investment and trading move involves risk - this is especially true for cryptocurrencies given their volatility. We strongly advise our readers to conduct their own research when making a decision.
