Latest news about Bitcoin and all cryptocurrencies. Your daily crypto news habit.
Build trading systems using TradingView
Learn how to be more productive rather than watching the charts all day.
What we are going to cover in this article?
- What a trading system is
- Strategies, why do you need one
- Indicators, what they are and how to code one
- Coding a trading system
To resume, you will learn what a strategy is, for what it’s used and how to develop one without having a lot of code knowledge.
What is a trading system?
Developing a profitable trading algorithmic system is more than just finding a good idea, consists of several elements. Psychology and Money Management are fundamental parts of a successful investment. However, without a good strategy, you’ll hardly follow the market.
A trading system is a set of rules that govern a trader’s overall approach to trading financial markets. Defines the conditions under which a trader is most likely to emerge profitable and outlines how to engage those conditions.
An automated trading system indicates what types of trades a trader can take, the markets where will be executed, specific setups that trades may be based on, risk management, rules around time frames, trade management, and so on.
The need for a Strategy
What if you could have a buy/sell notification on your phone with the asset that you’ve been watching for days?
This is what cheered me up when I started to develop new strategies.
The end goal of a trading strategy is to give you a final trading action, buy or sell, a certain quantity of a trade-able asset.
A simple trading strategy is composed of the followings parameters:
- Risk: how much loss are you going to handle on the trade.
- Price: the price at which the trade is going to be executed.
- Quantity: the amount of capital which will be in the trade.
- Entry trade: based on the strategy it will perform a buy or sell action at a predefined price.
- Exit trade: based on the trade outcome, the strategy decide if it wants to exit that position.
To start building your own strategy firstly is important to choose the market you want to trade. Then, you don’t have to start from zero, you can use a public one based on different categories as trend-following. There are plenty of strategies out there.
It’s very important to optimize the strategy to be consistently profitable on new, unseen data.
Once you have your trading system, the final part is to set up a risk management system.
Risk management includes pre and post-trade checks in the algorithm, assigning reasonable stop losses or optimal capital allocation. Effective risk management creates protection against catastrophic losses. As Stan Weinstein once said:
Fear causes you to panic and sell at the bottom, while greed motivates you to buy right near the top. These are the driving factors behind the crowd’s yo-yo mentality.
Indicators
The indicators are mathematical formulas interpreted in a chart. Starting from historical data of an asset, everything you want is calculated and as a result, it is represented in your asset chart.
The indicators that we are going to implement generate buy or sell signals through crossovers or divergence.
- Crossovers: the price moves through a moving average or when two moving averages crossover.
- Divergence: the direction of a price trend and the direction of an indicator are moving in opposite directions.
Indicators are helpful in identifying momentum, trends, volatility, and other aspects of an asset. There are many types of them, but for what we are going to use in the strategy, it’s enough with two of the most useful trend and momentum indicators.
SMA
The single moving average is a technical indicator for determining if an asset price will continue or reverse a bull or bear trend.
The SMA is calculated as the arithmetic average of an asset’s price over some period.
Trend identification and confirmation: if the slope is positive it will show the prices above the average, and if it’s negative the average will be above prices.
RSI
The relative strength index (RSI) is a momentum indicator that measures the magnitude of recent price changes to evaluate overbought or oversold conditions in the price of an asset.
The RSI compares bullish and bearish price momentum plotted against the graph of an asset’s price.
Signals are considered overbought or overvalued when the indicator is above 70% and oversold or undervalued when the indicator is below 30%.
RSI compares, based on a specific period of time, the days where the asset closed at a higher price (Avg Gain) with the ones that closed with a lower price (Avg Loss).
Code the indicator
Let’s code those indicators. For that, we are going to use TradingView Pine Editor.
There are two types of scripts in Pine. Differs if you want to code an indicator or a strategy. The study corresponds for indicators and strategy when you implement conditions to place a long or short trade.
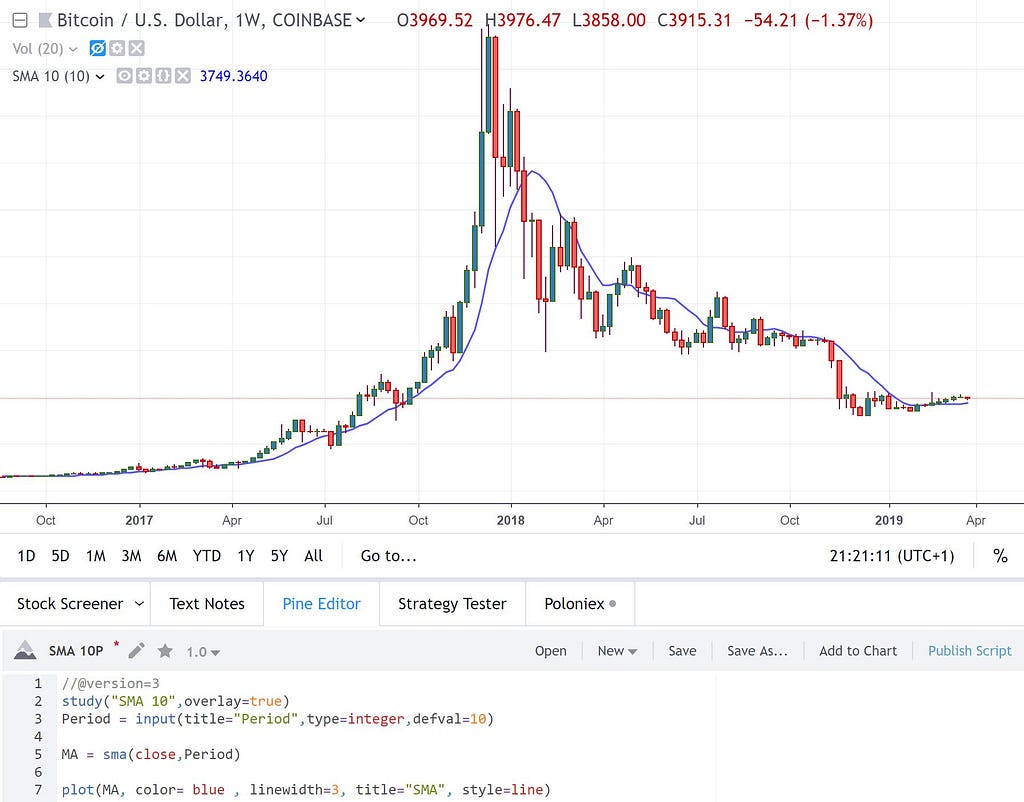
SMA
study("SMA 10",overlay=true)Period = input(title="Period",type=integer,defval=10)MA = sma(close,Period)plot(MA, color= blue , linewidth=3, title="SMA", style=line)
- study: overlay=true if you want to plot the results on the chart itself, else if you are building an indicator like any oscillators, then you might want to keep it as false.
- Period: input function with default value as 10. Its output gets stored in Period and passed as a parameter to the inbuilt pine function “sma()”.
- MA: we define a variable “MA” which will store the 10 period simple moving average of candle closings.
Finally, we plot the result in the chart. For example, Bitcoin in a weekly timeframe:
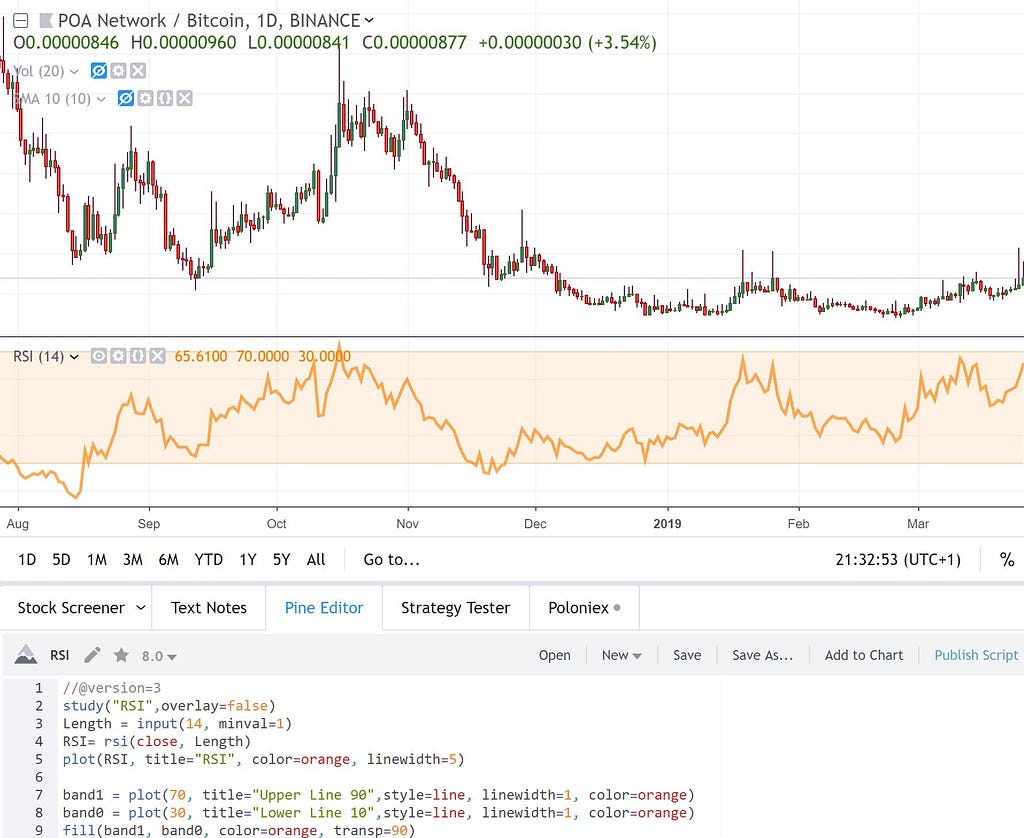
RSI
study("RSI",overlay=false)Length = input(14, minval=1)
RSI= rsi(close, Length)
plot(RSI, title="RSI", color=orange, linewidth=5)band1 = plot(70, title="Upper Line 90",style=line, linewidth=1, color=orange)band0 = plot(30, title="Lower Line 10",style=line, linewidth=1, color=orange)fill(band1, band0, color=orange, transp=90)
- study: in this case the overlay parameter is it set to false.
- Length: input function with default value as 14. Its output gets stored in Length and passed as a parameter to the inbuilt pine function “rsi()”.
- RSI: we define a variable “RSI” which will be stored the 14 period and the relative strength index result.
- band0/band1: the lines that determinate the overbought or oversold conditions.
Following the plotted result into a POA daily chart:
Let’s build a trading strategy
In my opinion, in the cryptocurrency market, unless you love risk and don’t use a stop loss, the best way to perform a trading strategy is to develop a semi-automated one. Once you got a notification about one condition you wrote down, it’s better to check the chart before executing the trade.
I assume you already know what pump and dump mean, the markets insider, the XRP Army or let’s write a tweet and shill that coin. If you are a conservative and disciplined trader, with the high volatility in cryptocurrency all your stop loss will be filled. Trust me, even if you define a 3% stop loss, at your trade journal you will have more than 70% trades in red. That’s why I prefer to create “The Alert Strategy” and sleep soundly.
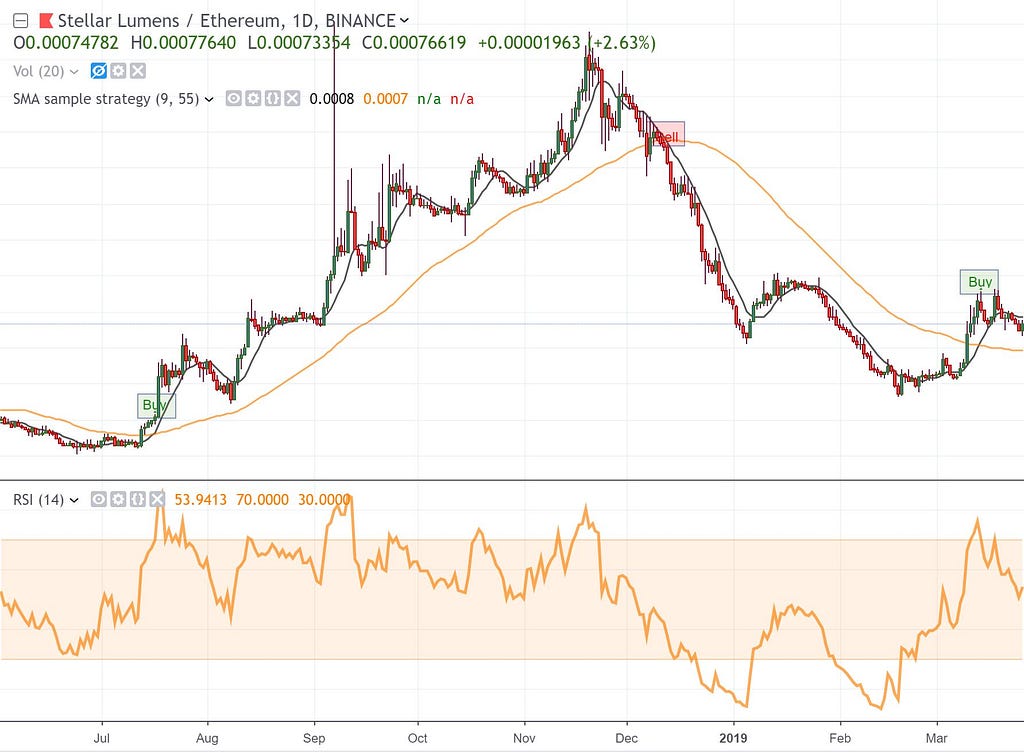
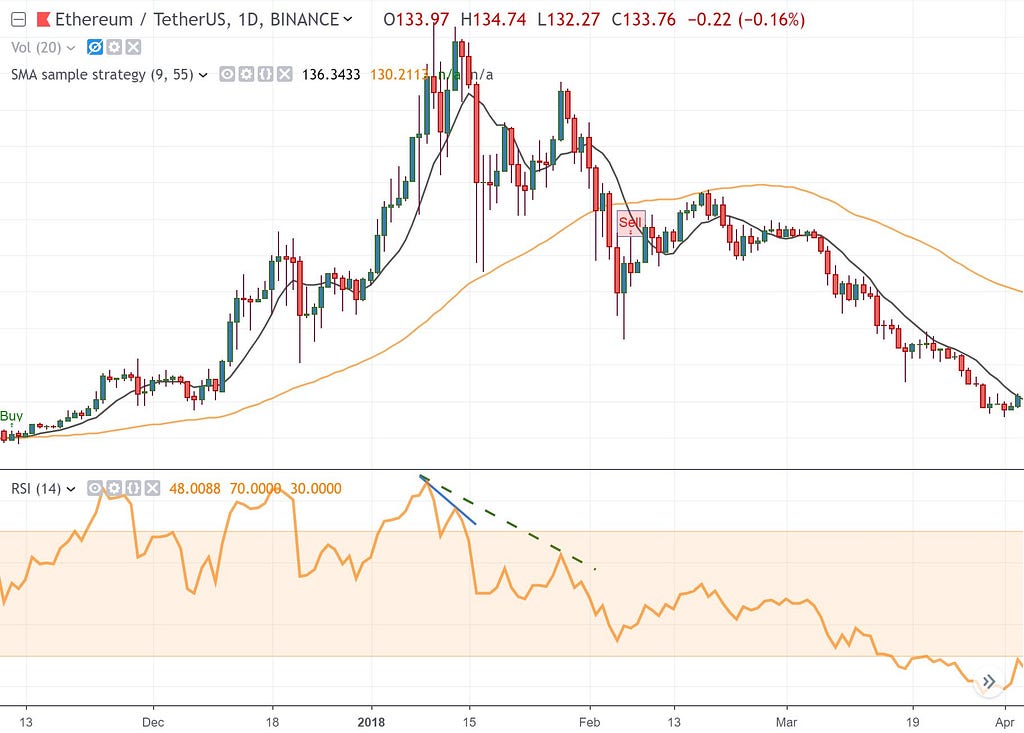
As I said before, we are going to use crossovers signals. We are going to create two SMA and check when the lowest one crossover the longest moving average. That will be our BUY signal. When there is a cross-under between the two SMA a SELL signal will be placed.
Let’s take a look at the code:
study("SMA sample strategy",overlay=true)LowestPeriod = input(title="Lowest Period",type=integer,defval=9)LongestPeriod = input(title="Longest Period",type=integer,defval=55)LowestMA = sma(close,LowestPeriod)LongestMA = sma(close,LongestPeriod)plot(LowestMA, color=black, linewidth=3, title="Lowest MA", trackprice=false, style=line)plot(LongestMA , color=orange, linewidth=3, title="Longest MA", trackprice=false, style=line)Trend = LowestMA > LongestMA ? 1 : LowestMA < LongestMA ? -1 : 0Trend1p =(Trend == 1 and Trend[1] != 1 ? Trend : na)Trend1n =(Trend == -1 and Trend[1] != -1 ? Trend : na)alertcondition(Trend1p, title='"Up Entry', message='BUY')alertcondition(Trend1n, title='"Down Entry', message='SELL')plotshape(Trend1p, color=green, style=shape.arrowup, text ="Buy")plotshape(Trend1n, color=red, style=shape.arrowdown, text = "Sell")In the code, we add the alertcondition() function so that we can choose the strategy condition that will outcome the notifications in our device.
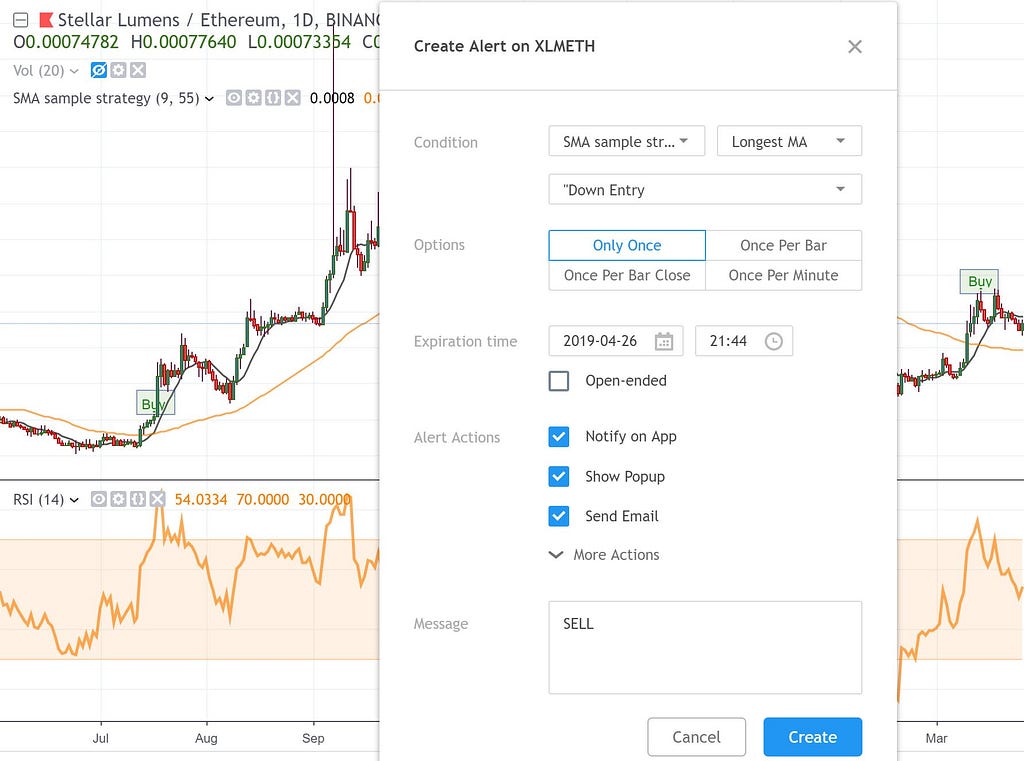
alertcondition(Trend1p, title='"Up Entry', message='BUY')alertcondition(Trend1n, title='"Down Entry', message='SELL')
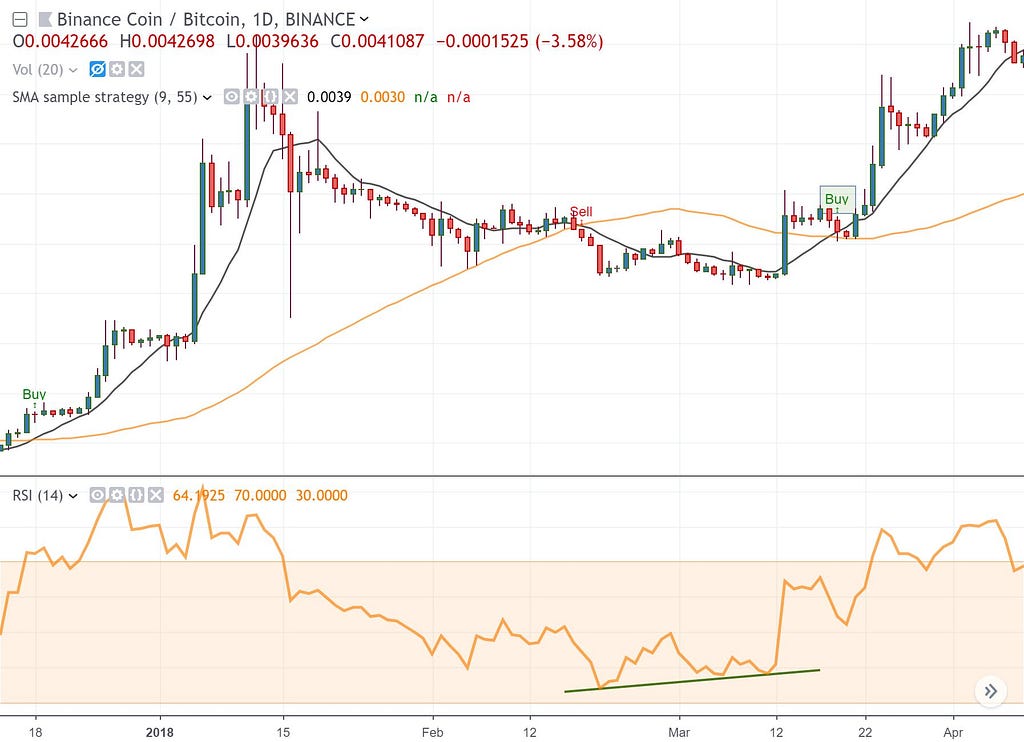
Let’s create a sell alert for the Stellar coin that the strategy just bought. In the Condition parameter we choose our system SMA sample strategy :
But, for what I need RSI if the strategy only implies the two moving averages?
With the RSI indicator, we are going to know the degree of strength that the coin has in the respective moment. Analyzing how the supply and demand react is essential to check if that coin has enough liquidity to fulfil your orders. Here is where the divergence signals take place:
- Bearish Divergence: the coin price has a bullish scenario but the RSI moves in the opposite direction.
- Bullish Divergence: the coin price has a bearish scenario but the RSI moves in the opposite direction.
In case you are wondering how to build an automated version, here the sample code:
strategy("SMA Strategy", overlay=true)longCondition = crossover(sma(close, 10), sma(close, 20))
if (longCondition)
strategy.entry("Long Entry", strategy.long)shortCondition = crossunder(sma(close, 10), sma(close, 20))
if (shortCondition)
strategy.entry("Short Entry", strategy.short)To summer up
Trading algorithms aren’t that simple. This is just a short view on how to implement one in the TradingView Pine editor.
The periods in the code may change, the ones used may work with a daily timeframe chart, but you have to do your own backtesting and came out with the proper parameters.
To build a good strategy, it is essential to have a checklist, which allows us to check the outcome of the operations. Don’t run too much, work day by day in your strategy, write down your operations and execute them in a disciplined way.
When there is no clue about the strategy output and the asset trend, the best you can do is to leave it. The ultimate goal is to minimize the losses when the trade goes against the trend and maximize profits when the price goes in your favour.
Trade safe.
A Cryptocurrency Trading Strategy was originally published in Hacker Noon on Medium, where people are continuing the conversation by highlighting and responding to this story.
Disclaimer
The views and opinions expressed in this article are solely those of the authors and do not reflect the views of Bitcoin Insider. Every investment and trading move involves risk - this is especially true for cryptocurrencies given their volatility. We strongly advise our readers to conduct their own research when making a decision.


