Latest news about Bitcoin and all cryptocurrencies. Your daily crypto news habit.
Histogram Equalization is one of the fundamental tools in the image processing toolkit. It’s a technique for adjusting the pixel values in an image to enhance the contrast by making those intensities more equal across the board. Typically, the histogram of an image will have something close to a normal distribution, but equalization aims for a uniform distribution. In this article, we’re going to program a histogram equalizer in python from scratch. If you want to see the full code, I’ve included a link to a Jupyter notebook at the bottom of this article. Now, if you’re ready, let’s dive in!
Before anything, we have to do some setup. Let’s import the libraries we’ll be using throughout the program, load in the image, and display it:
For the purposes of this tutorial, we’re using a grayscale image since each pixel in a grayscale image represents only one value — the intensity. I think this makes the math easier to reason about since we only have to care about one value. For comparison, in an RGB color image, each pixel contains three values (Red/Green/Blue). Due to how we’re reading in and processing the image, you can still run a color image through this program — and I encourage you to so you can see what kind of output you’d get!
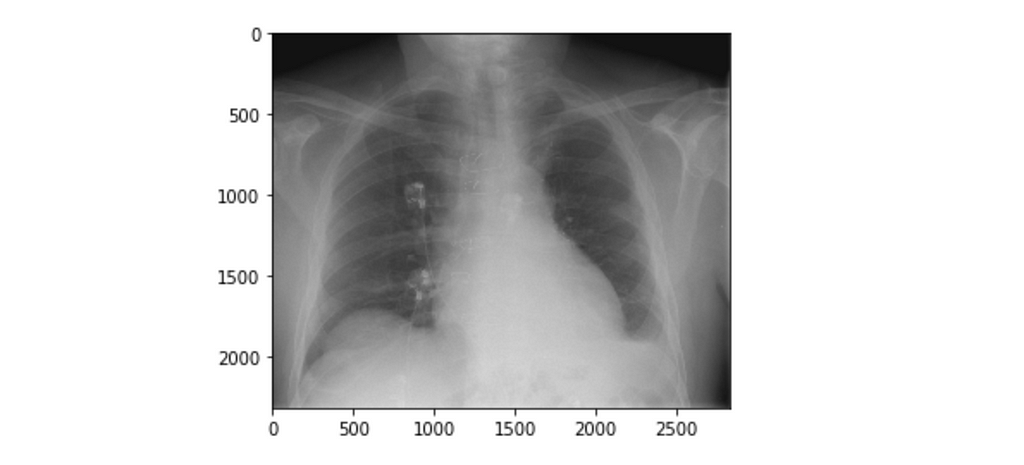
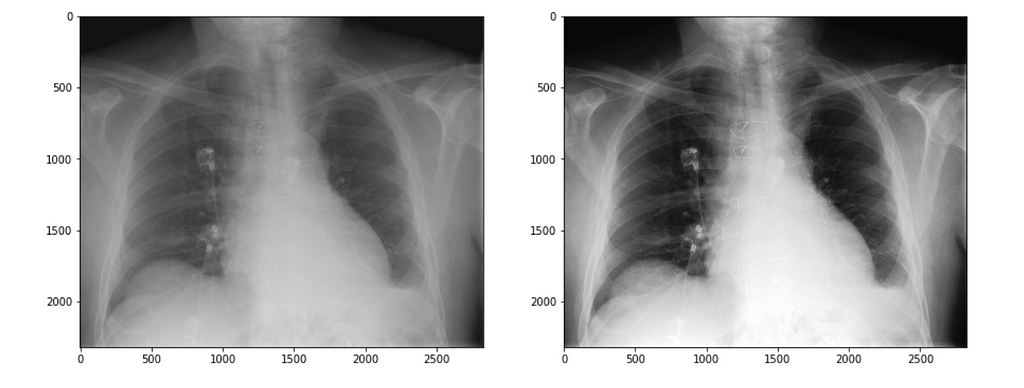
The image we’ll be using is a washed-out x-ray. We can pretend that we’re radiologists that want to equalize the x-ray to better see some of the details.
In order to process the image, we have to first read it in as an array. However, numpy will automatically return a multi-dimensional array, so we flatten it to a one-dimensional array:
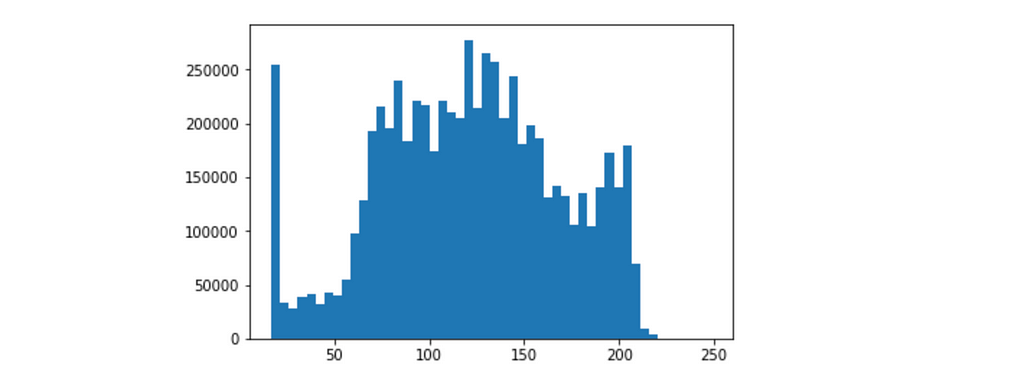
In the flattened array, we have an intensity value for every pixel. The values will range from 0 (black) to 255 (white). Everything in between can be considered a shade of gray. As you can see from the diagram above, we have a spike of values near zero and not many values over 200.
We can now take our one-dimensional array and compute the histogram for the image based on the frequency of similar intensity values. There are pre-existing functions that will do this for you, but we’re making this from scratch, so let’s write our own!
⚠️ Keep in mind that for production environments, you would want to use pre-existing functions since they’re better optimized, and can handle more use cases.
The mathematical formula from which we’ll base our solution is:
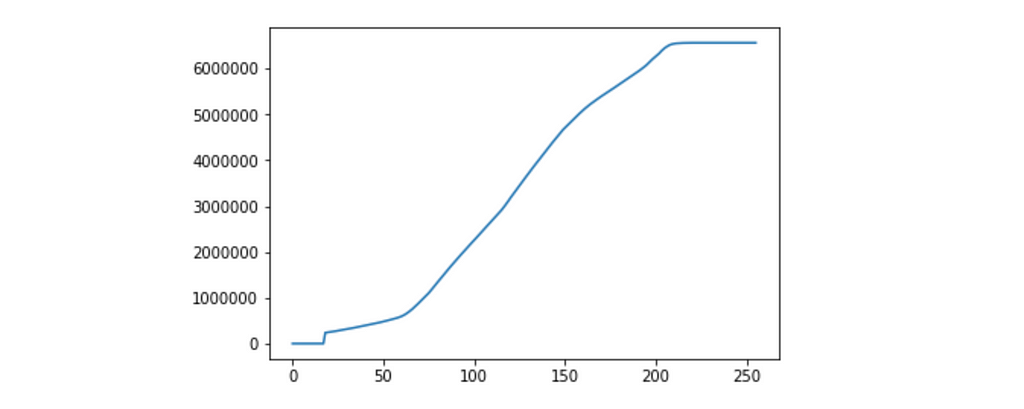
Now we have our histogram, and we can take the next step towards equalization by computing the cumulative sum of the histogram. The cumulative sum is exactly as it sounds — the sum of all values in the histogram up to that point, taking into account all previous values. Just as above, there are functions that exist to compute this for you, but let’s write our own:
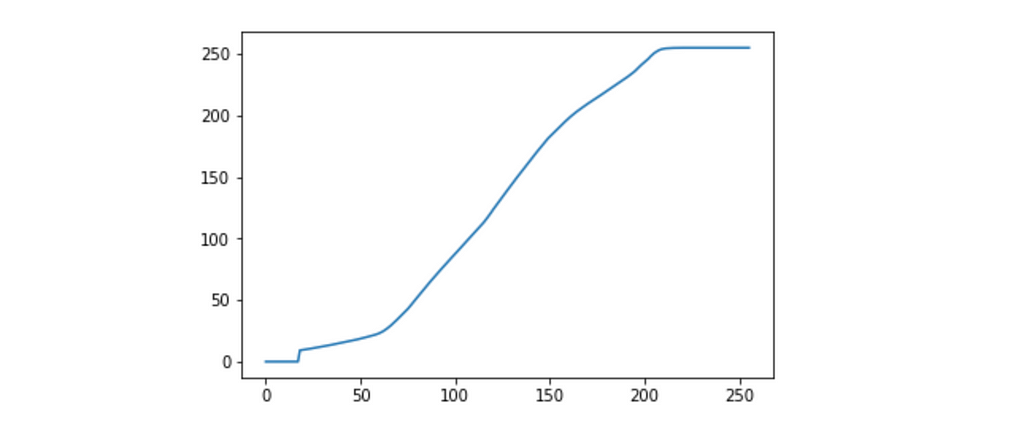
We’re making progress! We now have the cumulative sum, but as you can see, the values are huge (> 6,000,000). We’re going to be matching these values to our original image in the final step, so we have to normalize them to conform to a range of 0–255. Here’s one last formula for us to code up:
That’s better — our values are now normalized between 0-255. Now, for the grand finale. We can now use the normalized cumulative sum to modify the intensity values of our original image. The code to do this can look a bit confusing if you’ve never used numpy before. In fact, it’s anti-climactically simple.
We’ll take all of the values from the flat array and use it as the index to look up related value in the cs array. The result becomes the new intensity value which will be stored in img_new for that particular pixel.
As a final step, we reshape the array to match the original image so we can render the result as an image.
And there we have it — the original image has been equalized. We’re practically radiologists now! Notice the difference in contrast throughout the whole image. The most important thing to remember about histogram equalization is that it adjusts the intensities at a global level, taking into account all pixels. That process works well for images like the one above but may perform poorly on other images.
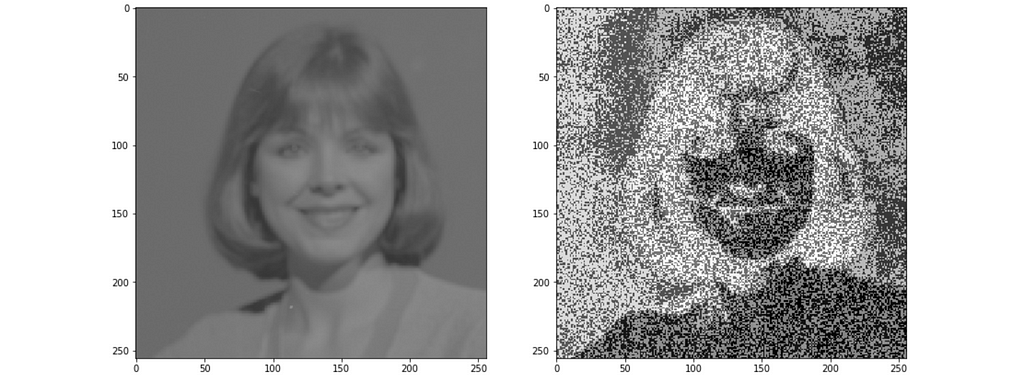
For example, take the image below — it was transformed using the exact same algorithm, however, you can see that it didn’t enhance the photo as much as it utterly destroyed it:
Histogram equalization isn’t always the perfect tool for the job. But, there are other methods you can use that take neighboring pixels into consideration instead of using the entire image. Stay tuned for the next article where we’ll walk through a more localized equalization algorithm.
The full source code (as a Jupyter notebook) for this article can be found here:
torywalker/histogram-equalizer
👏 If you found this article helpful and would like to see more, please let me know by leaving some claps! 🔗 Follow for more articles like this!
Histogram Equalization in Python from Scratch was originally published in Hacker Noon on Medium, where people are continuing the conversation by highlighting and responding to this story.
Disclaimer
The views and opinions expressed in this article are solely those of the authors and do not reflect the views of Bitcoin Insider. Every investment and trading move involves risk - this is especially true for cryptocurrencies given their volatility. We strongly advise our readers to conduct their own research when making a decision.

