Latest news about Bitcoin and all cryptocurrencies. Your daily crypto news habit.
 A night worker on a very different infrastructure project takes in the skyline — Shanghai, China
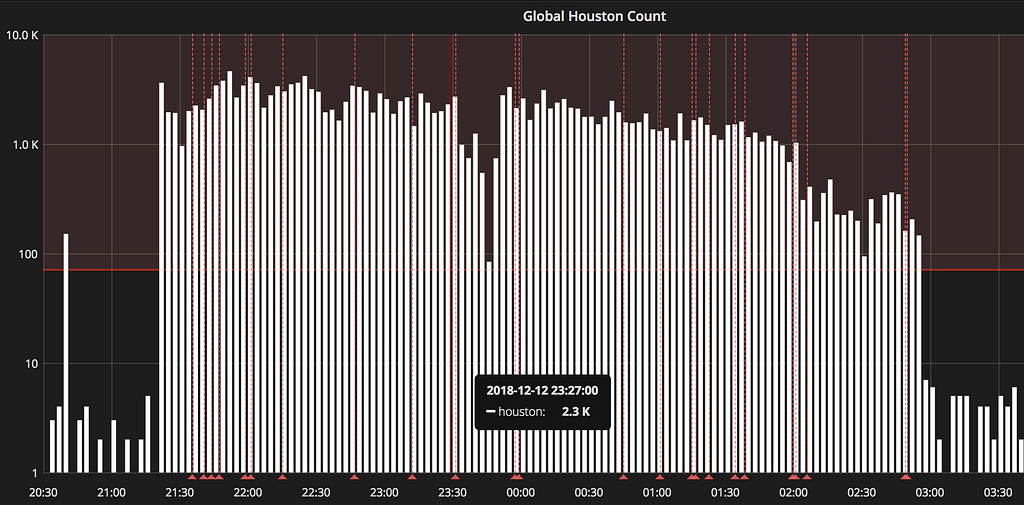
From 21:22 UTC on Wednesday December 12th a sustained increase in 500 error responses were seen on Skyscanner’s Flight Search Results page, and in the early hours of the following morning 9% of Flight Search traffic was being served a 500 response.
As a junior software engineer this was my first experience of assisting to mitigate an out-of-hours production incident. While I had previously collaborated on comparable follow-up investigations, I had never been the one problem-solving during the night (while sleep-deprived) before! This post walks through some specifics of the incident and, by describing the event sequentially (rather than as simply a summary of actions), hopefully shows how Skyscanner’s culture of autonomy and ownership, regardless of level, serves to support out-of-hours critical problem-solving.
Time to detection: ~2 minutes
 Public post in Slack after initial investigation proved the problem was ongoing
To understand the above Slack message, posted at 21:44 UTC in the #gap-support channel, some background context to Skyscanner squad and service architecture is needed.
Stephen is part of the ‘GAP’ squad — short for Global Availability and Performance. An automated Victor Ops page at 21:22 UTC relating to site availability alerted him to an issue, which he acknowledged and got online to start addressing within 15 minutes. Upon seeing this was an ongoing issue the above message was posted in a public support channel, creating immediate visibility and a point of communication focus for any other engineer receiving alerts or seeing problems.
This was seen by Mishkat Ahmed, an engineer with the Flight Search Squad (FSS) that owns ‘Day View’ who had also received an alert relating to 500 responses for the service and was investigating, and myself, who just happened to be online.
So what is Day View? Day View, also referred to as Sol, is the Flights Search Results page. A simplified request flow, showing some elements that will be referenced later, is shown below. Important here is the ‘readiness’ endpoint for Sol, which is used to determine if Request Handler should send a request to Sol in a specific AWS region, or if instead Request Handler should failover traffic to another region.
 Request flow resulting from a traveller performing a Flights search
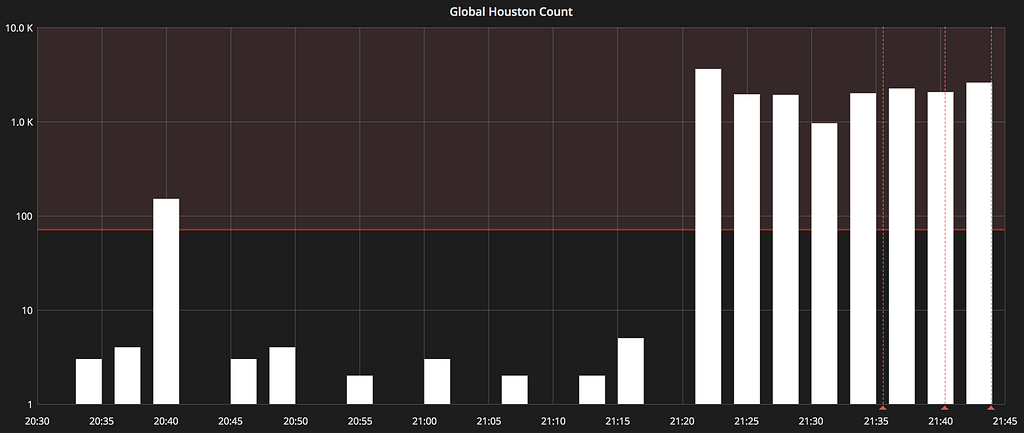 Global 500 count
Initial metrics alerted on by GAP showed a clear increase in global 500 responses (internally referred to as ‘Houstons’).
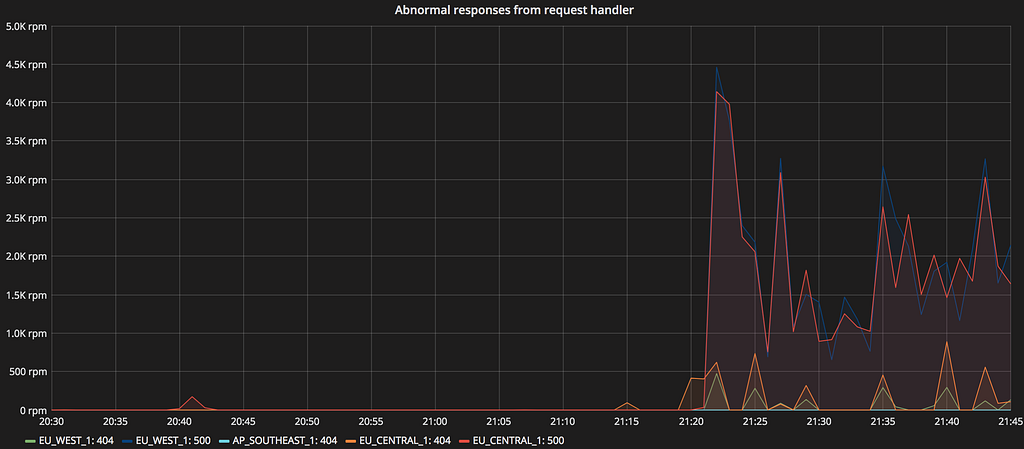 Non-2xx responses for Sol from Request Handler
FSS had been alerted to the ‘readiness’ health check endpoint in the eu-west-1 and eu-central-1 AWS regions showing an increased failure rate. Traffic from eu-west-1 was failing over to eu-central-1, and some traffic being failed over from already down instances in eu-central-1 to the ap-southeast-1 region.
 Cache connections for Sol in eu-west-1
Initial investigations showed that these 500s were all related to Sol. This was important to establish as early as possible. It helped in both narrowing down possible root causes, and knowing if other engineers needed to be paged.
At this point FSS was also aware that the AWS Redis ElastiCache in eu-central-1 and eu-west-1 were experiencing problems due to an unknown cause. As pictured, its current connections dropped, and extreme fluctuations followed.
Once it was known that the problem was Sol specific, it was seen, on both GAP and FSS dashboards when drilling down into lower-level metrics, that the Travel API (depended upon for geo-data) was returning non-2xx responses.
At this point this information was all being posted in the Slack thread, giving full visibility in real time, and also helpful timestamps for later analysis.
It was at this point that I had noticed the ongoing thread, and after skim reading noted that it was touching on services my squad (Web Infx) owned (Request Handler and Sol’s base template) and Travel API, which I had prior experience of being a rate-limited service.
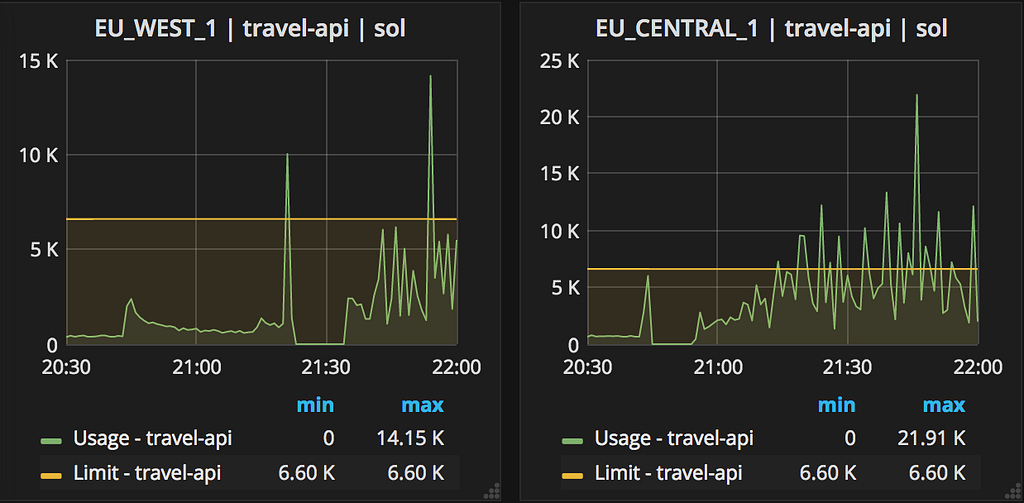 Travel API rate limits being reached
Seeing that the Travel API limits were indeed being reached I noted this in the ongoing thread at ~22:00 UTC. It also seemed to me that manually failing over all eu-* traffic to ap-* was inadvisable, as rate limits would then be exceeded in that region if no other changes were made.
This brings us to the first non-process, non-technical, point that stands out to me: I felt safe to contribute. By joining the dialogue I was certainly opening myself up to future questions I might not be able to answer, but I knew that both Stephen and Mishkat exemplified Skyscanner’s blame-free and inclusive culture, and so I felt psychologically safe enough to contribute.
As it was evident that there were several layers to be investigated a Zoom call was started at 22:15 UTC. The incident was determined to be of the highest ‘Priority 1’ status, as the sustained 500s were ‘adversely affecting more than 1% of our users in any of Flights, Hotels, Car Hire, or Rail.’ This was important in determining the scope of steps available to be taken, because during P1 incidents 24h support is given from all offices as required.
Total time to mitigation: 5h 40 minutes
Over Slack the Travel API on-call engineer was paged to check Travel API health, and look at increasing Sol’s rate limit.
Meanwhile on the Zoom video call multiple threads of investigation were being opened with the aim of either discovering and fixing the root cause, or at a minimum mitigating the ongoing issue. Independently each of the three engineers was walking through different logs and dashboards, while screen-sharing as appropriate.
It was seen that the increase in load on Travel API was not completely proportional to the 500s being seen, there were more 500s visible in Request Handler than downstream at Travel API.
The root cause of the cache failure remained elusive, with no logs showing any obvious pattern to indicate what had caused it to go down.
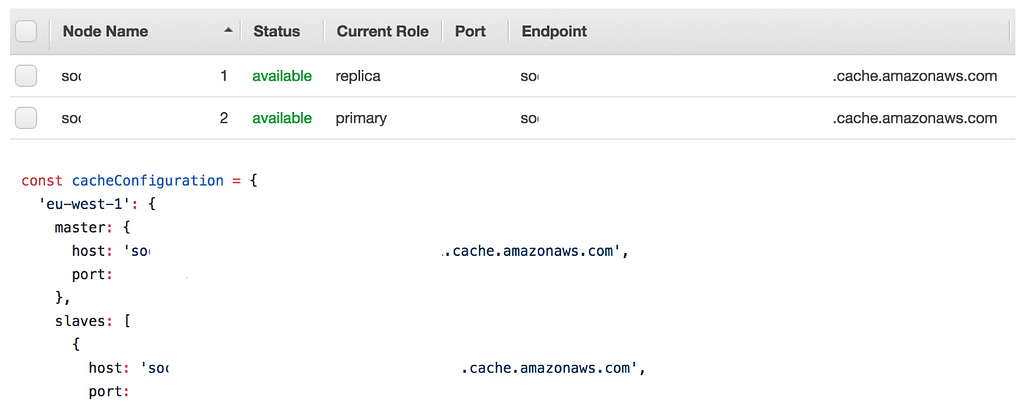 Only the primary cache node can be written to
Logs did show the cache failing to be written to, and looking in the AWS dashboard it was seen that the master (primary) and slave (replica) nodes of the failed caches were out of sync with what was specified in Sol. This would mean that Sol would be trying to write to a replica node, which would not be possible. It was not known at this point how they could go out of sync, but a redeploy of Sol was initiated with updated values. Thanks to Skyscanner’s internal tooling, provided by the Developer Enablement Tribe, once a pull request has been merged an automated chain of events takes over to deploy to production, but this does take time to complete.
Travel API was also struggling to scale its clusters higher due to unforeseen complexities, meaning an increase in its rate limit was also still pending.
Even without the rate limit increase, at ~23:50 UTC Sol showed full recovery as the redeploy with an updated cache configuration completed 🎉
However, we were not out of the woods yet… About 10 minutes later eu-west-1, eu-central-1, and shortly later additionally ap-southeast-1 showed cache failures, and 500s abruptly spiked.
The on call engineer for Web Infx had already received automated pages earlier from Request Handler alerts, but on seeing a squad representative was present and managing was thankful to go back to sleep. However, with new developments and the clock now ticking past midnight, on the next automated page they were invited to join the ongoing call.
The cause of the cache failure was still unknown - as was how it caused the nodes to go out of sync between primary and replica.
However, the time while Sol was redeploying was not wasted. Knowledge on Request Handler’s failover mechanism was refreshed. Important here is that on receiving two failure responses from a readiness check Request Handler will mark the instance as down, and its availability state will persist for 2 minutes. If two regions in a row are marked as down then a 500 response will be given back to the Traveller. In this way nearly all previous incidents handled failing over traffic with no need for manual intervention. Something was different here.
With additional eyes now looking for anything that had been missed, or assumed, so far, the main investigation now showed a new piece of information: Sol’s readiness check included a check for cache health. This provided sudden clarity on the amount of 500s seen! With the cache connections so unstable the traffic could be flip-flopping between regions, alternating between instances marked as up or down over short periods of time. This would mean the chances of hitting two ‘downs’ was much more likely.
The inclusion of this in the readiness check was a legacy issue, from when Travel API could not, for unrelated reasons, scale to meet traffic demands with no cache in place. Not adjusting this later on was now coming back to bite us.
A decision now had to be made as the route cause of the cache failure was still unknown. Should we continue to investigate this, or aim to mitigate traveller impact by surviving without a cache? It was assumed latency would increase, but healthy responses should then be shown in most cases. It was decided to remove the cache health check in one region, while setting up to realign the cache nodes in the others.
The effect in ap-southeast-1 was immediate on its deploy, spiking requests from ~2k a minute to ~35k a minute, for 15 minutes well over the still-increasing limit.
After this spike normalised it remained below the new limit, with the global 500 showing some sustained reduction. With the cache nodes realigned in eu-west-1 and eu-central-1 and the cache check removed from the readiness endpoints for those regions the global 500s reduced to well beneath the alerting limit. It was now ~03:30 UTC. Having seen Travel API, and other downstream dependencies, handle the increased load in a region with no cache and survive, it was determined that any further steps could wait until the next day. A summary was posted in #gap-support, and handover done to the APAC GAP squad member starting their morning in Singapore.
 While not resolved, mitigated to now longer be P1 status
Root causes
The following day investigations continued, with a temporary Slack channel set-up to keep clear and publicly visible communication organised.
For the engineers who had been up the previous night it was their choice to come in later, or leave earlier, to make up for the unsociable extra hours worked. By leaving a clear summary before signing off for the night it meant work could be picked up immediately by other squad members in the morning, with no time spent waiting for information buried in someone’s head.
Applying the ‘five whys’ approach gradually uncovered the root cause of the problem:
Why were users seeing 500 pages?
- Sol’s readiness check relies on a healthy cache, and the cache was failing.
Why did the cache fail?
- The CPU limit on a single core was reached. As Redis runs primarily on a single thread, it is bound by a single core’s capacity. When the CPU limit was reached, Redis was no longer able to hold a stable connection with clients.
Why was the CPU limit reached?
- Total load on the Redis process was too great.
Why was the load on the Redis process too great?
- There had been a major increase in the number of set commands to an extent the cache node was full. Items therefore needed to be evicted from the cache. The need to evict contributes to the CPU time needed by the Redis process. As the set commands were continuing at a high rate the maximum load was continually exceeded.
Why was there an increase in set commands?
- A component with high cache key cardinality (including the date of a flight search in the key) had been released from behind an A/B experiment to 100% of travellers and was hammering the cache. This release was done by an external squad, so was not seen in Sol release logs.
It was also uncovered why the primary and replica cache nodes were seen to go out of sync. A mistake in Sol’s configuration had the master endpoint set directly to the, at that time, primary node’s endpoint, rather than the cache cluster’s primary endpoint. When pointing at the cluster’s primary rather than the individual node ElastiCache automatically handles changes within the cluster.
Actions
- Immediate roll back of the offending component, with changes subsequently made to remove the unintended inclusion of a traveller’s travel dates from the cache key, reducing cardinality.
- Ensure all downstream dependencies can scale to take all Sol traffic in a single region at peak hours, understand the scale up period expected, then remove cache health check from all regions
Update Sol’s cache configuration to:
- Point at the cluster’s primary endpoint
- Add additional alerting around CPU Usage, SWAP Usage, Evictions, and Current Connections as recommended by AWS
- Increase reserved memory % to 25 to handle background process as recommended by AWS
- Investigate running Redis with cluster mode enabled
Postmortem / Incident Learning Debrief
As the owning squad FSS next organised a postmortem open to all, with specific invites to squads that were known to work in a similar area. A brief is prepared in advance, and iterated on afterwards for future reference.
This gave a chance to spread the knowledge gained, and have external eyes come up with any new questions. This is standard procedure within Skyscanner, with blame left at the door to see only what can be learnt and improved upon.
Final thoughts
It was personally very encouraging to be treated as a peer — both during the incident and the investigation, and have good input verbally recognised, while having requests for deeper explanations fielded without judgement.
For help both during and after the overnight incident I would like to give additional thanks to Vanč Levstik, Matt Hailey, Maria Tsakiri, John Robertson, Mungo Dewar, Andrew Jones, Sam Stradling, and Carlos Pérez.
Lastly, we would like to remain fully transparent and display the temporary drop in Flight Search Results availability down from our 99.9% target while the incident was ongoing. Interestingly, possibly because the majority of responses were successful and maintained their high quality, we saw no significant impact on the number of Travellers booking flights. I will leave the final mystery of why ‘pokemon’ is included in the graph title until another day! 😉
 Request Handler responses from Sol before, during, and after the incident
SEE the world with us
Many of our employees have had the opportunity to take advantage of Skyscanner Employee Experience (SEE) — a self-funded, self-organised programme that allows you to work up to 30 days (in a 24 month period), in one or more of our 10 global offices. Additionally, if an employee is based in an office outside of the country they call home they can work for up to 15 days per year from their home country.
Like the sound of these benefits? They’re just the tip of the iceberg. Look at our current Skyscanner Product Engineering job roles for more information.
About the author
Hi! My name is Dominic Fraser, a traveller turned Product Manager turned Software Engineer.
I’m based in Edinburgh, but have been lucky enough to visit colleagues in Sofia, London, Glasgow, and Budapest!
I currently work in the Web Infx squad, an enablement squad focussing mainly on the web platform of Skyscanner. No day is the same, and as seen by this post sometimes no night!
Dealing with a Production Incident After Midnight was originally published in Hacker Noon on Medium, where people are continuing the conversation by highlighting and responding to this story.
Disclaimer
The views and opinions expressed in this article are solely those of the authors and do not reflect the views of Bitcoin Insider. Every investment and trading move involves risk - this is especially true for cryptocurrencies given their volatility. We strongly advise our readers to conduct their own research when making a decision.


