Latest news about Bitcoin and all cryptocurrencies. Your daily crypto news habit.
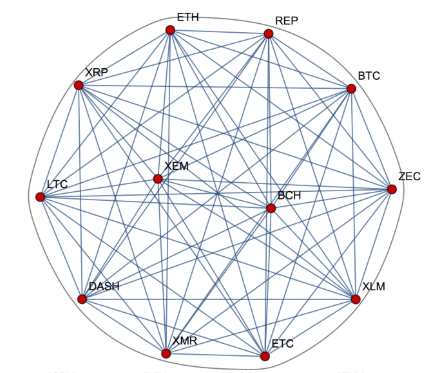 90 day correlation graph from Sifr Data
Cryptoassets are highly correlated. On a macro level, one can expect the overall cryptoasset market to generally move in tandem with Bitcoin. Correlations of daily returns between cryptoassets and Bitcoin have been increasing since January 2017. From this period forward, the overall market has been tightly bound together despite the altcoin, ICO, and fork mania that has taken place over the past year and a half.
This upward trend in market correlation typically doesn’t bode well for investors and funds looking to reduce risk with portfolio diversification.
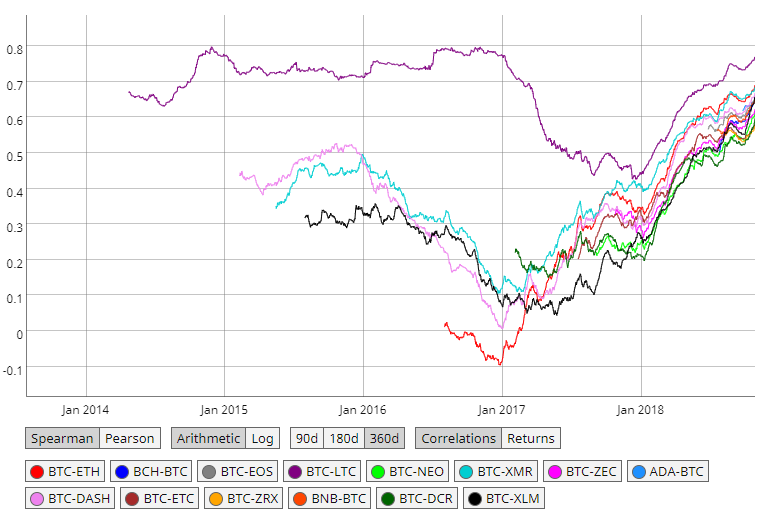 Spearman correlations of daily returns over a 360 day period from Coinmetrics
However, when observed over a smaller time frame, correlations can provide a valuable data set during the boom and bust Bitcoin market cycles. This data, when analyzed, paints a picture of repetitive investor behavior and capital flow during volatile market movements.
Using correlation data, the goal for this post was to examine the strength of these correlations in 2018, patterns from previous market cycles, and if correlations can be used as a market indicator.
The 2018 bear market to date has resulted in cryptoasset correlations which are positively correlated across the board. As of today, correlation values currently range from 0.7 to 0.8 on average.
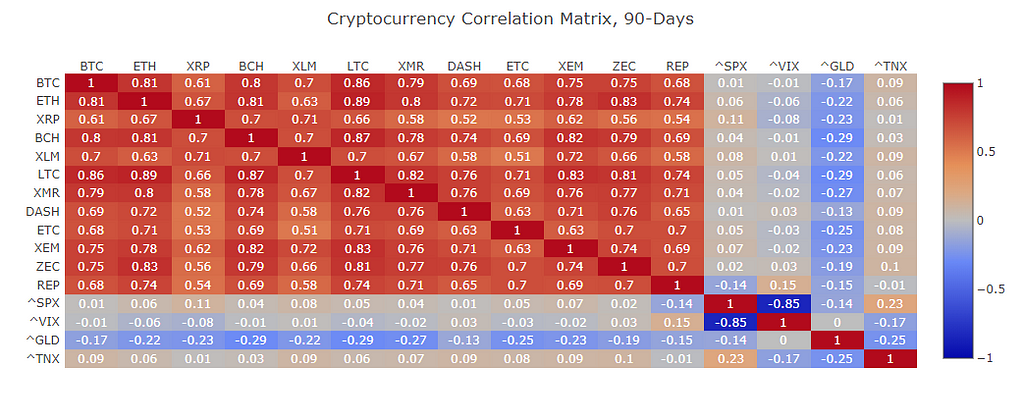 90 day correlation matrix from Sifr Data
This wasn’t always the case. Correlations between cryptoassets rose quickly as the market reversed from bull to bear in January 2018. Cryptoassets continued to increase their strong correlations throughout the first half of the year.
For the analysis, Bitcoin was used as the underlying cryptoasset to track correlations against. This was done for a number of reasons including:
- The interdependence of cryptoasset currency pairs and Bitcoin. Due to the current state of cryptoasset exchanges, most cryptoassets are pegged to Bitcoin or have pairs which are derivatives of Bitcoin.
- Bitcoin currently has a 54% of market share, or ‘market dominance’. This exact number should be taken very lightly as market dominance is a very gameable metric.
- The 24 hour daily market volume is dominated by Bitcoin which currently at $3.05 billion, or 52% of the total volume.
- Bitcoin is the most widely purchased cryptoasset with fiat on popular exchange on-ramps. The majority of cryptoasset investors purchase Bitcoin with fiat pairs and then continue to purchase other alts paired to Bitcoin once inside the cryptoasset ecosystem. During bear markets, these same investors capitulate back into Bitcoin then fiat.
- Bitcoin is fundamentally the most sound cryptoasset that is defaulted upon by the majority of investors. Its evident by the the market weight it carries and also its network strength over the years.
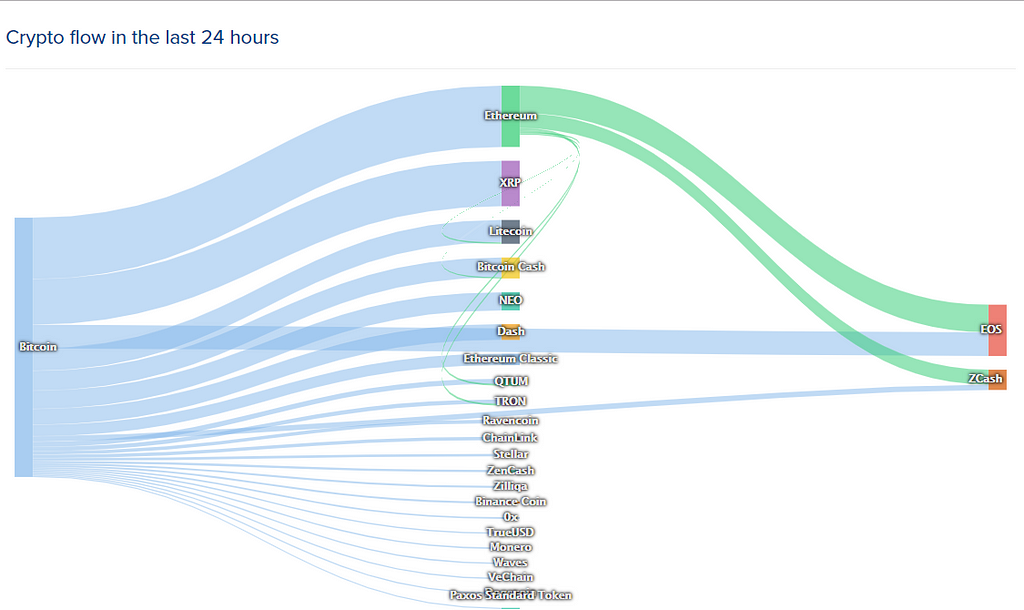 Crypto money flow in the past 24 hours from Coinlib. Bitcoin serves as the underlying peg for many cryptoasset pairs.
Correlation and market data was sourced from Coinmetrics (API and correlation tool) and Nomics.
2018 Correlations
Data Setup
The 2018 correlation data below was split into seven phases from 1/6/2018 to 8/18/18. Each phase has a duration of twenty five days and a Bitcoin price volatility of at least plus or minus 20%. These volatile time frames were used to help analyze how other cryptoassets reacted to Bitcoin’s sharp movements. I also chose to use this method hoping it would provide a high level overview and keep this post as concise as possible.
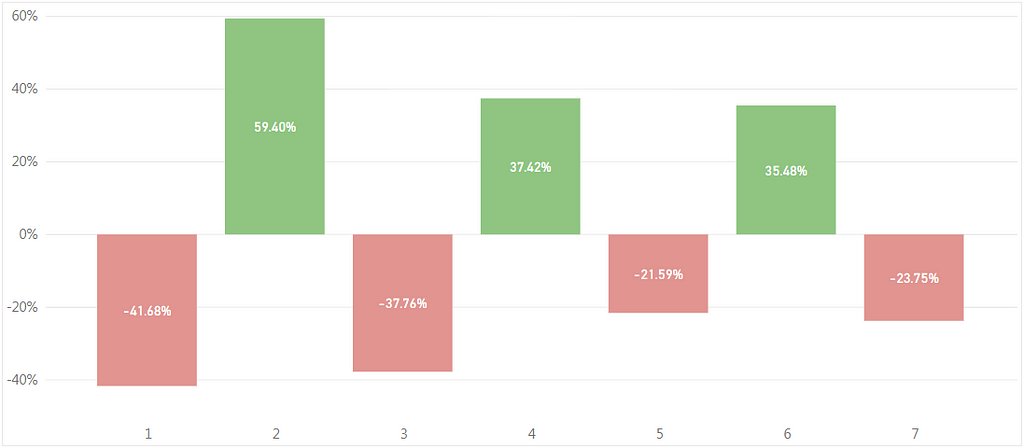 Bitcoin ROI for the 7 phases used in the analysis
The fourteen cryptoassets used in this analysis when studying the correlation or “coupling” to Bitcoin: ETH, BCH, EOS, LTC, NEO, XMR, ZEC, ADA, DASH, ETC, ZRX, BNB, DCR, and XLM. These cryptoassets will be referred to “group 1” for the analysis. The correlations values represent the spearman correlations of daily returns over 90 days.
Note: These assets were selected based on network value and liquidity (liquidity is a loose term here). The majority of these assets fall in the top 15 on “ranking” lists.
Correlation value overview from Sifr Data:
Correlation amongst assets is the degree to which they move in tandem. The values range between -1 and +1, where a value of -1 means that the returns move in opposite directions (e.g. BTC up 0.2% and ETH down -0.2%) and a value of +1 means the returns move in the same direction (e.g. BTC up 0.2% and ETH up 0.2%). A value of zero denotes no (linear) dependence between the assets. The results can be interpreted as follows:
0.5 to 1: Strong positive relationship0.3 to 0.5: Moderate positive relationship0.1 to 0.3: Weak positive relationship-0.1 to 0.1: No linear relationship-0.1 to -0.3: Weak negative relationship-0.3 to -0.5: Moderate negative relationship-0.5 to -1.0: Strong negative relationship
2018 Bear Market Beginnings
On Bitfinex, Bitcoin’s price reached an all time high of $19,897 on 12/17/07. It fell as low as $10,700 in the next ten days then rose again to $17,527 on January 6, 2018. This is when the phase 1 of the analysis begins.
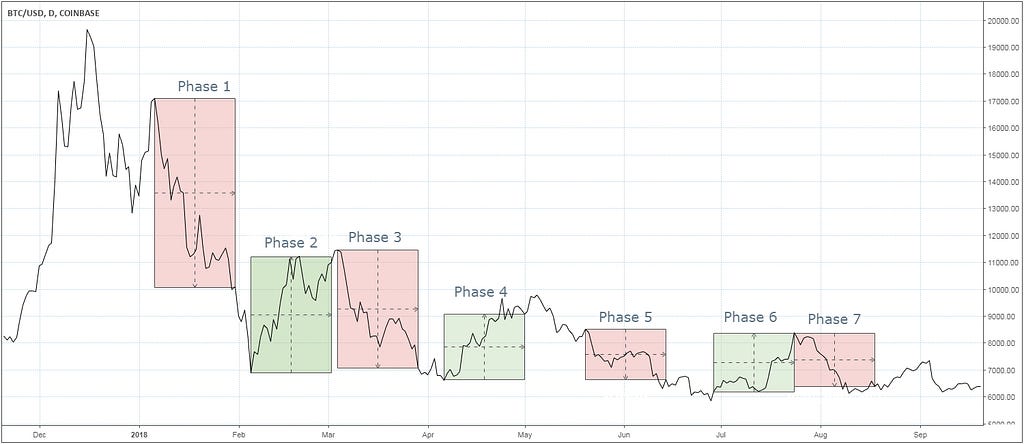 Bitcoin price chart with the 7 phases highlighted
Using the Coinmetrics correlations of daily returns charting tool, the group 1 correlations were charted with the seven phases highlighted. Just prior to 2018, the majority of these assets were negatively correlated with Bitcoin or at best, weakly correlated. From January 2018 onward, correlations rose at an increasing pace in phases 1–3 and plateaued from phase 4–7.
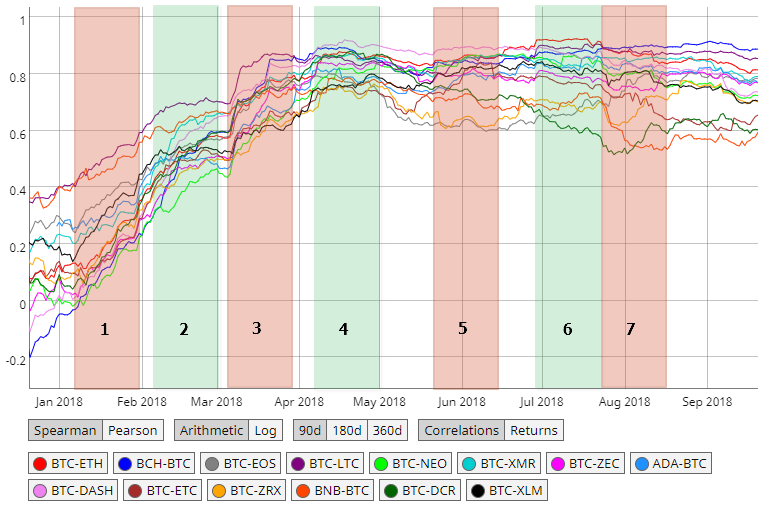 Group 1 spearman correlations of daily returns over a 90 day period from Coinmetrics
Some initial observations:
- In 2018, the correlations between the entire market and Bitcoin sharply increased. This was especially the case during phase 1 when correlations increased at the fastest pace, confirming the market reversal.
- There is a relationship between the rate of change between Bitcoin’s price and its correlations to other cryptoassets.
- The “Bitcoin is losing its market dominance” narrative carries little weight. Cryptoasset correlations to Bitcoin are at an all time high in 2018. The market follows Bitcoin.
- Despite low trading volumes, the market volatility still exists. It’s good to be Arthur Hayes in 2018.
- The entire cryptoasset market has been becoming more and more correlated over the years. A smaller time frame, 90 days in this analysis, is a more helpful when looking at volatile market cycles.
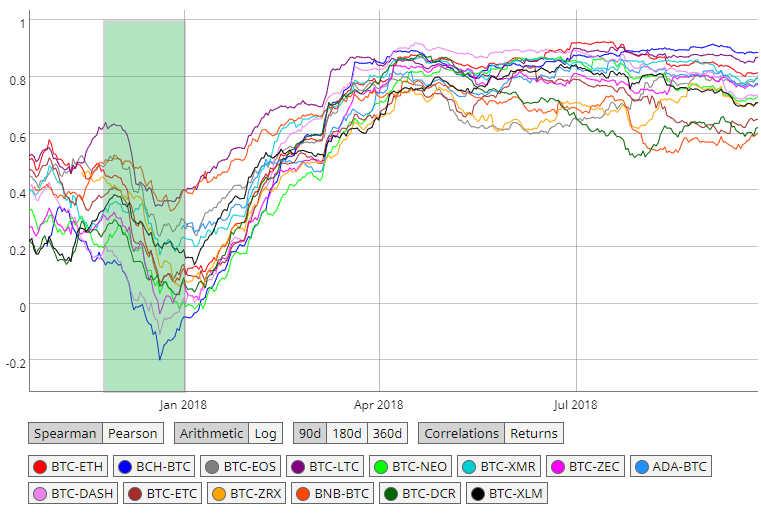 Group 1 spearman correlations of daily returns over a 90 day period. Correlations during the bull market just prior to the 2018 bear market are highlighted.
Phase 1
The chart below displays the change in correlation values from phase 1 to the end of phase 7. Every single cryptoasset in group 1 has seen a significant increase in its correlations to Bitcoin, most by a factor of 3x or more.
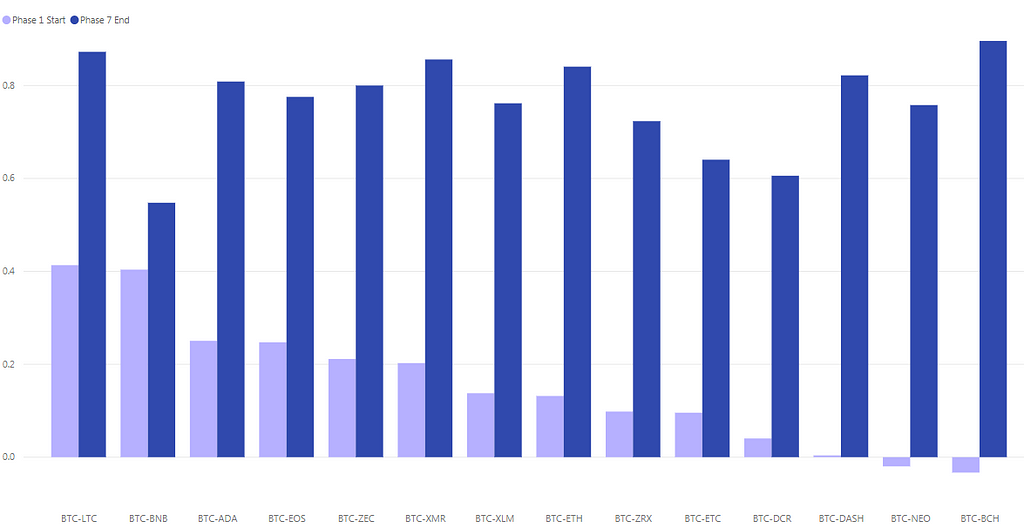 Group 1 correlations to Bitcoin at during phase 1 and phase 7
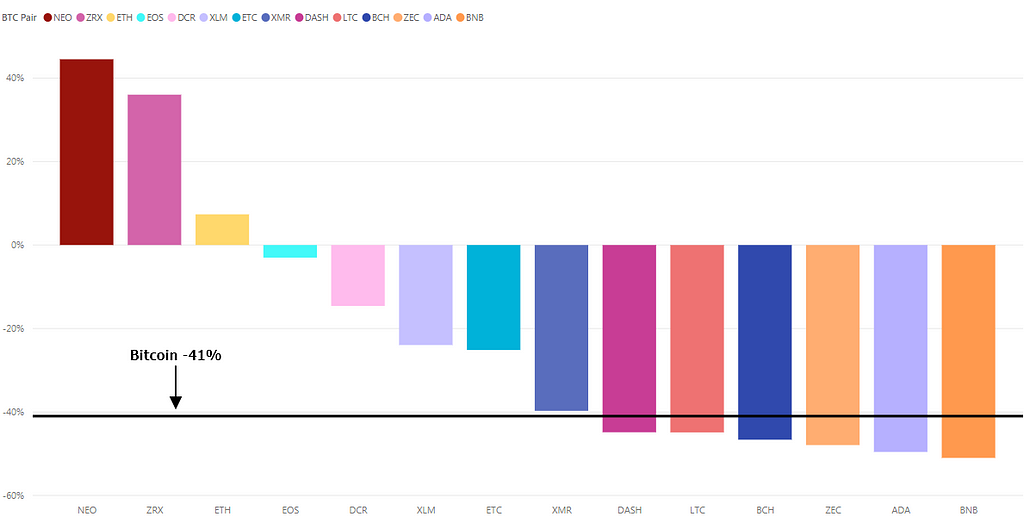
The price of Bitcoin decreased from $17,527 to $10,221 during phase 1, or -42%. This resulted in a rapid increase in correlations between the group 1 assets and Bitcoin. Correlations to Bitcoin tightened at the highest pace during this phase. Excluding a few outliers, the assets in group 1 (and majority of the cryptoasset market) not only fell in price but started a new trend of coupling with Bitcoin. A few assets from group 1 coupled at a much higher rate than others.
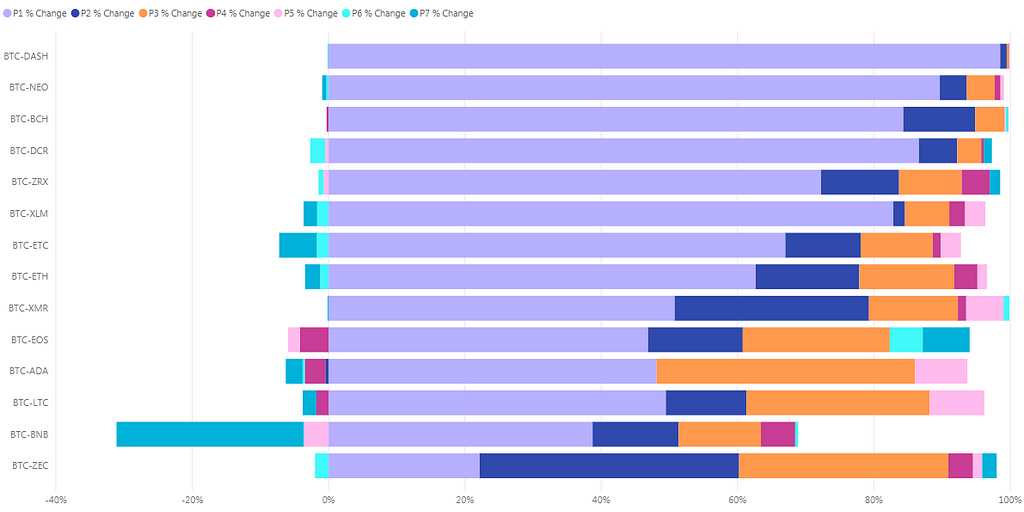 Group 1 correlations of daily returns over a 90 day period increased the most during Phase 1
NEO, ZRX, DCR, EOS, and ETH were some assets from group 1 that showed lowest correlation to Bitcoin just prior to the start of the 2018 bear market. Coincidentally, they performed the best in terms of ROI and coupled with Bitcoin at a much faster pace during phase 1.
The BCH and DASH numbers are interesting. BCH was the asset least correlated to Bitcoin coming into phase 1. A low correlation to Bitcoin typically boded well for other assets in terms of ROI. However, the price of BCH falls 44% and it increases its correlation to Bitcoin by 816%. DASH, the second least correlated asset to Bitcoin prior to phase 1, falls 44% and increases its correlation to Bitcoin by 7661%. These two outliers are not completely surprising considering the manipulation that occurs in their market and network.
Eight out of the fourteen cryptoassets in group 1 had a better ROI than Bitcoin during this phase.
Phase 2 to 4
From phase 2 to 4, the cryptoassets in group 1 continue strength their correlations with Bitcoin. By phase 4, April 2018, correlations between the group 1 cryptoassets and Bitcoin hit levels that have never been seen.
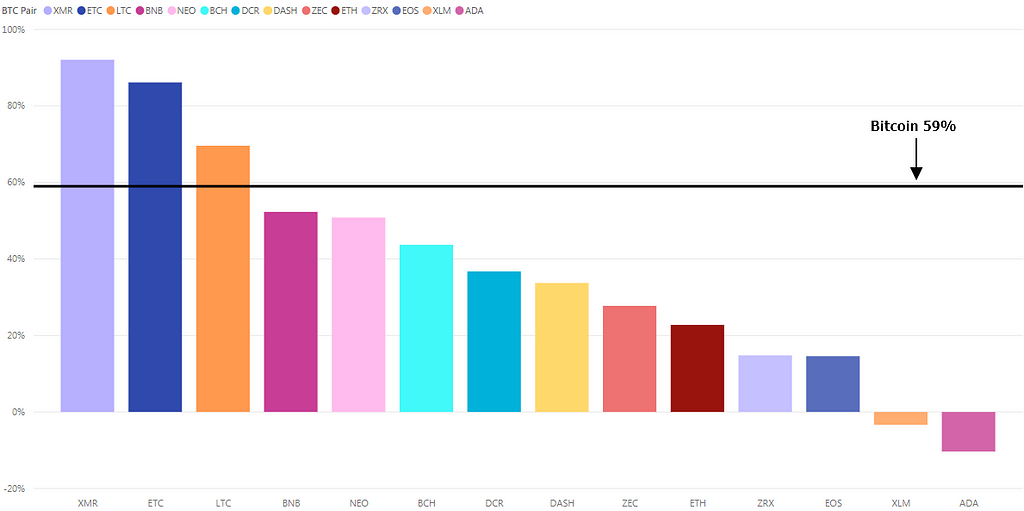
In phase 2, the price of Bitcoin increased from $6,995 to $11,086, or 59%. Correlations between all cryptoassets in group 1 continue to strengthen at high rate. Correlation values for the cryptoassets in group 1 now range from 0.4 to 0.7. BCH and DASH continue to couple to Bitcoin at a much faster pace than the rest of the assets in group 1. They have an increase in correlations of 102% and 74% from phase 1 to phase 2, respectively. ADA, BNB, and XLM were on the opposite end, having the smallest change in correlations during phase 2.
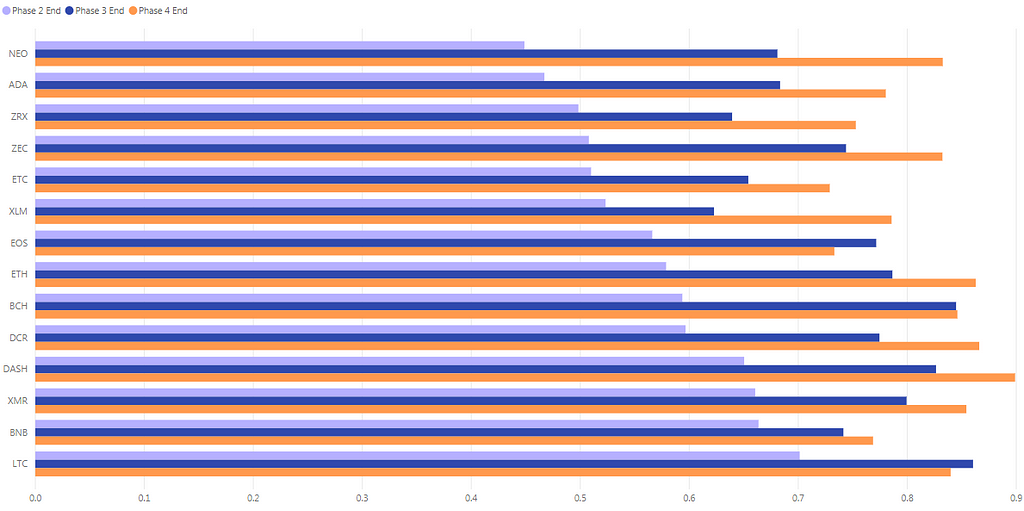 Correlation values at the end of phase 2, 3, and 4.
Three out of the fourteen cryptoassets performed better than Bitcoin in terms of ROI during this phase. ADA and XLM are well below the average ROI.
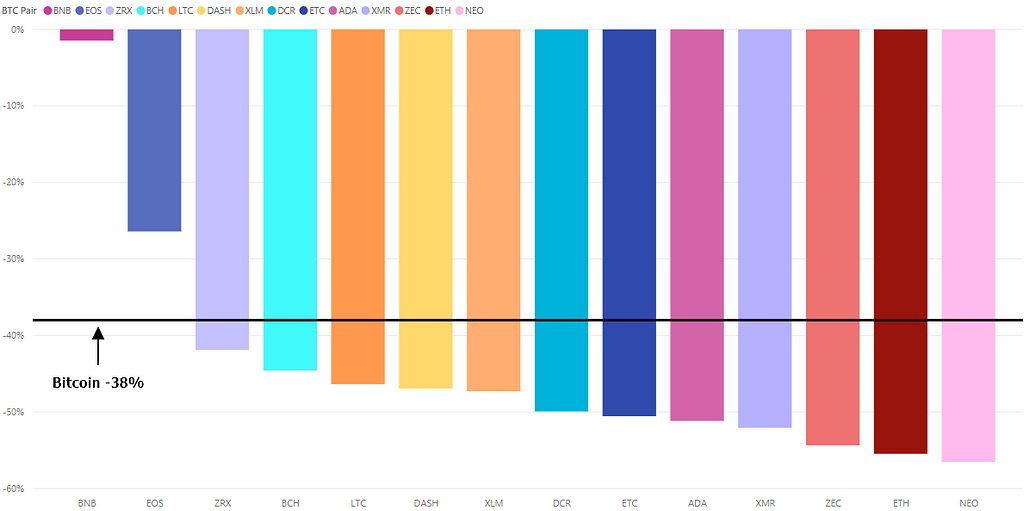
In phase 3, the price of Bitcoin decreased from $11,512 to $7165, or -38%. This price swing comes after a 59% increase during phase 2. The coupling to Bitcoin trend continues during this phase as most cryptoassets in group 1 see an increase in correlation to Bitcoin by 30–40% on average. The cryptoassets from group 1 are becoming tightly correlated with Bitcoin after 3 phases of continued coupling. The correlation values range from 0.62 to 0.84 at the end of phase 3. BNB and XLM have the lowest correlation values among the assets in group 1.
Only two out of the fourteen cryptoassets perform better than Bitcoin in terms of ROI in phase 3: BNB and EOS.
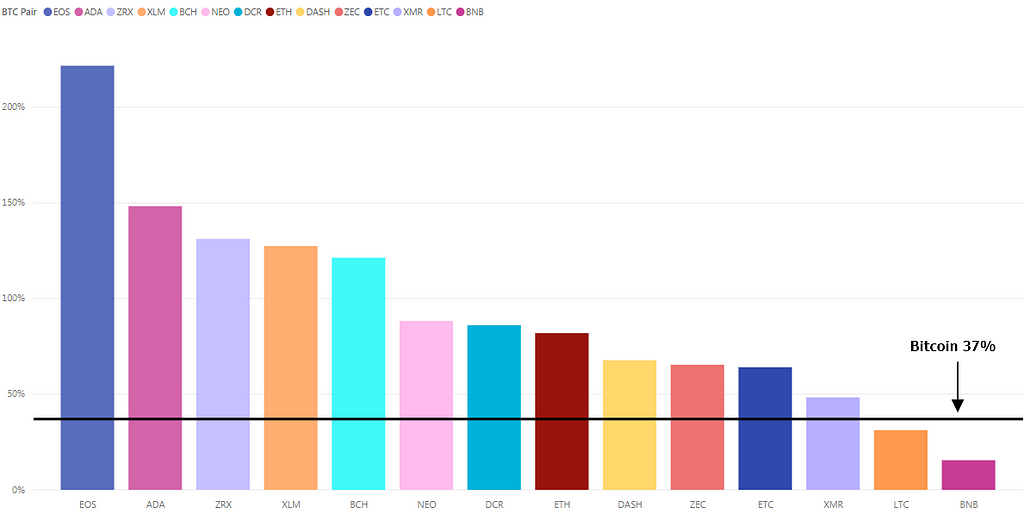
In phase 4, The price of Bitcoin increased from $6,636 to $9,119, or 37%. The majority of the cryptoassets in group 1 continue to couple with Bitcoin but at a much slower rate when compared to phases 1, 2, and 3. As seen in the coinmetrics chart below, correlations reach all time highs. The correlation values range from 0.73 to 0.9 at the end of phase 4.
The rapid coupling with Bitcoin has ended and now begins a slow, grinding trend sideways with lower volatility in correlation changes.
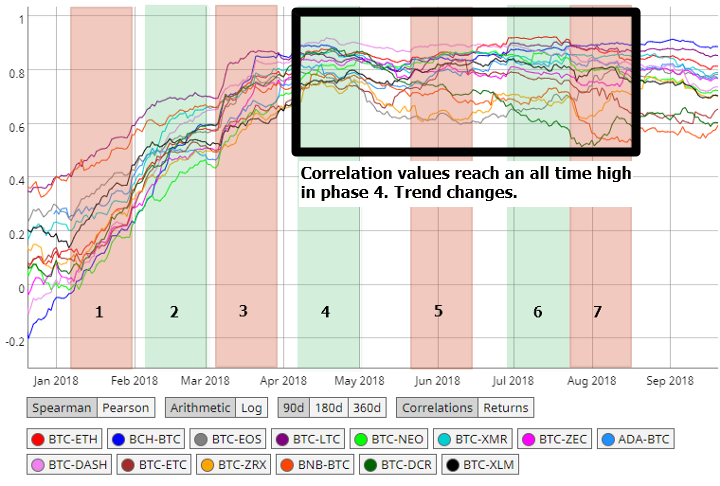 Correlations from phase 4–7 start to plateau
Interestingly enough, this correlation trend reversal resulted in a much higher ROI for cryptoassets in group 1 during this phase. Twelve out of the fourteen cryptoassets in group 1 had a better ROI than Bitcoin.
Phase 4 had the highest market volatility when compared to the other six phases. This coincided with the overall correlation trend shift from rapidly increasing to plateauing.
EOS, ADA, ZRX and XLM were the outliers in phase 4 that saw a returns ranging from 100-220%. Below are some events that contributed to this:
- ZRX: Paradex acquired by Coinbase (but no mention of using the ZRX token), Coinbase announcing institutional custody support and retail exchange listing. ZRX consistently outperforms the rest of the assets from group 1 here on out.
- EOS: Main net launch on 5/1/2018
- ADA, XLM: Similar to ZRX, Coinbase custody and retail exchange listing announcements.
- A false “alt-season” breakout may have led to further FOMO.
Below is a chart graphing the ROI for phases 2, 3, and 4 with respective correlation values (end of phase 4).
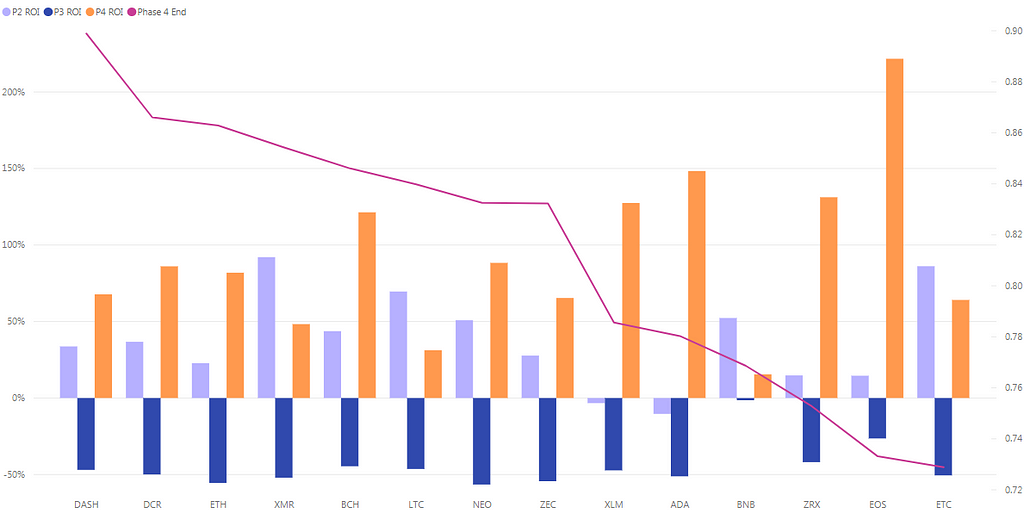 Phase 2, 3, 4 ROI and Phase 4 correlations
Phase 5 to 7
Correlations continue a sideways trend in phases 5 to 7, or June to August. The average correlation value in these phases is 0.7, with some cryptoassets high as 0.9.
ZRX, DCR, BNB, and ETC were the outliers, showing signs of decoupling at the end of phase 7.
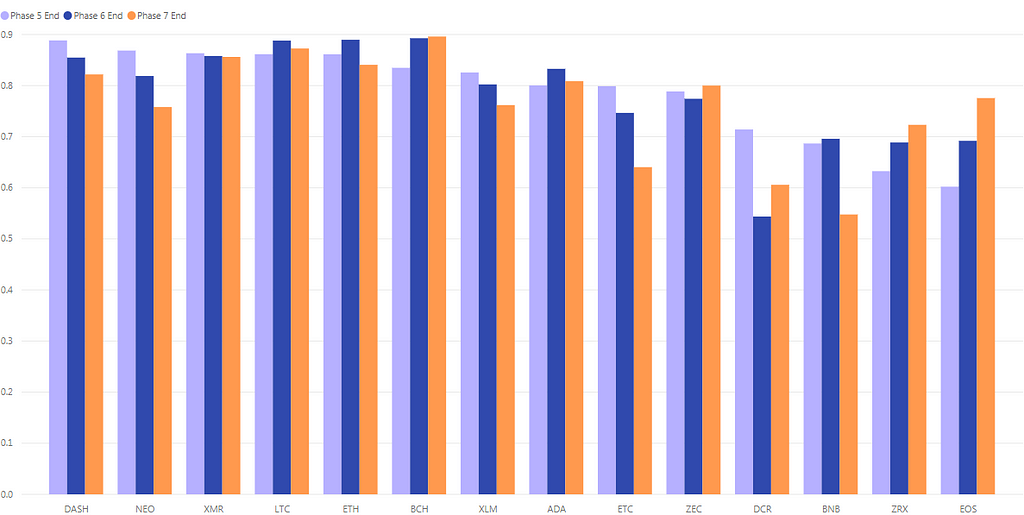 Correlations at the end of phase 5, 6, and 7.
The Bitcoin price movements in each phase:
- Phase 5:Bitcoin decreased from $8,513 to $6,675, or -22%.
- Phase 6: Bitcoin increased from $6,218 to $8,424, or 35%.
- Phase 7: the price of Bitcoin decreased from $8,424 to $6,432, or -24%.
Continuing with the overall ROI trend, with the exception of phase 4, Bitcoin outperforms the majority of the cryptoassets from group 1. This can be also seen with the entire cryptoasset market as “altcoins” have lower lows and Bitcoin regains market share.
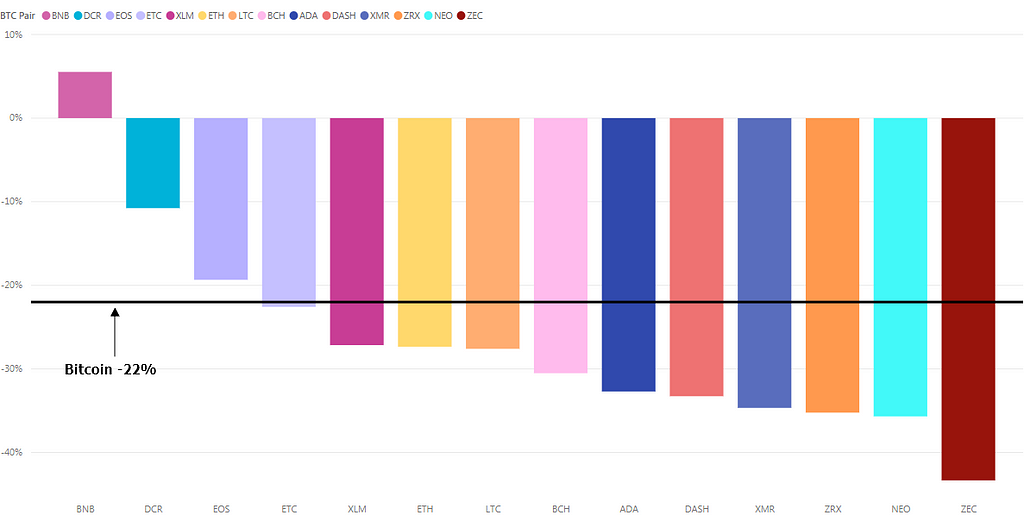 Phase 5 ROI
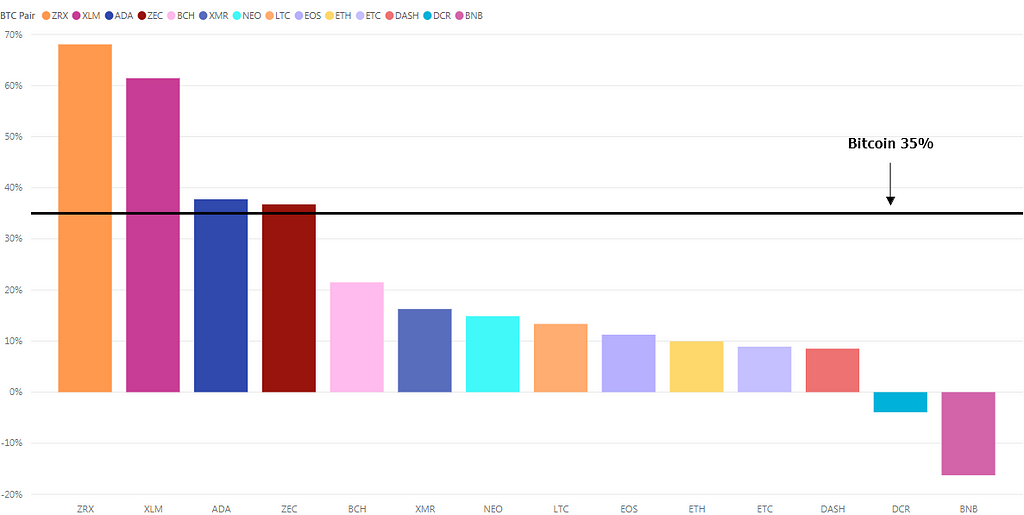 Phase 6 ROI
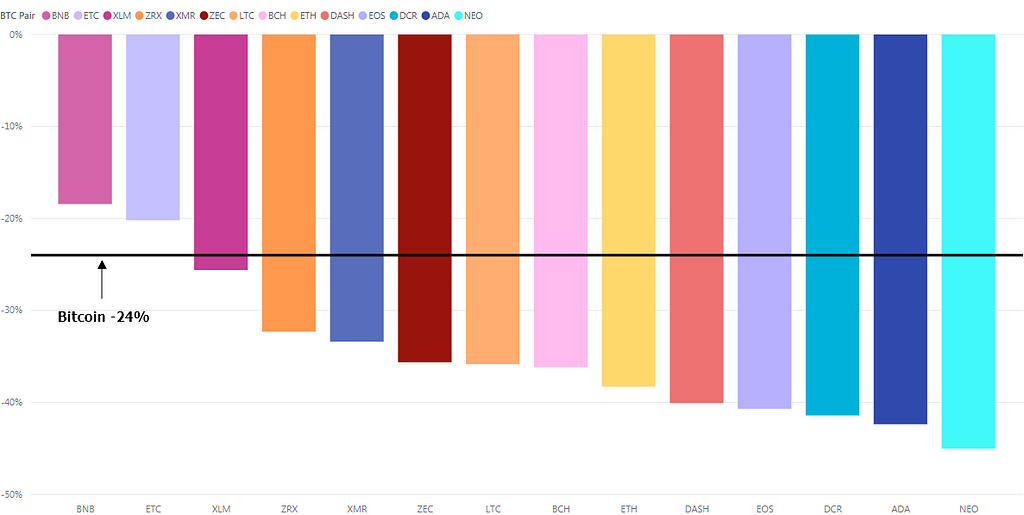 Phase 7 ROI
BNB was one asset in particular that was a “safe haven’ during the bear market. It had the lowest price volatility throughout the study.
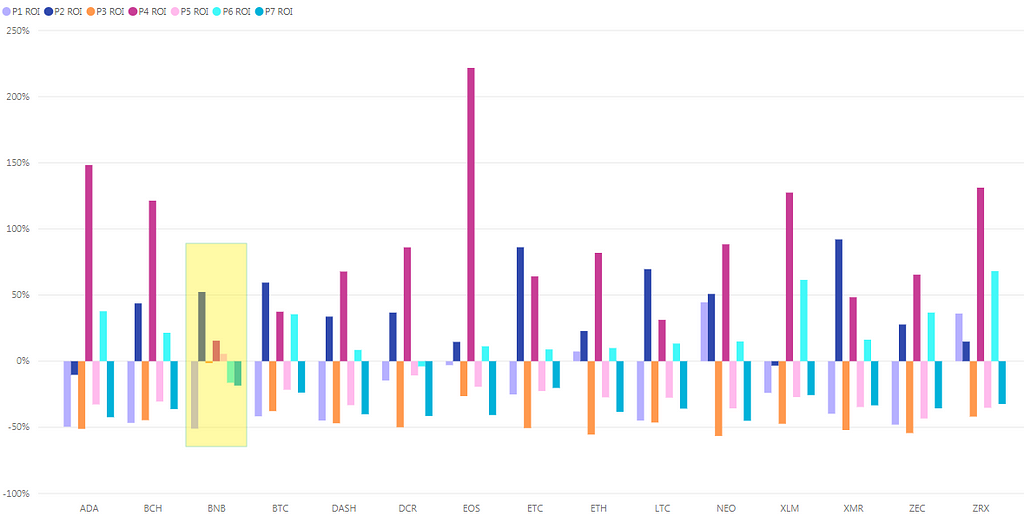 Phase 1–7 ROI. BNB was the least volatile asset in the first half of 2018.
Phase 1–7 Summary
A few observations from the first half of 2018, or phases 1–7:
- Just prior to the 2018 bear market, the majority of cryptoassets had either no correlations to Bitcoin or were negatively correlated (90 day returns).
- Cryptoassets coupled with Bitcoin at an incredible rate during Phase 1 (Jan 6–31). The bear market begins.
- Correlations between cryptoassets and Bitcoin continue to increase at a rapid pace from Phase 1–3 (January to April).
- In Phase 4 (April), the correlation trend changes and sideways movement emerges. A few cryptoassets begin to decouple slightly. This continues into phase 7.
- With the exception of phase 4, Bitcoin consistently out performs the majority of the cryptoasset market.
- BNB and ZRX were a few assets that held low correlations to Bitcoin throughout the analysis. Funds had the ability to weight their portfolios with these assets to reduce risk in 2018 (and beating the market by a large margin).
- Cryptoasset correlation patterns during the 2018 bear market are similar to ones in the past. Correlations spike upward at the beginning of a market reversal, bull to bear, and remain tightly correlated to Bitcoin until the next bull run.
Today
As the bear market continues into the end of October, the majority of the group 1 correlations to Bitcoin begin to slowly decrease. A few cryptoassets begin to decouple faster than others: BNB, ZRX, ETC, and DCR. It’s not certain whether this overall downward trend will continue or not, but it should bode well for the market if it does. More on this below.
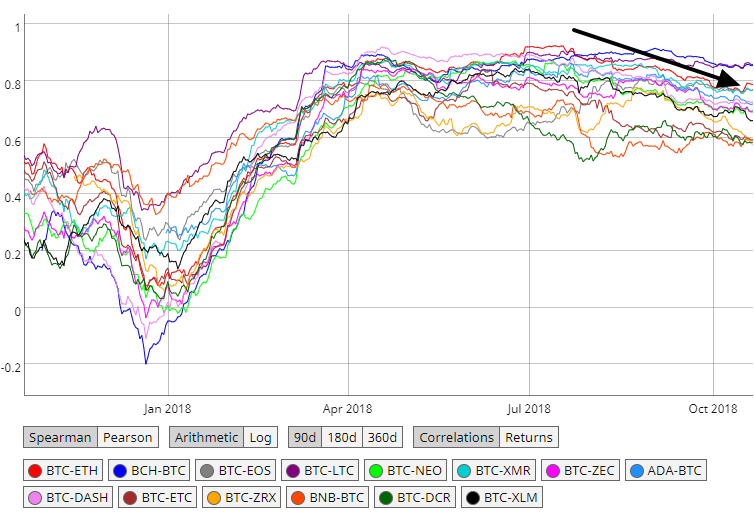 90 day correlations going into October 2018
Similar to bear markets in the past, Bitcoin continues out perform the majority of the cryptoasset market, currently down 68% from its all time high. Year to date, Bitcoin is -53%.
The bubble chart below displays correlation values and year to date ROI. Bubble size is set to ROI from 1/1/2018 to 10/22/2018.
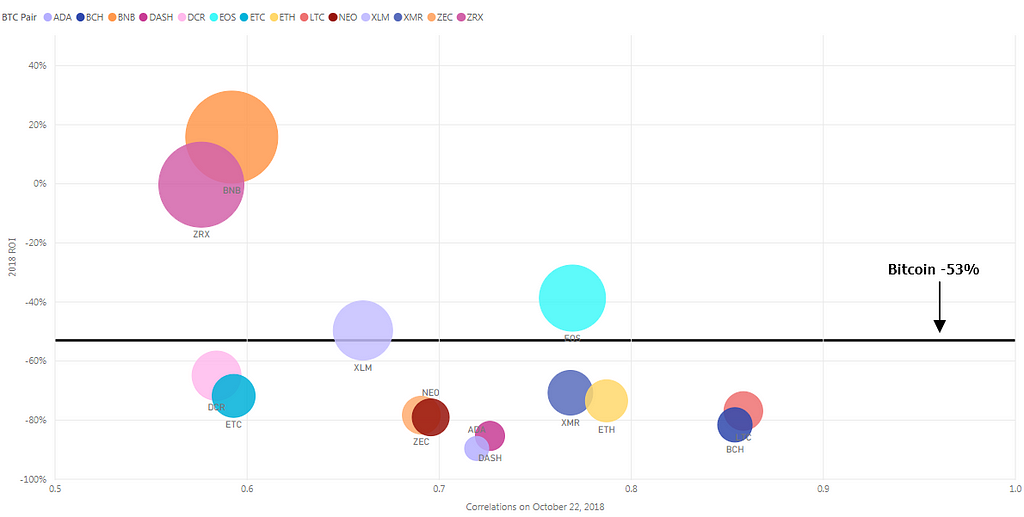 Correlation values and 2018 ROI as of 10/22/2018
Correlations as a market indicator
Can correlations be used as a market indicator? Maybe.
Dating back to 2016, when most of the alt coin market emerged, correlation movements coincide with bull and bear market trends. Market reversals are typically met with upward or downward spikes in correlations between cryptoassets and Bitcoin.
The majority of cryptoassets generally reach levels of little to no correlation with Bitcoin during market rallies.
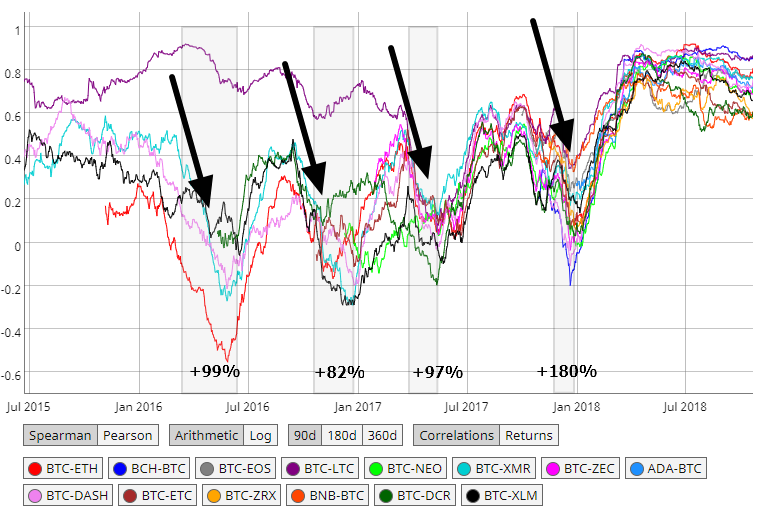 Correlations from 2015 to 2018
The historical data shows that bear market reversals are typically followed by a sharp decrease in correlations. For the current bear market, this would entail capital flowing back into alt coins at a rapid pace, decoupling their returns from Bitcoin. Correlations trending downward should be a positive indicator that the market may be heading into a different cycle.
Depending on the time frame, historical thresholds can be applied to view when correlations enter ranges that have typically lead to Bitcoin market runs. Using shorter time frames, 90 days at the minimum, will provide more clarity as the overall cryptoasset market is becoming strongly correlated in the bigger picture. One of the reasons I used 90 days as the time frame for this analysis was for the ability for those interested to track correlations on their own via the excellent coinmetrics tool. For even shorter time frames, use the formula option on the charts page.
For my own analysis, I’ve been tracking cryptoasset correlation trends on a Twitter thread that you can follow here.
body[data-twttr-rendered="true"] {background-color: transparent;}.twitter-tweet {margin: auto !important;}
A bear reversal, based on historical data, would need correlations at this range in green. That's a decrease of about 35% from today. This doesn't mean alts down or up, just the strength in correlation with $BTC down.
Using correlations as an indicator does come with drawbacks. A few reasons correlation patterns may eventually change:
- The stable coin mania. An increase in stable coin-cryptoasset pairs on exchanges should eventually allow investors an alternative for buying cryptoassets pegged to BTC. Investors who may have had low confidence in stable coins such as USDT have many more options now.
- Exchanges adding fiat pairs. Coinbase and Bittrex are examples of large exchanges who have recently introduced additional fiat support. Investors have the ability to buy cryptoassets pegged to local fiat as regulatory clarity allows exchanges the ability to work with banks.
- Outlier data. There will always be outliers that skew data points on events such as network launches, upgrades, forks, exchange listings, regulatory announcements.
- Investor sentiment. Correlation trends could change if the majority of investors lose faith in public ‘blockchains’ by realizing many of them offer no real world utility. This seems unlikely in the short term as investors continue to be unaware of the real value behind most alt coins (read: blockchain is a semantic wasteland by Nic Carter).
- Regulation. ICO’s will eventually have to face regulatory scrutiny which may lead to their token being delisted from exchanges. This is already happening. Correlation patterns will be affected if retail investors and funds cannot trade smaller, somewhat liquid, tokens.
In summary, cryptoasset correlations to Bitcoin can provide an insight into the overall market behavior. The correlation values between cryptoassets and Bitcoin have been increasing over the past few years but when using smaller time frames they can be useful to visualize where the capital is flowing during market cycles. From 2016 to date, similar correlation patterns are observed during bull and bear markets.
Correlation analysis can extend to on-chain data. Payment count, difficulty, hashrate and transaction fees are examples of metrics that can be further analyzed. An example of an interesting on-chain observation: Bitcoin and Ethereum currently have a very different relationship between their price and hashrate/difficulty.
As the case with any potential cryptoasset market indicator, correlations are only a supplement to technical and fundamental analysis. Although Bitcoin has existed for a decade, many of the alt coins have emerged recently. This leads to a small data set to observe but it will be interesting to monitor going forward.
I’ll continue to tweet correlation data and follow up with an analysis on Medium in a few months.
For further reading: NVT ratio and signal, market value to realized value (MVRT), network momentum, halving predictions, velocity analysis, and the Mayer Multiple provide unique analysis on Bitcoin’s current value and bear market predictions.
Follow me on Twitter @blockchainjoy
Cryptoasset Correlation Analysis: 2018 Data and Historical Trends was originally published in Hacker Noon on Medium, where people are continuing the conversation by highlighting and responding to this story.
Disclaimer
The views and opinions expressed in this article are solely those of the authors and do not reflect the views of Bitcoin Insider. Every investment and trading move involves risk - this is especially true for cryptocurrencies given their volatility. We strongly advise our readers to conduct their own research when making a decision.
