Latest news about Bitcoin and all cryptocurrencies. Your daily crypto news habit.

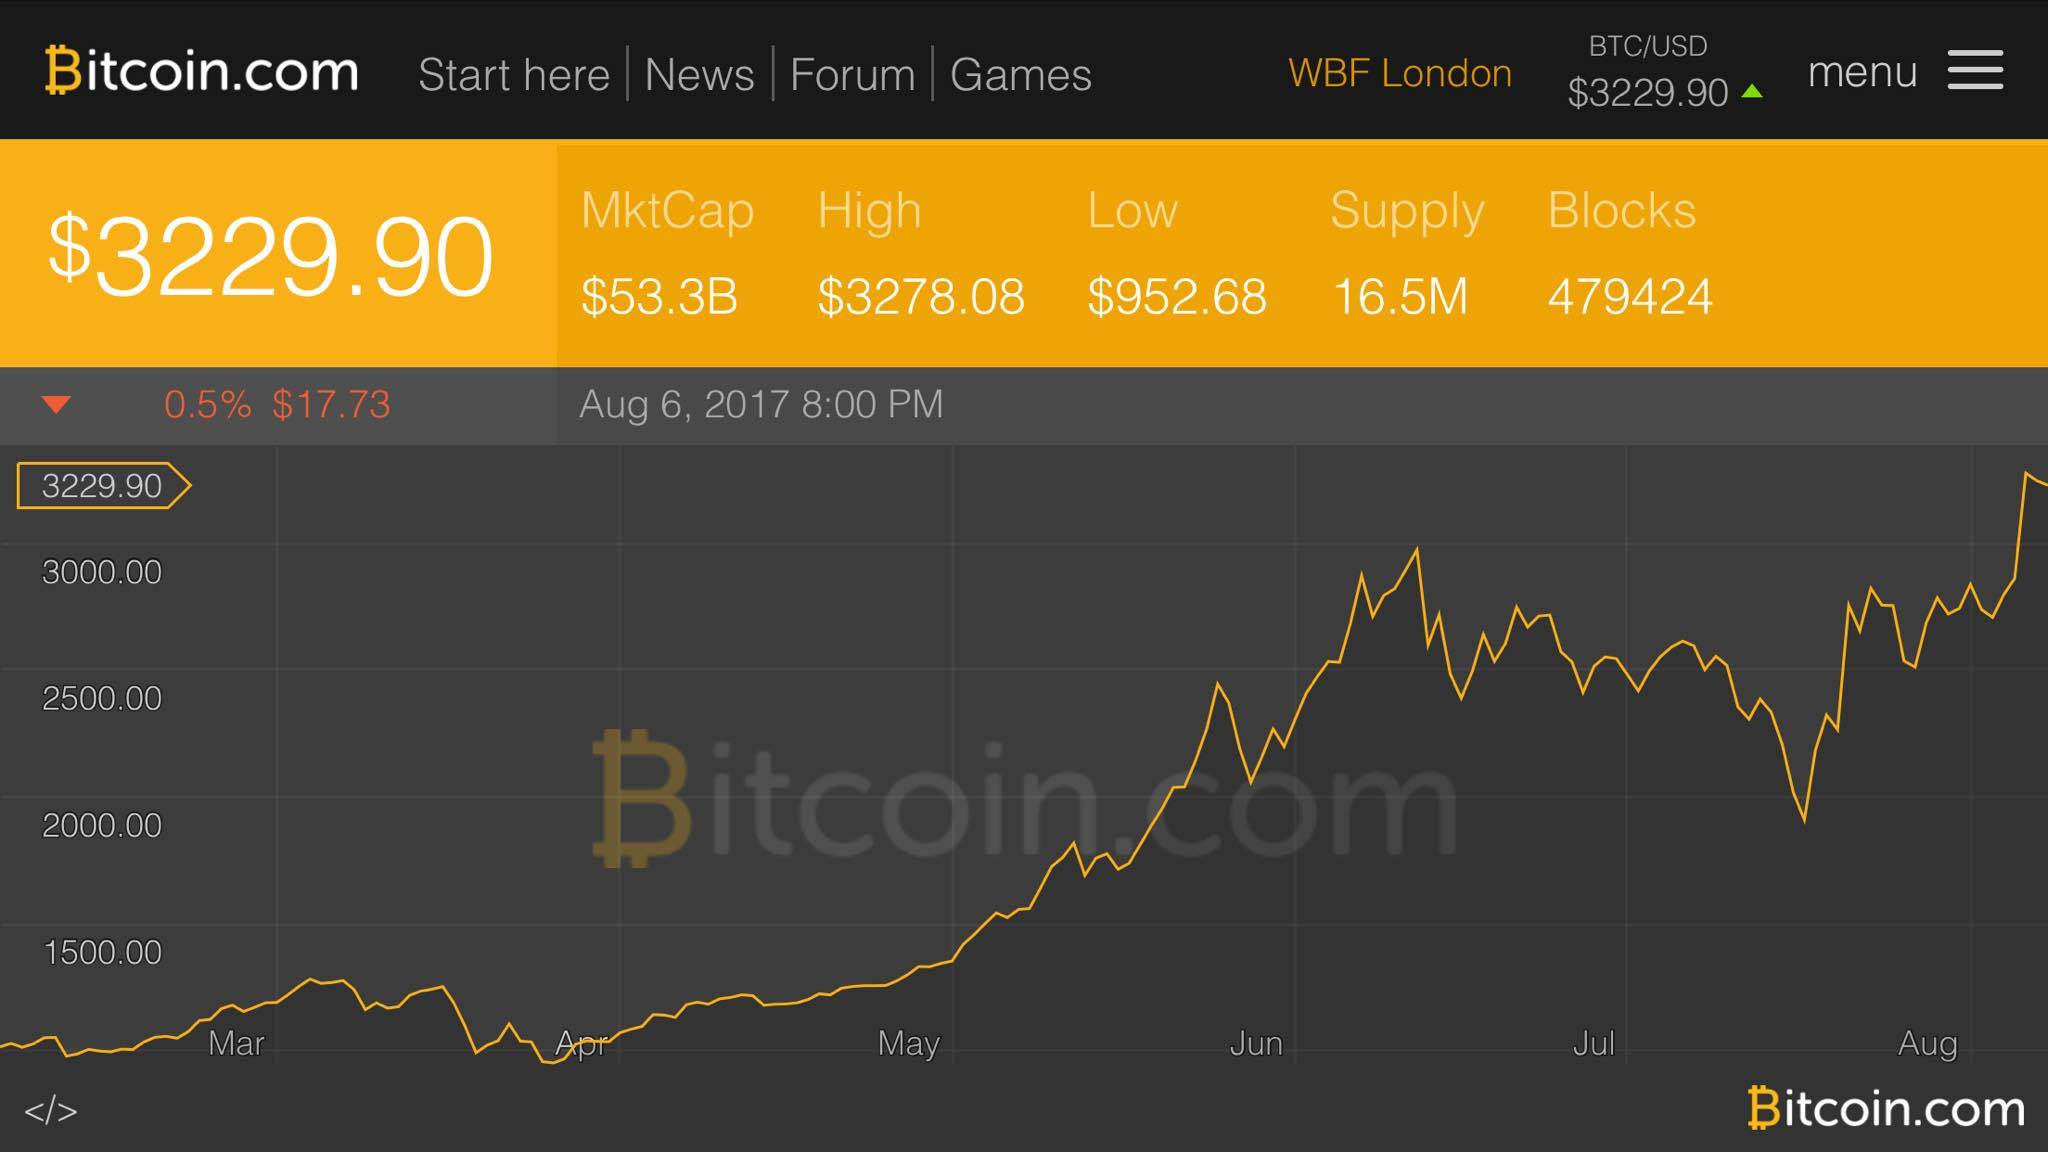
Our last markets update revealed bitcoin’s price was extremely bullish, testing the US$2700-2800 range just before the blockchain split on August 1. Since then a whole lot has changed as the price per BTC has skyrocketed past the $3K zone and is currently hovering above $3200.
Also read: The Evolution of Cryptocurrency Visuals, Memes, and Bitcoin Street Art
Bitcoin Now Commands a $52 Billion Market Capitalization
The past seven days was an interesting, and a very unusual week for bitcoin investors and enthusiasts. On August 1 the Bitcoin blockchain split into two branches forming another network and token called bitcoin cash (BCH). At the time some bitcoiners assumed the price was going to drop heavily after the hard fork. However, the price did not budge at all as it continued to command a $2700 per BTC value following the split.
Three days later, on August 3, bitcoin bulls began to rally hard breaking the key $2800 resistance barrier. After this point, history was made on August 5 as bitcoin’s price continued to rise higher and higher. Bitcoin’s value surpassed the $3K zone to an all-time high of $3340 across global exchanges. The currency is swapping $1B worth of BTC trade volume per day and capturing a $52.6B market capitalization at the time of writing. It’s worth noting that before the BCH chain arrived, bitcoin’s dominance was above the fifty percent range, but now even though in the $3200 territory dominance it’s down to 47 percent.
Technical Indicators
Last week many traders believed a downtrend was coming due to the head and shoulders formation taking place just before the fork. However, bitcoin surprised these traders as the currency ascended higher and many futures traders who set ‘short’ positions before the fork likely got burned. At press time the 100 Simple Moving Average (SMA) is well above the long term 200 SMA indicating the bullish momentum should continue. In the short term, we will likely see some price consolidation before climbing further. Both the stochastic and Relative Strength Index (RSI) show right now there may be some price oscillation for day trading entries. The 24-hour chart shows there should be some price action in the $2300 range as it will be a key resistance point. Moreover, there are sell wall mountains the size of Mt Everest at the $3500 level.
The Top Ten Cryptocurrency Markets
Ever since bitcoin smashed past the $3K price territory, nearly every other cryptocurrency market got a lift except for bitcoin cash. The newly formed bitcoin cash market struggled during its first few days and dropped to all time low of $200 per BCH. However, at press time and after some consolidation, the fourth highest valued bitcoin cash market has rebounded, and the token price is currently testing the $250 zone. The second most valued cryptocurrency market held by Ethereum is also doing very well, as one ETH has jumped to $260 after hovering just above the $200s.
Litecoin, the fifth highest valued market is down roughly three percent as one LTC is $45. The rest of the markets in the top ten are doing well this week with NEM ($0.25), Ethereum Classic ($15), Dash ($188), IOTA ($0.42), and the newcomer NEO at $14 per token.
The Verdict
Currently, bitcoin charts show there’s some profit taking happening right now and some healthy consolidation. Higher prices and new all time highs are possible as the one week, and shorter term charts still look bullish. Although, it is interesting to watch bitcoin’s (BTC) price go south when bitcoin cash (BCH) markets go north, as many speculators believe the opposite effect happened the other day. It’s too early to tell if these two markets will have any correlation with each other over the short and long term.
Bear Scenario: There is some heavy resistance above the $3300 territory at the time of writing. If sellers continue to hammer bitcoin’s price downwards, then a drop to the $3-3100 range could easily happen. Further, a dip under the $3K zone could also be in the cards if bulls start showing exhaustion. Some bulls are already showing signs of stepping off to the sidelines to catch some scalps and breaks. For those looking for some bearish profit-taking watch for consistent bottoms and the RSI going southbound.
Bull Scenario: A few key resistance points to watch will be the $3300-thru-$3500 zones. If bulls can muster up the strength to break these areas, then we could see some smooth sailing close to the $4K range. Fibonacci extensions show scaling to $4K is possible as full extension predicts a $3800-4000 span. At press time there seems to be a flag pattern forming which means we could see further movement after a combination of renewed energy and consolidation.
How do you envision bitcoin’s price movement going forward? Let us know in the comments below.
Disclaimer: Bitcoin price articles and markets updates are intended for informational purposes only and should not to be considered as trading advice. Neither Bitcoin.com nor the author is responsible for any losses or gains, as the ultimate decision to conduct a trade is made by the reader. Always remember that only those in possession of the private keys are in control of the “money.”
Images via pixabay, Bitcoin.com, Coinmarketcap.com, and Bitstamp.
Need to calculate your bitcoin holdings? Check our tools section.
The post Markets Update: Bitcoin Continues to Orbit Above $3K appeared first on Bitcoin News.
Disclaimer
The views and opinions expressed in this article are solely those of the authors and do not reflect the views of Bitcoin Insider. Every investment and trading move involves risk - this is especially true for cryptocurrencies given their volatility. We strongly advise our readers to conduct their own research when making a decision.

