Latest news about Bitcoin and all cryptocurrencies. Your daily crypto news habit.

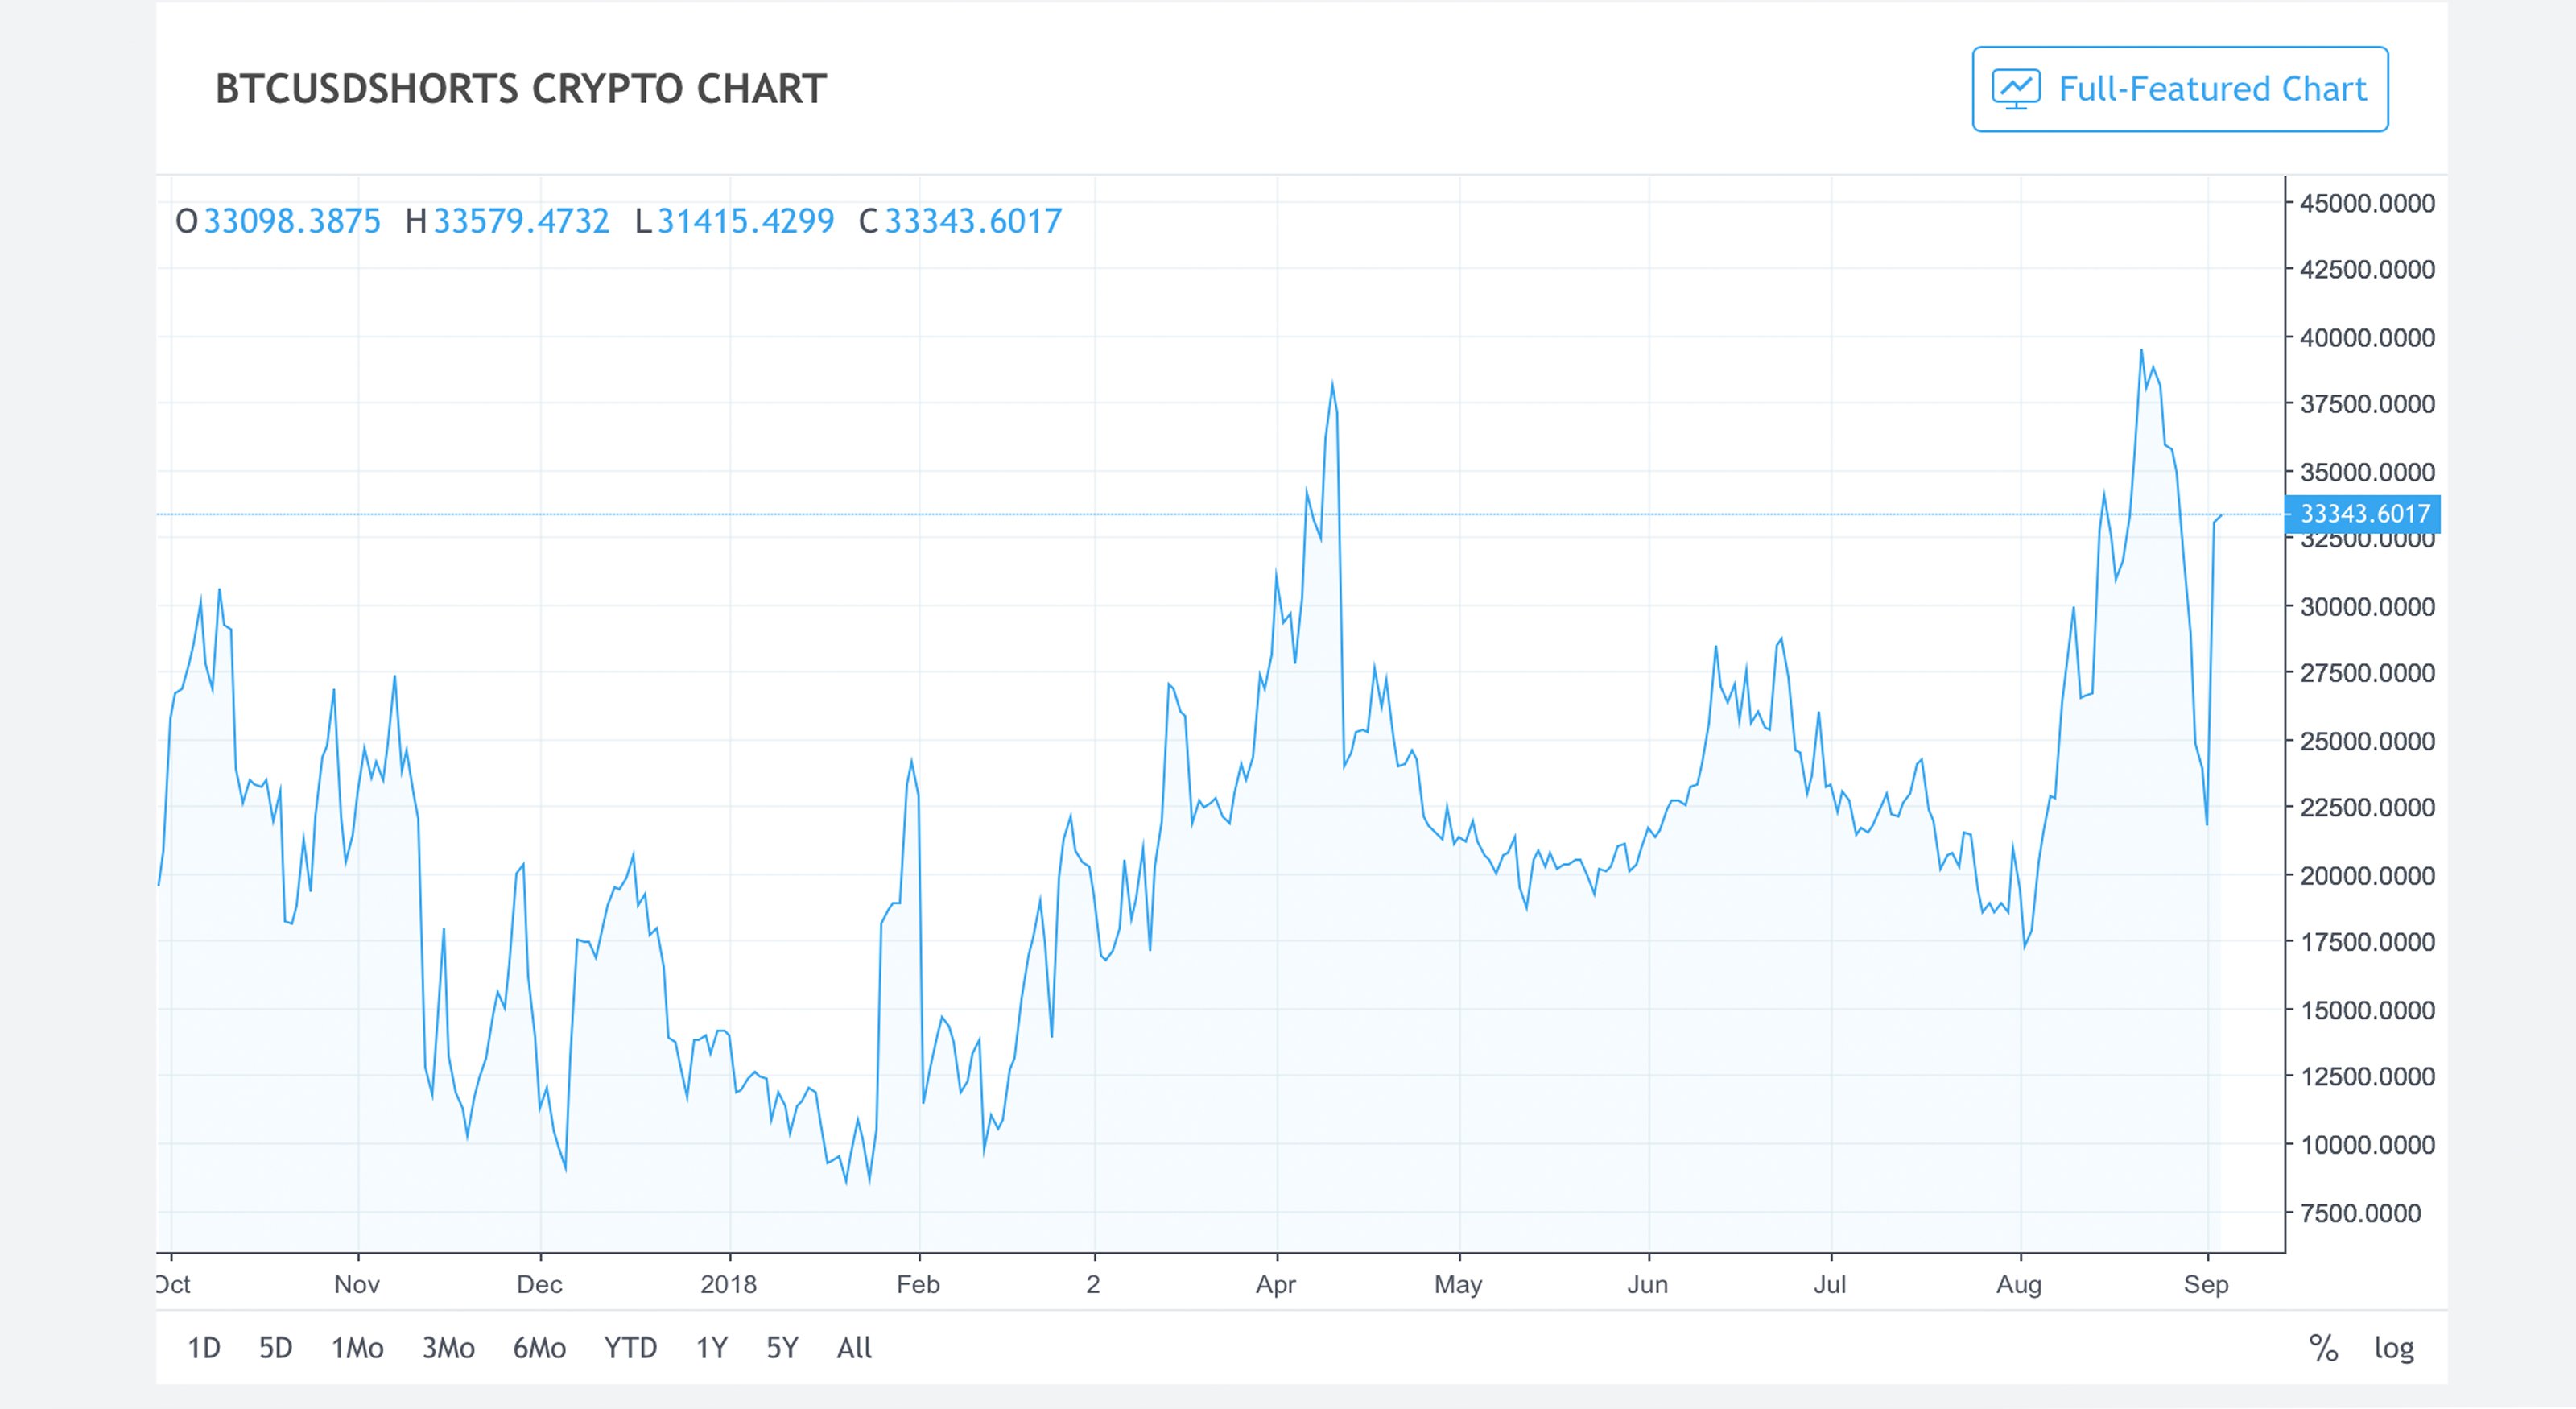
Cryptocurrency markets have shown some strength over the last seven days as many digital assets are up between 3 to 40 percent. At the time of publication, the entire digital currency market capitalization of all 1600+ cryptocurrencies is around $239B USD. The markets look far more optimistic than a few weeks ago but short contracts on Bitfinex order books for BTC/USD future markets in particular is nearing its all-time high once again.
Also Read: New Information Heightens Satoshi Nakamoto Mystery
Cryptocurrency Markets See Some Gains This Week
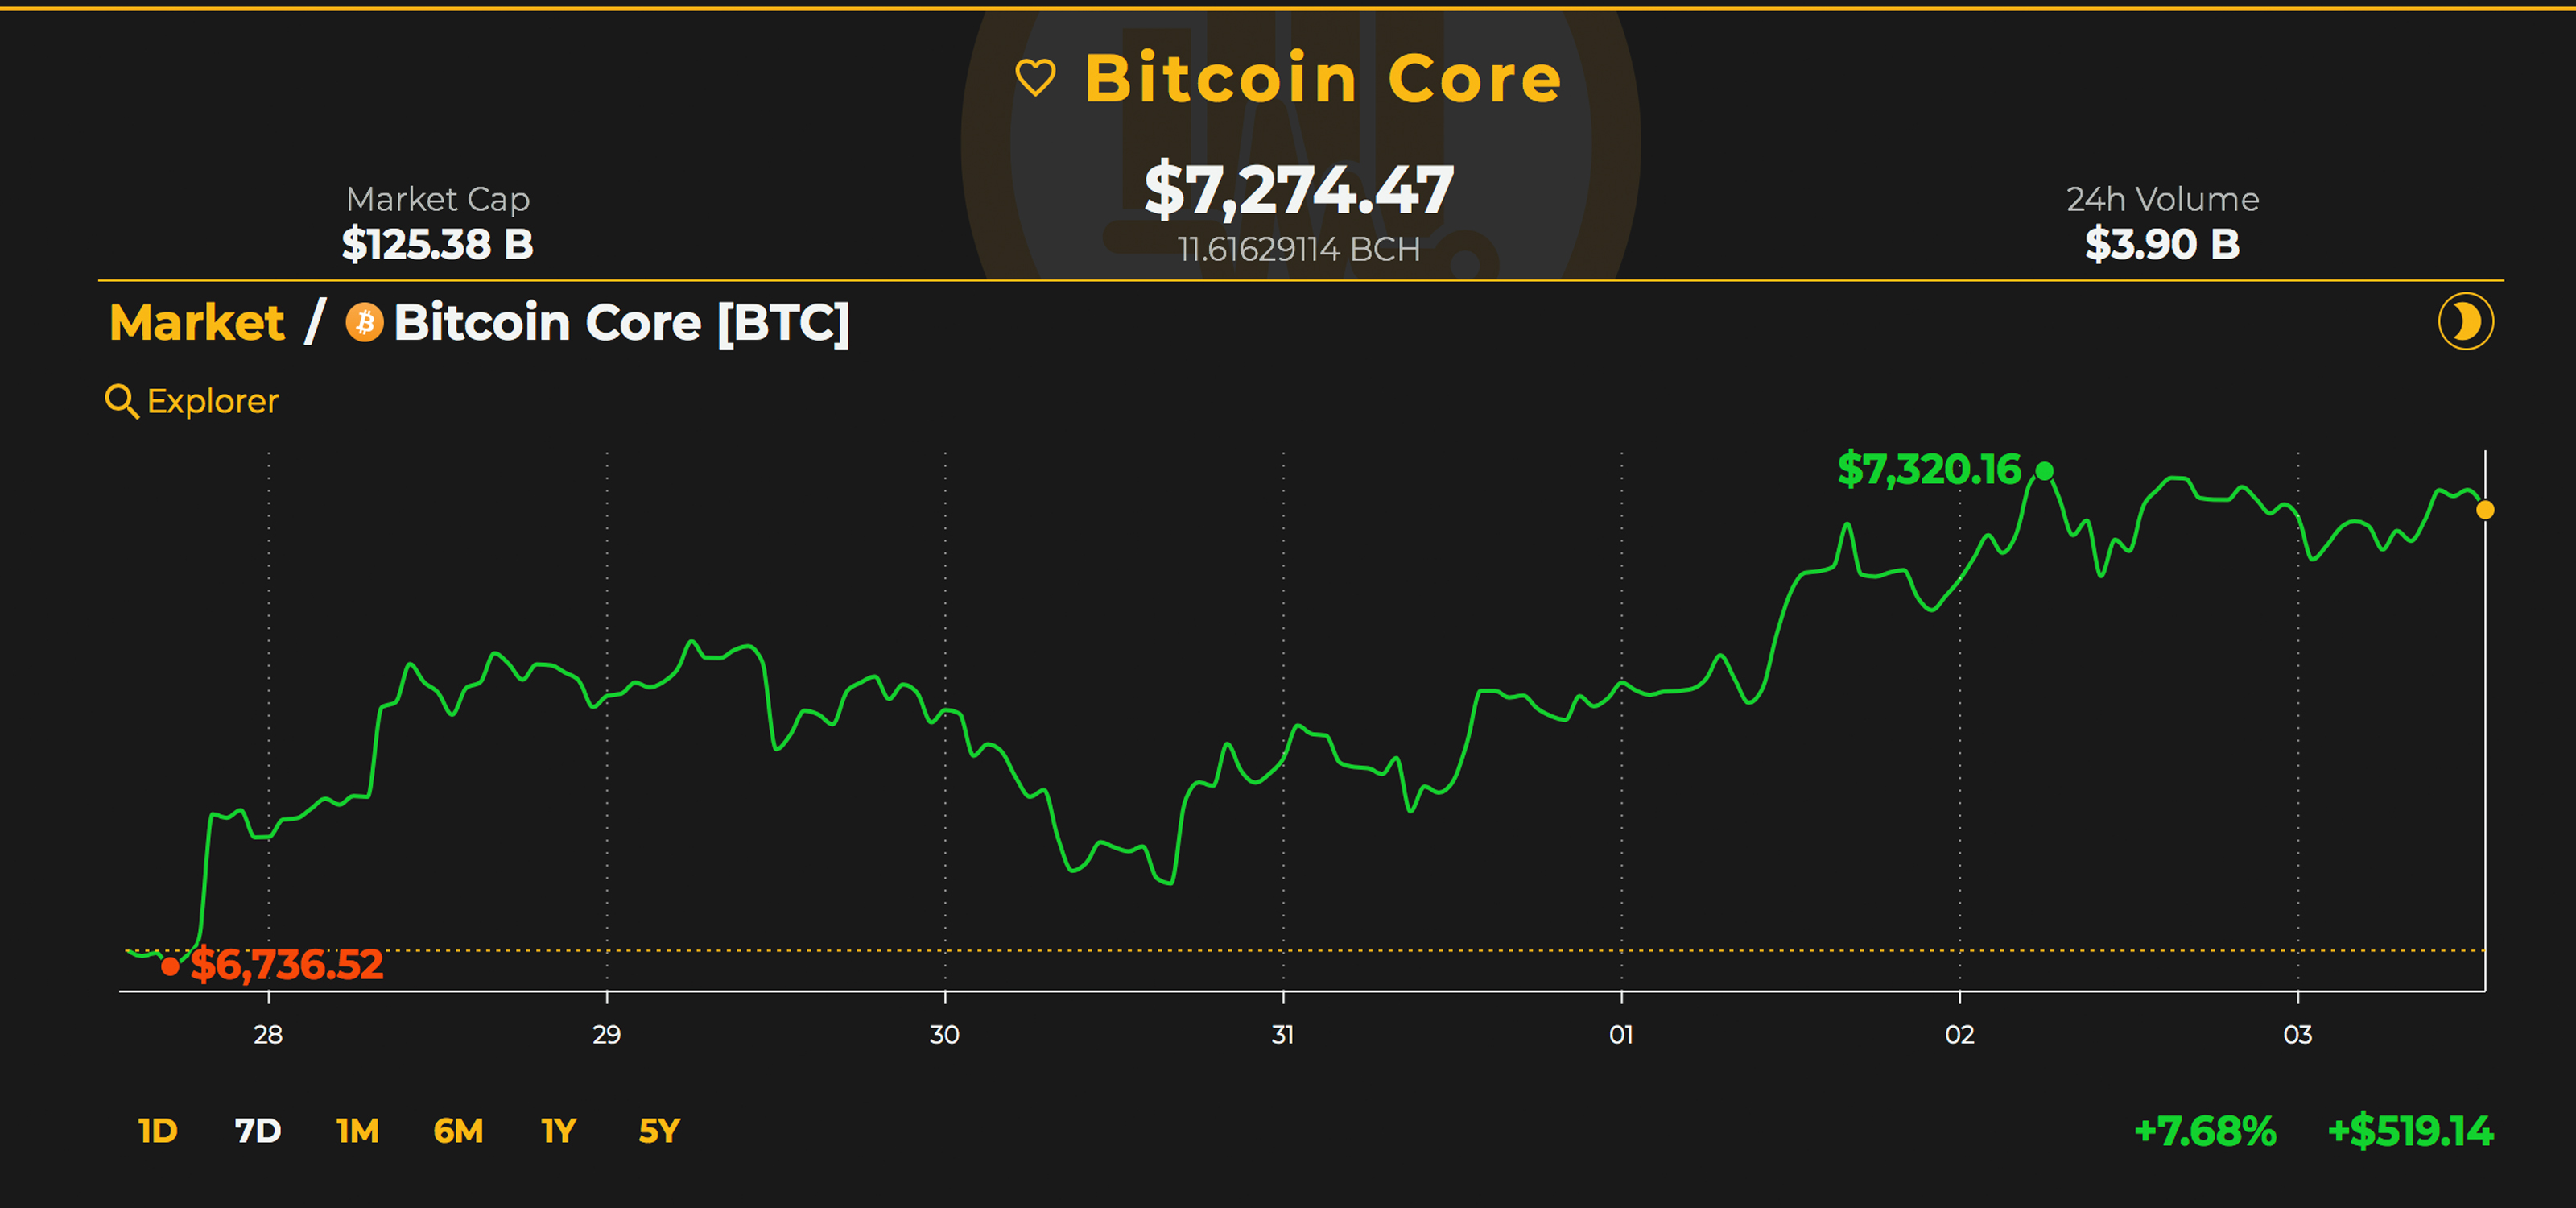
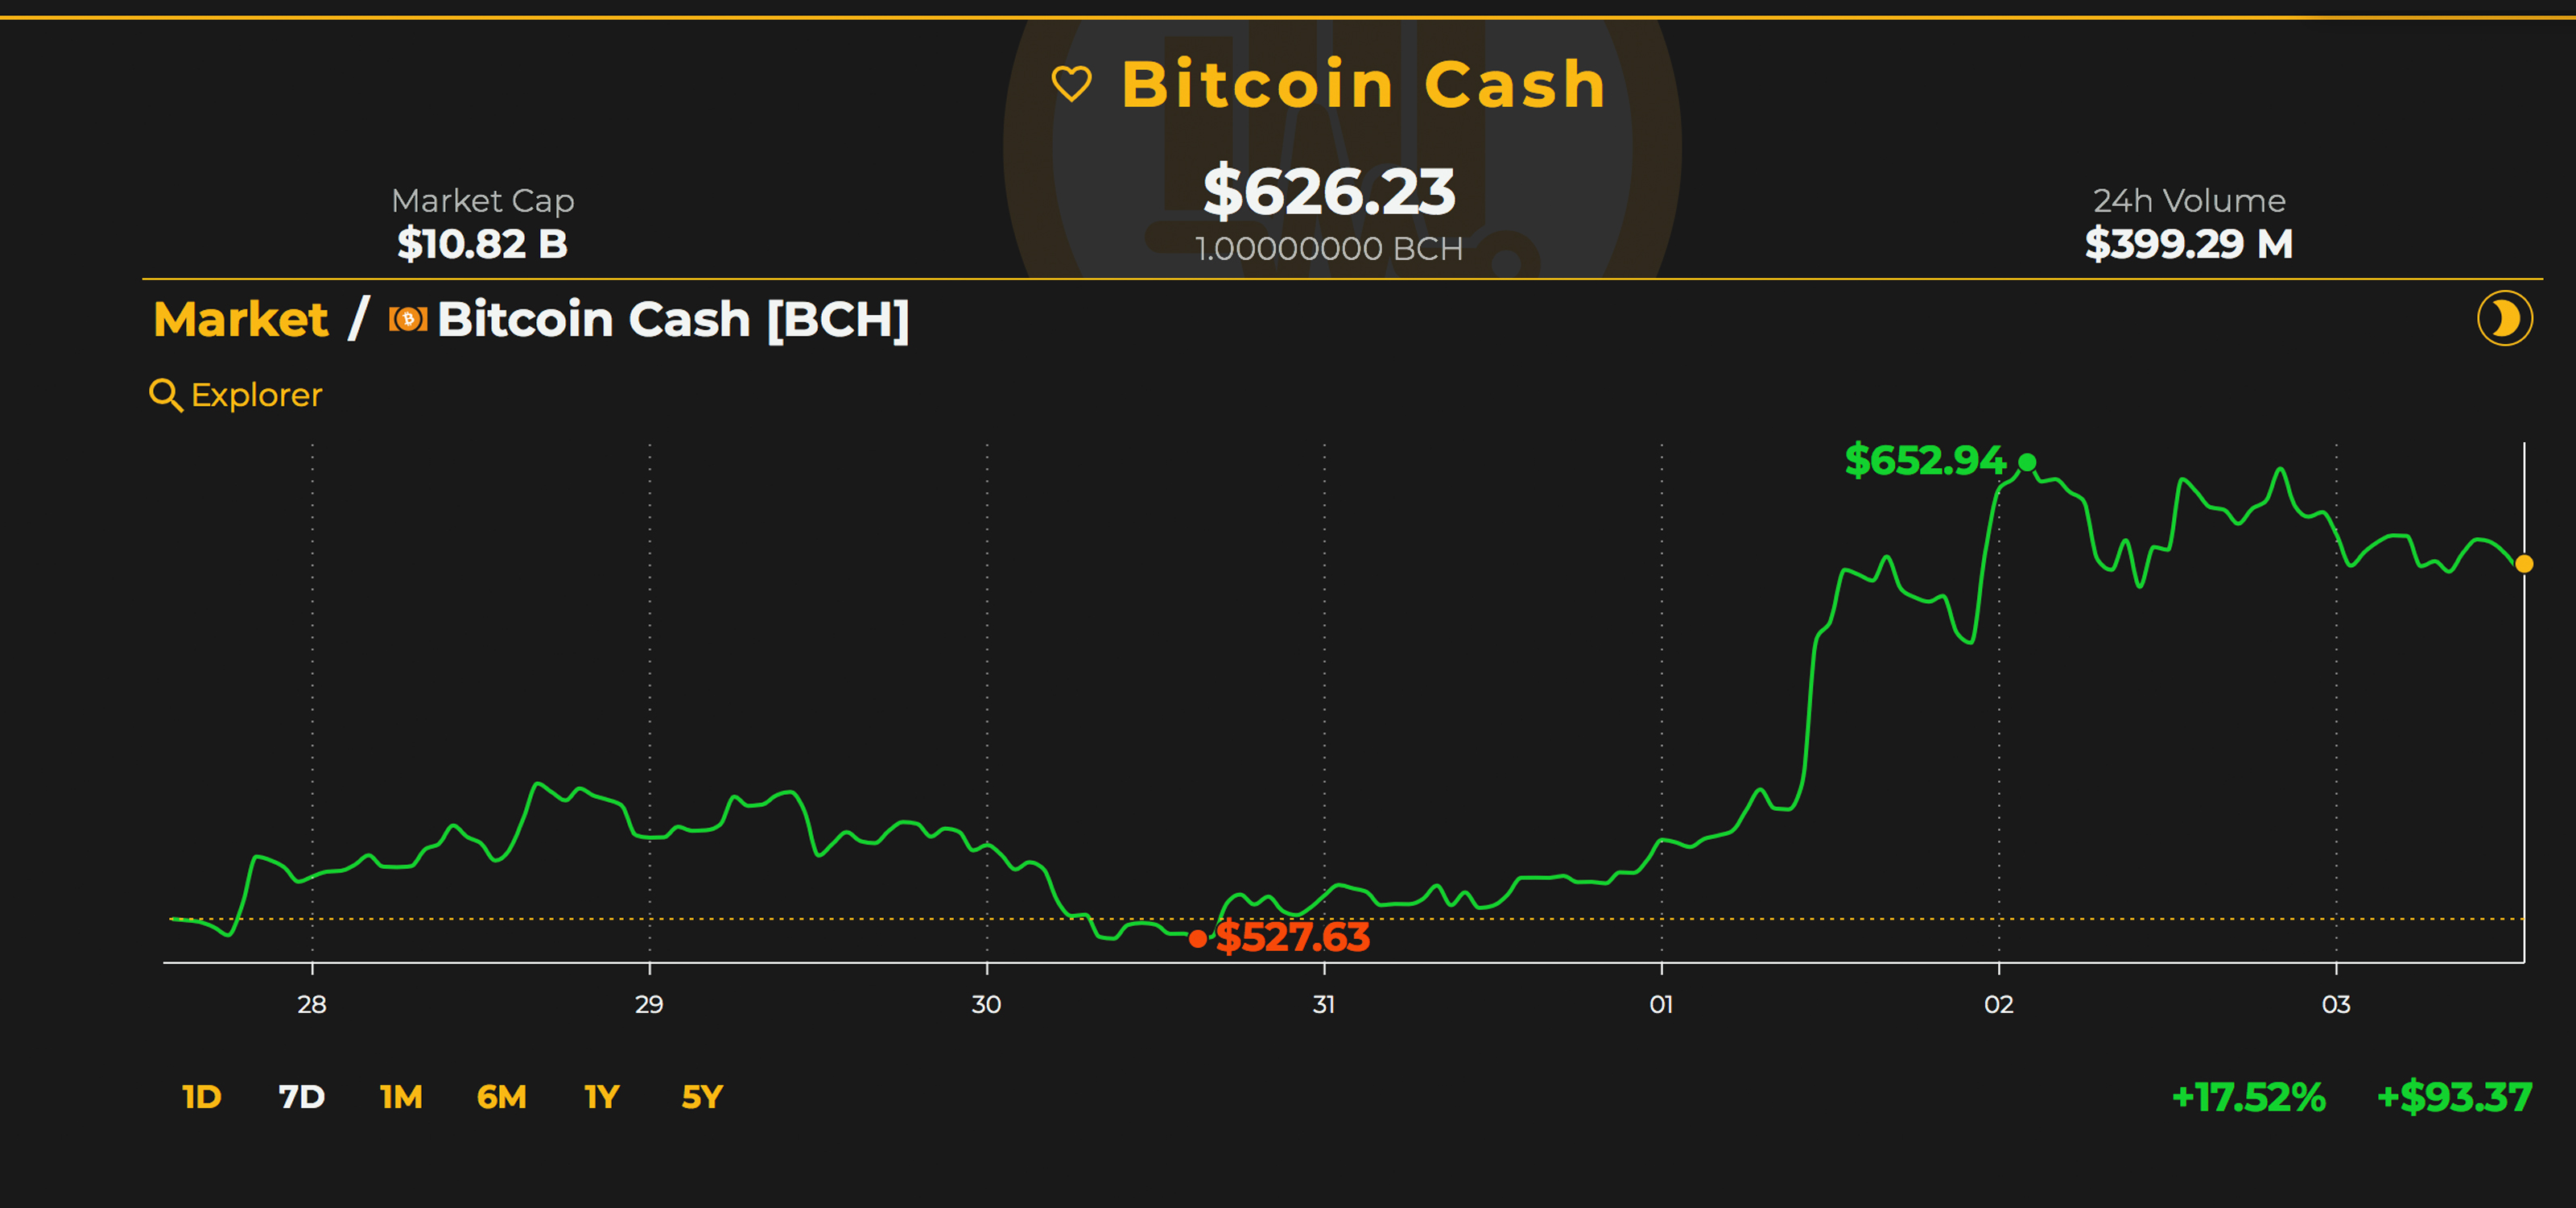
Many people are wondering when the cryptocurrency bear market of 2018 will end. Some believe the tides are already changing while others believe it will continue to be a grueling year of dipping markets. There are still Wall Street bigwigs who think BTC will reach $20K by the year’s end and folks like Fundstrat’s Tom Lee remind us of these predictions every week. Meanwhile, this week a variety of digital assets have seen much larger gains than BTC’s 7.7 percent weekly rise, as some rose above 15 to 40 percent over the last seven days. For instance, bitcoin cash (BCH) spiked 17.8 percent during the last week, eos jumped 24 percent, and dash saw a 40 percent jump.
Bitcoin Core (BTC) Market Action
Right now BTC is hovering around $7,274 in value and is up 0.15 percent over the last 24 hours. BTC’s market valuation today is about $125.3B and $3.9B in trades have been swapped over the last day. The top five exchanges trading the most BTC are Bitflyer (69%), Binance (5.7%), Bitfinex (3.9%), Bitmart (3.3%), and Coinbene (2.9%). Right now there is lots of tether (USDT) being swapped with BTC as BTC/USDT pairs are around 59 percent today. This is followed by USD (16.8%), JPY (12.2%), KRW (3.2%), and EUR (2.9%).
BTC/USD Technical Indicators
At the time of writing, BTC/USD 4-hour charts show some interesting activity. The two Simple Moving Averages (SMA) have recently crossed hairs with the SMA 100 above the longer-term 200 SMA. This indicates the path towards the least resistance is the upside and prices may see some more upward pushes. However, the Relative Strength Index (RSI) is hovering around 64.3 showing some bullish exhaustion and overbought markets. Order books indicate that buyers need to surpass $7,500 and another pitstop at $7,850 to gain higher ground. On the backside, if bears gather more strength then there’s lots of foundational support between the current vantage point and $6,500.
Bitcoin Cash (BCH) Market Action
Currently, bitcoin cash prices are around $626 per coin and BCH has a market valuation of around $10.8B. Over the last 24 hours, BCH markets have seen around $399M in global trade volume. The top trading platforms swapping the most BCH include Lbank 16.47%, Coinex 13.65%, Okex 13.29%, Binance 10%, and Huobi 8.55%. The top currencies paired with BCH today include tether (USDT 46%), BTC (26.7%), ETH (12.4%), USD (8%), and QC (2.4%).
BCH/USD Technical Indicators
Looking at the 4-hour BCH/USD chart on Bitfinex and Bitstamp shows some differences between the BTC/USD chart. For instance, the two SMA trend lines show the longer-term 200 SMA is well above the 100 showing the least resistance is toward the downside. The RSI oscillator for BCH/USD charts is meandering around 62 which indicates some uncertainty after some expected pull back. Looking at order books towards the upside shows from now until $680 there is heavy resistance. Towards the downside, strong support can be seen between now and $610, and at $550.
The Verdict: Enthusiasts Seem Positive, But Traders Are Betting Against BTC as Shorts Near Last August’s ATH
Cryptocurrency proponents seem optimistic the bearish trend will end soon, based on the sentiment to be observed on social media, Telegram trading chat groups, and forums. However looking at future markets on Bitfinex, Bitmex and others show people are betting heavily against BTC’s price going up. BTC/USD short contracts on Bitfinex are slowly approaching the all-time high (ATH) that took place on August 21.
There was a small short squeeze that took place the following day but the squeeze was short-lived. Right now there are 33,408 shorts on the exchange and only 25,974 long positions. Again, either two things could happen: either the shorts bring the price down and bears get their way or lots of short positions will be squeezed which is what happened last April.
Where do you see the price of BTC, BCH and other coins headed from here? Let us know in the comment section below.
Disclaimer: Price articles and markets updates are intended for informational purposes only and should not to be considered as trading advice. Neither Bitcoin.com nor the author is responsible for any losses or gains, as the ultimate decision to conduct a trade is made by the reader. Always remember that only those in possession of the private keys are in control of the “money.”
Images via Shutterstock, Trading View, and Satoshi Pulse.
Want to create your own secure cold storage paper wallet? Check our tools section.
Disclaimer
The views and opinions expressed in this article are solely those of the authors and do not reflect the views of Bitcoin Insider. Every investment and trading move involves risk - this is especially true for cryptocurrencies given their volatility. We strongly advise our readers to conduct their own research when making a decision.


