Latest news about Bitcoin and all cryptocurrencies. Your daily crypto news habit.
Greetings fellow traders! In this write up, I’d like to discuss what I feel is a very under utilized tool in the Crypto Trading atmosphere. This tool, if you couldn’t figure out from the title, is the Heikin-Ashi candles.
You may be asking yourself, “Well Mr. McGruff, what are the Heikin-Ashi candles?” Well, they are a powerful candleset that utilizes the average prices of candlesticks to smooth out the trend. If you’d like to see the technical formula for it, it is available here on Investopedia.
So lets take a look at the difference between a chart using traditional candlesticks vs. a chart with Heikin-Ashi candlesticks.
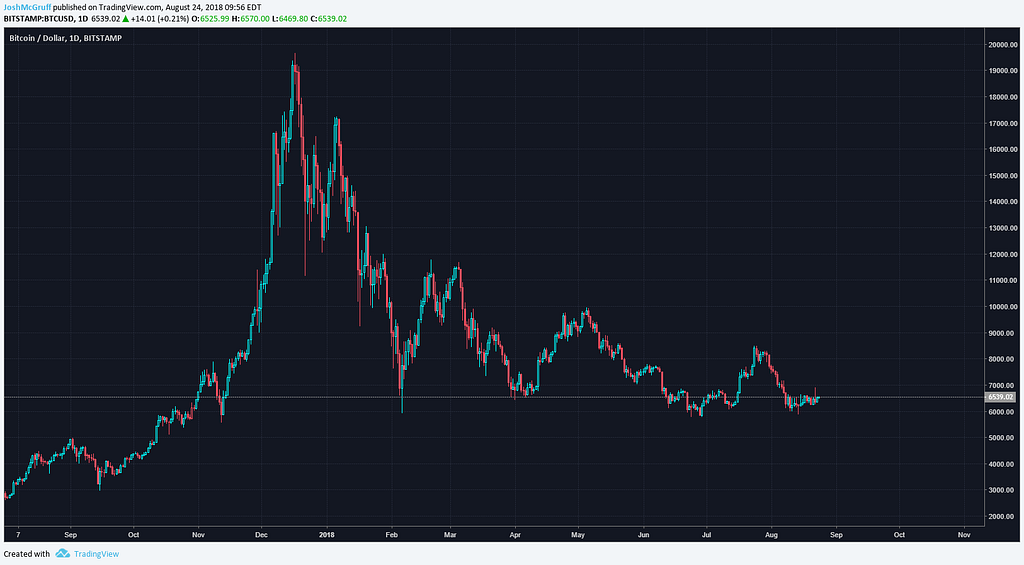 Normal Candlesticks
 Heikin-Ashi Candlesticks
See? The Heikin-Ashi is a lot smoother in presenting clear uptrends and downtrends. Personally, I find I like much larger time frames when using Heikin-Ashi to follow an overall trend of a coin. (1 Day or higher)
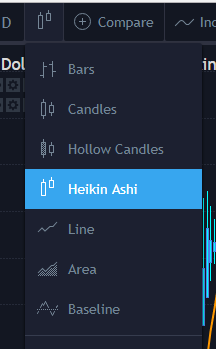
To access these, in your TradingView select the candles at the top, then Heikin-Ashi
 “A whooollleee neeew wooorrrrllldddd”
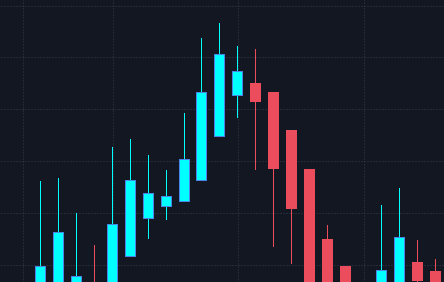
A few things you should know about Heikin-Ashi candles are the wicks show strength of a trend as well.
 Cool wicks. But not as cool as John Wick.
Bullish candles with no wick underneath indicate strong buying pressure where a bearish candle with no wick over it indicates strong selling pressure. Candles with wicks on both sides indicates indecision and a fight between the bulls and bears.
Also note, the majority of candlestick patterns used on traditional candlesticks are not applicable to Heikin-Ashi, but Dojis and Spinning Tops are! Traditional TA shapes, such as wedges and triangles, are still applicable.
So what can you do with all of this? For starters, you can get a much clearer picture of an overall trend with a coin. This becomes a powerful tool in determining if there is a minor cool-off or if the entire trend is reversing from a bullish to bearish (and vice versa).
Next, I’d like to present to you a page straight out of the McGruff playbook.
Let’s kick this off with a I am not a licensed financial advisor moment. This is presented purely as something that I do and if you decide to use it, you do so at your own risk.
Now that we’ve had a crash course in Heikin-Ashi, if we add some Moving Averages to the chart, we find the ability to use a simplistic, but powerful trend trading strategy.
What I utilize here is a 10 day and 20 day Moving Average on the 1 Day time-frame.
When the 10 Day crosses above the 20 day, and we have bullish candles, I buy. I will exit the trade on first bearish candle shown. This is a conservative strategy, but it can save your ass. Back test it and you’ll see.
If, the candles flip bullish again, and the 10 is still above the 20 I will re-enter the trade. If the 10 MA crosses down over the 20, I will not consider another trade until the 10 crosses back up again.
That was a lot at once. Here’s a pretty picture to help reinforce my point, and below that a check-list.
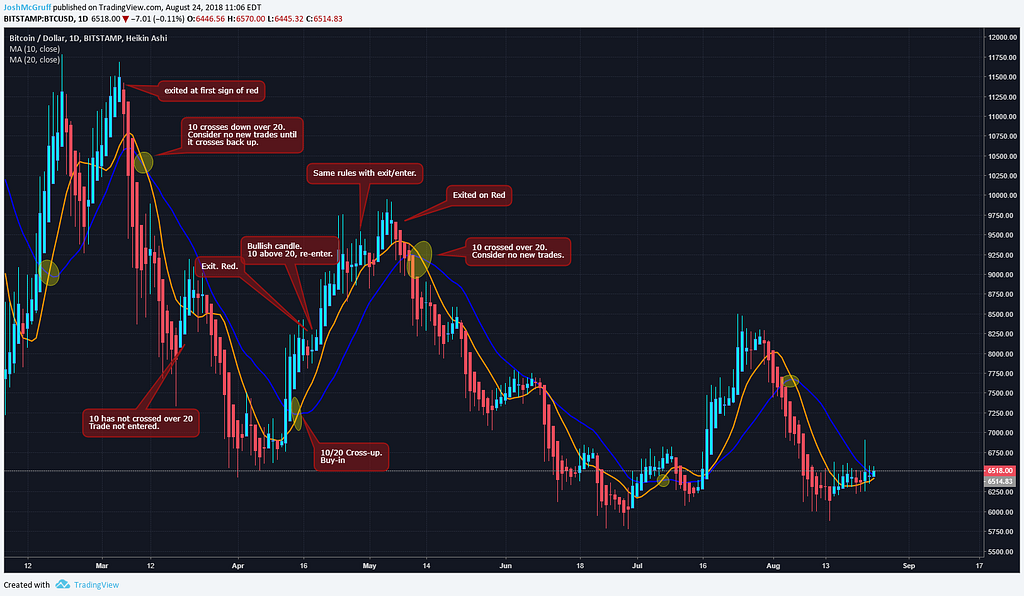
This checklist gives traders a simple rule set to follow and removes emotion out of your trading. You follow the rules regardless of how you “feel”. It is more conservative and you’ll enter trades later and exit sooner. But, you’re protecting your capital. Little gains add up!
Also, since this is used on the 1 Day chart, you have plenty of time to monitor your trades. You really only need to check your charts a couple times a day and have some alarms set to let you know if something catastrophic has happened. This could also be used to open longs/shorts and with other time frames. I’ve seen others also prefer the EMA or SMA’s instead of the regular Moving Average. They will provide different entry/exit signals.
All I can say to that is, back-test everything! You should always test your strategies on historic data and paper trade with it before using your capital. I certainly recommend the same if you decide you want to utilize this strategy.
 Little gains add up! Protect your capital!
I hope you learned something from this in regards to Heikin-Ashi candles and maybe a new strategy to test. As a trend trader myself, I find the Heikin-Ashi as one of the most frequently used tools in my belt.
If you’d like, you can follow me on the following platforms:
Twitter: @JoshMcGruffInstagram: @JoshMcGruffTradingView: https://www.tradingview.com/u/JoshMcGruff/
Lastly, come join me in Discord in our Free Crypto group Ivory Mountains that I helped Co-found and let me know if this helped you or if you hated it!
Heikin-Ashi: The Trend is your Friend was originally published in Hacker Noon on Medium, where people are continuing the conversation by highlighting and responding to this story.
Disclaimer
The views and opinions expressed in this article are solely those of the authors and do not reflect the views of Bitcoin Insider. Every investment and trading move involves risk - this is especially true for cryptocurrencies given their volatility. We strongly advise our readers to conduct their own research when making a decision.

