Latest news about Bitcoin and all cryptocurrencies. Your daily crypto news habit.
This is part 3 in my series about trying to build a revenue-generating web application that provides sustainable passive income. If you haven’t read them already, here are part 1 and part 2.
So in part 2 of “the long road to passive income” — published in December of last year — I laid out a plan for growing my web application for making place cards from $100 to $1000 monthly revenue. It was a straightforward plan with three components: 1) riding momentum and increasing the top of my funnel, 2) optimizing (aka raising) prices, and 3) monetizing the free tier of my site.
Eight months later I still haven’t hit the $1000 milestone, though have clawed my way quite close with revenue in June topping out at $885. I thought it might be interesting to look at how my expectations matched with reality, how I actually got to this number, and where I plan to take things from here.
So how did we do on these plans?
Plan 1: Riding momentum and growing organic traffic
The first thing I hoped would happen is that I’d be able to leverage my continuing organic traffic growth — primarily from SEO work I’d done to rank highly for terms relating to place cards — to see a steady revenue climb.
And it worked! My traffic soared in November and December, and my revenue along with it. Here’s the traffic data:
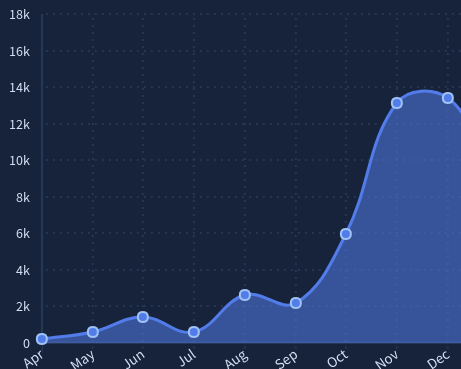 Traffic data for Place Card Me from April — December 2017. Visualization courtesy of Indie Hackers.
Only…then something alarming happened in January. My traffic dropped dramatically — by over 30%. And then it fell again in February.
What was going on?
Well it turns out that place cards are a highly seasonal business. People use them primarily for holidays in November and December, and for weddings, which, for most of the world happen in the warmer months of April — October. My traffic is continuing to grow organically, but is hugely impacted by seasonal variance that outweighs other factors for many months of the year. Here’s the complete graph to date. Note the huge dip in the beginning of 2018 followed by the slow climb into the summer.
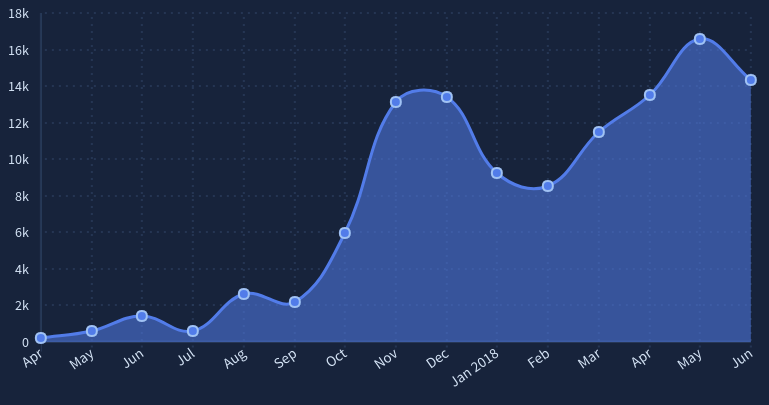 Traffic data for Place Card Me from April 2017 — June 2018. Visualization courtesy of Indie Hackers.
Anyways, the point is that while my plans for riding the coattails of organic growth generally worked out about how I’d expected, it has been a tumultuous ride.
Score: pretty much accurate.
Plan Part 2: Optimizing (aka Raising) Prices
So the way Place Card Me works is that you can make blank place cards for free, or you can pay a small amount to use a pre-made design (or upload your own design). It’s a flat single-time fee for as many cards as you want.
Having been working on this for over a year now I can say with some confidence that selling place card templates was probably a bad choice of business to get into.
For starters, it’s a consumer web product in a world where consumers expect web products to be free. Then, even when they do pay, the cost per sale is tiny, and most of my customers never need the service more than once, so the total revenue per customer is very low. To top things off, my target customers of brides and grooms-to-be is a group that a huge portion of the internet fights for attention for. So competition is high.
All that said, one of the great attributes of this business is that — precisely because I get no repeat customers — I can change prices pretty much at whim with very few implications. Every week a new crop of place-card-makers discover my site for the first time and have no preconceived expectations about what things should cost.
body[data-twttr-rendered="true"] {background-color: transparent;}.twitter-tweet {margin: auto !important;}
Technologists tend to severely underestimate the difficulty and expense of creating software, especially at companies which do not have fully staffed industry leading engineering teams ("because software is so easy there, amirite guys?") Charge more. Charge more still. Go on.
— @patio11
function notifyResize(height) {height = height ? height : document.documentElement.offsetHeight; var resized = false; if (window.donkey && donkey.resize) {donkey.resize(height); resized = true;}if (parent && parent._resizeIframe) {var obj = {iframe: window.frameElement, height: height}; parent._resizeIframe(obj); resized = true;}if (window.location && window.location.hash === "#amp=1" && window.parent && window.parent.postMessage) {window.parent.postMessage({sentinel: "amp", type: "embed-size", height: height}, "*");}if (window.webkit && window.webkit.messageHandlers && window.webkit.messageHandlers.resize) {window.webkit.messageHandlers.resize.postMessage(height); resized = true;}return resized;}twttr.events.bind('rendered', function (event) {notifyResize();}); twttr.events.bind('resize', function (event) {notifyResize();});if (parent && parent._resizeIframe) {var maxWidth = parseInt(window.frameElement.getAttribute("width")); if ( 500 < maxWidth) {window.frameElement.setAttribute("width", "500");}}
As a result, I’ve been able to run pricing tests pretty much continuously over the history of the product. I started selling templates for $5–10, eventually slashed prices to $1, and then over the course of the last nine months slowly raised them to $2, $3, $5, and then back down to $3.50, where they currently stand.
To evaluate the net effect of pricing changes, I looked at just a few numbers:
- The portion of visitors who Buy a template, B
- The average sale Price of a template, P
- The average Revenue per visitor, R, which is simply B * P
Assuming the higher the price goes, the fewer people will buy something, then there should be an optimal price that maximizes R.
In practice this data was quite a bit more messy. Here’s what that looks like for the various price ranges I’ve tried.
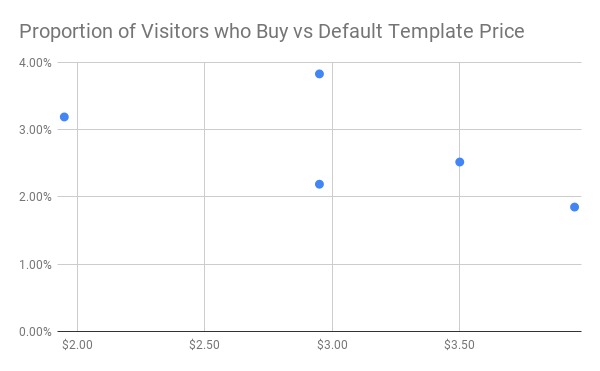 Proportion of visitors who buy (B) vs default template price
There are two dots for $2.95 because the data was completely different between December and March, where the prices were the same. December sales rates were much higher — likely due to the bump in holiday place card sales.
Here’s what this plot looks like once you factor in the sale price (P) and convert to revenue per visitor (R).
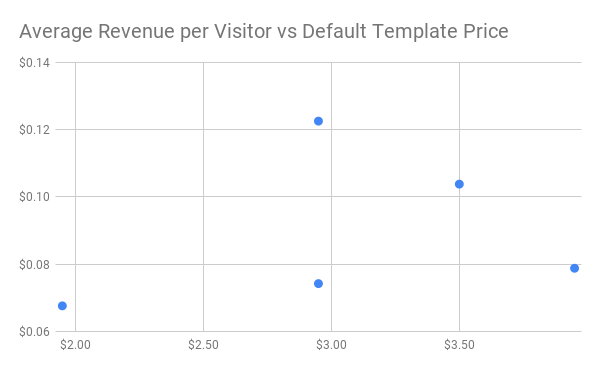 Average revenue per visitor (R) vs default template price.
Now we can see clearly that in general higher prices do better than lower ones, but the data is still too messy to determine an optimal price, and the anomalous December point continues to mess things up.
In part 2 I suggested that I’d be able to double my revenue through price optimization. The reality so far is that I’ve only been able to increase it by about 50%.
Score: Only a 50% increase instead of 100% — so far.
Plan Part 3: Monetizing the Free Tier
The last part of my plan from December was monetizing the free tier. For that I took a simple approach of adding a little branding to the place cards and letting people pay $2.00 to remove it.
 What the free place cards look like with branding added.
I only just implemented that change on July 13th (about six weeks ago at the time of this writing). Since then I’ve seen an average of about 2.5 sales per day, for a daily revenue of $5 and a monthly additional revenue of $150.
It’s a far cry from the $400 additional revenue I suggested I’d get in the last post, though like other things I plan to continue playing with the price and idea and see if I can continue getting that number to climb.
Score: Only making 40% of my suggested $400/month but still early.
New Revenue Streams
That covers everything I had said I would do in part 2, but it’s not a complete picture of my passive income revenue. In the last 8 months I’ve also added three new sources of revenue:
- Affiliate links ($12/month)
- Donations ($3/month)
- A second product ($80/month)
A quick summary of each of these follows.
Affiliate Links
By far the easiest thing I did to add a tiny amount of extra cash was set up some Amazon affiliate links. If you don’t already know, the way it works is that you link to Amazon.com with a special code, and then if anyone buys something after clicking on your link you get a small cut of the sale.
I was already linking to Amazon in a few places, for example, suggesting what type of paper people should use for place cards, so after I got over the ickiness factor it was a no-brainer to add these tags.
While the revenue generated is so far extremely meager, every little bit counts!
 My extremely modest month-over-month affiliate revenue from Amazon.Donations
The second thing I did was set up a buy me a coffee page and link to it in a few places, including inside my Google Photos Chrome Extension. I also stick a link in my email signature when providing above-and-beyond customer support for Place Card Me.
Buy Cory Zue a Coffee - BuyMeACoffee.com
So far, the donation button has done almost nothing, but one extremely generous person gave me $15 for helping with her place cards.
A Second Product
The last thing I’ve done — which has generated the most revenue of the three, a whopping $80 / month — is set up a paid tier for a second product.
The product is called Chat Stats — and it’s a way to generate fun/silly analytics about group chats on GroupMe, a relatively obscure messaging platform that I happen to use a lot.
Like all my entrepreneurial endeavors, this product was created because it was something I wanted to see in the world that didn’t exist, and so I decided to make it. I soft-launched it in December of last year by posting on a few subreddits, and, when I started to see a small uptick in usage, added a paid tier in April. People pay $10 to import up to 500,000 messages and get a few extra features.
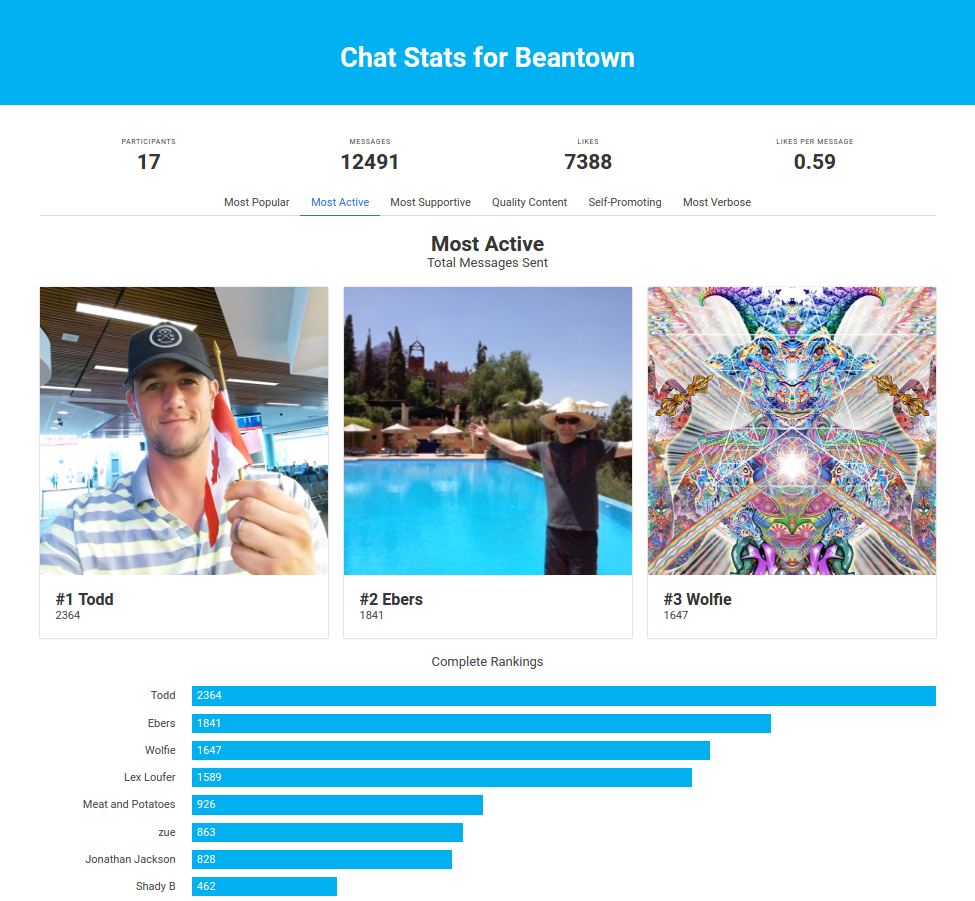 My second revenue generating product: Chat Stats
What’s kind of remarkable about this product is how little I’ve done to promote it.
With Place Card Me I was promoting it on all kinds of places and heavily focused on SEO, but for Chat Stats I’ve literally just posted on reddit and done almost nothing else. My theory is that by picking something so obscure that it has a tiny niche audience it becomes quite easy to reach them.
What’s Next?
At the end of part 2 I reflected on how I might go from $1000/month to $5000/month. I concluded with the sentence: if I can successfully double revenue 8 times, surely I’ll be able to do it two or three more, no?
Eight months later and still chasing that $1000 milestone, I’m feeling a bit less confident.
I’ve mostly run out of easy wins on Place Card Me, and while I think I’ll be able to increase revenue slowly over time by continuing to improve the product, market it more, and further optimize pricing — it’s hard to see the 2x changes that I would need to make to really move the needle at this point.
Meanwhile, I’m pretty sure I’ve already saturated the market of “people using GroupMe willing to pay for silly analytics data”. A natural next step would be to try and expand into a new chat platform, but that would be a fairly substantial amount of work and I’m not yet sure that the product is as interesting on other platforms.
So, I guess the answer right now is that I’m not sure what’s next. I suppose that’s what I’ll have to work out in Part 4.
The Silver Lining
Pessimism aside, I can still confidently say that the dream of passive income is alive and well.
In 2017 I worked 283 hours on Place Card Me and earned $945.35. That’s an hourly rate of $3.34, or about 46% of minimum wage in the US.
In 2018 so far, I’ve worked 48 hours on Place Card Me and earned $3381.60. That’s a totally respectable hourly rate of $70.45, and since March my hourly rate each month has been over $100!
 All time month over month revenue and usage data for Place Card Me.
Moreover, more than 16,000 people have used Place Card Me to make over 600,000 place cards. That’s 16,000 lives improved. Thirty-five miles of place cards laid end to end. I know it’s not changing the world, but it is a tiny little dent in the universe that’s all mine.
Originally published at www.coryzue.com.
The Long Road to Passive Income Part 3: Expectations vs Reality was originally published in Hacker Noon on Medium, where people are continuing the conversation by highlighting and responding to this story.
Disclaimer
The views and opinions expressed in this article are solely those of the authors and do not reflect the views of Bitcoin Insider. Every investment and trading move involves risk - this is especially true for cryptocurrencies given their volatility. We strongly advise our readers to conduct their own research when making a decision.