Latest news about Bitcoin and all cryptocurrencies. Your daily crypto news habit.
Bitcoin value Oct.16 2013 — $150, Bitcoin value Nov.30 2013 — $1,150, Bitcoin value Dec.19 2013 — $560. What was that?
We all remember the huge Bitcoin run at the end of 2013, or to give it a more common name — “The 2013 Bubble”. I’m not saying whether it’s right or wrong to call it a bubble, but I can tell you it was all to do with market cycles. After 2013, the price of bitcoin dropped as there seemed to be one long correction. For months after, we experienced a long period of consolidation and capitulation in a downtrend, until October 2015.
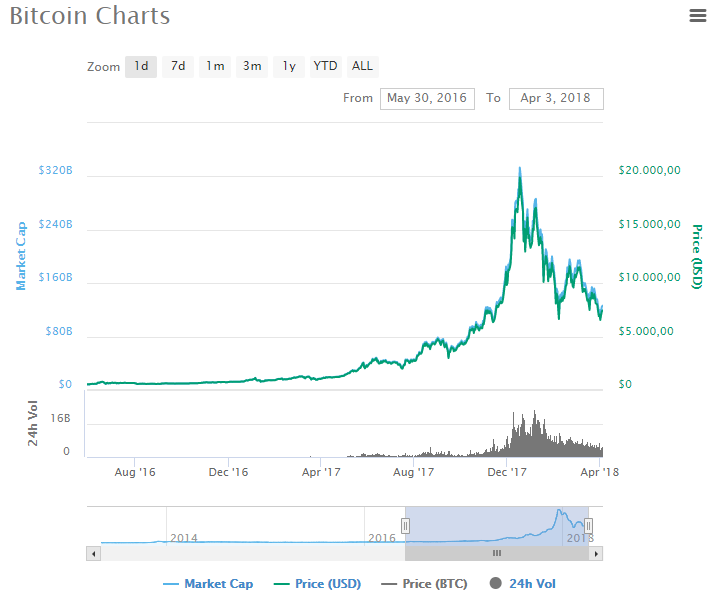
Bitcoin chart 2013–2015.Fast forward to today’s market; Bitcoin had a huge rally when it crossed the $500–600 mark in the middle of 2016, and from there the only way was up to $20,000. After touching the peak, there was a quick 2-month drop back to $6,000 on February 6 this year. This was the recorded low as of this writing. When we take a closer look at the Bitcoin chart, there’s no dispute possible the 2013 chart is nearly identical to the 2017 chart.
What are market cycles?
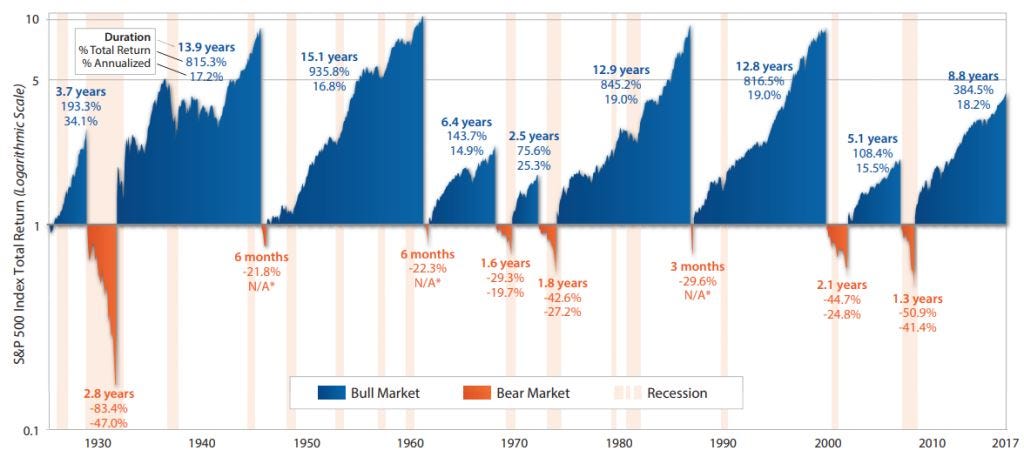
In general, we are speaking about the time period between two highs or lows of a market. In the conservative stock market such market cycles happen over longer terms (years) on average. The image below shows the cycles of the US stock exchange throughout history, starting from the Great Depression in 1929 up to the current day.
The last famous recent lows of the cycles were around the years 2000 and 2008. They were the dot-com bubble pop and the sub-prime real estate crash. Is the NASDAQ close to the peak again? Time will tell. As you can see — “markets take the stairs up and the elevator down”, this is also true for any other financial markets, including the crypto markets.
What differs between the conservative stock markets and the crypto ones, is the crypto volatility. While a sharp daily movement of NASDAQ is considered to be 1–2%, Bitcoin, which is considered the most stable crypto currency and the base asset, can drop more than 10% daily (and rise 17%, and vice versa). And this is considered usual behavior.
The psychology of a market cycle
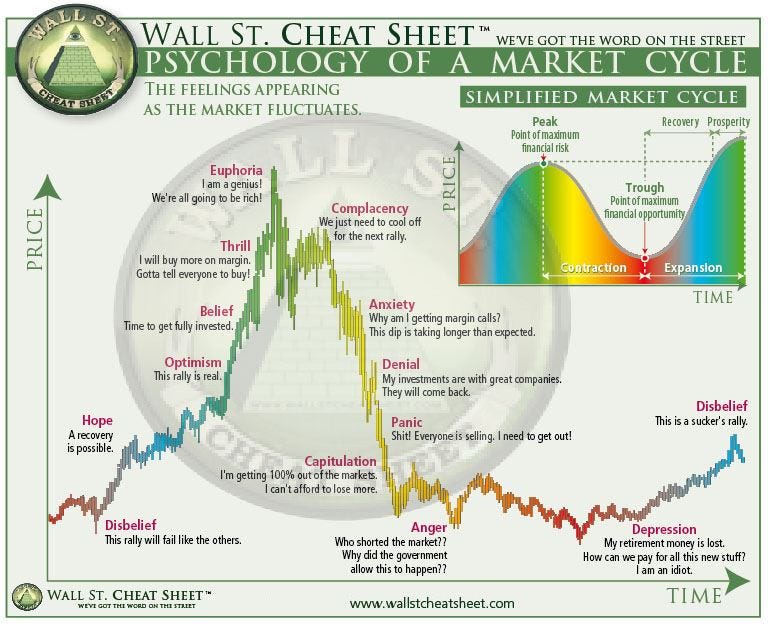
Karen Bennett, writer at cheatsheet.com, has the created the amazing chart (above) showing the psychology of a market cycle. It describes the most common emotions people experience as the market fluctuates. These human emotions drive our financial markets much more than the market fundamentals.
Meet the 10 stages of a market cycle
Stage 1: Hope
‘Hope’ is the first sign of recovery after “the serious disbelief” stage (see Stage 10 — last in the cycle). The market is showing positive signals for a new bull run. However, investors are still careful. Small amounts of money are being invested.
Stage 2: Optimism
Optimism defines the second stage where prices are rising as new capital is being invested. This stage is reached when the market has been in a sustained uptrend for many months. The market has a positive outlook, and therefore many investors are comfortable investing money at this stage.
Stage 3: Belief
As time goes by, the optimism turns into belief. This stage of ‘belief’ is defined as one of the first signs of a bull market. Investors seek new opportunities in the market.
Stage 4: Thrill
Searching for alternative investment options can be a good idea if you know what you are doing. People easily get caught up in feeling thrilled as they select random projects because they believe nothing can go wrong. Everything is running up. It is important to keep track of your excitement level as being overexcited is a clear sign for closing a position.
Stage 5: Euphoria
The end of a huge run-up is defined by euphoria. Human emotions are taking over, nothing can stop us now, it’s all puppies and sunshine. There is only one direction — up. In this phase of the bull-run, the “stupid money” jumps onboard the train, this kind of money is the first to leave. At this stage, expect the press to report about the bull market, and you get the “meet the new young millionaires” articles. At this stage, the smart money is taking profit throughout the parabolic movement.
Stage 6: Complacency
At this stage, the bull-run is stagnating as people’s lofty expectations are not met. The first signs of a reversing market start to pop up. This is a very dangerous stage as people think the complacency stage is just a short break before the bull-run continues. Many investors are ill-prepared for the upcoming market reversal.
Stage 7: Anxiety
Finally, people become aware that this bull-run can’t go on forever. They see the market is reversing, losing value and money. The fear of losing lets traders delay the realization of a loss, which then turns into much greater losses.
Stage 8: Denial
However, the value of your investments continue to drop, and many investors refuse to sell hoping for an even bigger correction upwards. Investors act defensively as they are convinced they have invested their money wisely. However, generally, almost no coin is able to come out scot-free. When there is rain everyone gets wet.
Stage 9: Panic
The market continues to decline as a bear market has become the new reality. Investors try to save their funds by desperately selling their investments, as they are afraid to lose everything. Often we see a major sell-off happening at the panic stage.
Stage 10: Depression
People lose all hope and their belief in the existing market conditions. The market is at its lowest point in the current cycle (as will be noticed afterward). This is where stabilization and consolidation start building again. This stage can take a very long time.
In general
These 10 stages repeat over time and define a market cycle. Not every market cycle will follow this exact chart and the exact time it takes. However, it should give you some valuable insights into the psychology of market cycles. All markets go through cycles over the short-term. The duration and amplitude of these cycles are partially defined by risk (which is very high for the crypto market). However, market cycles are hard to predict. But, we know that markets will not continue up indefinitely or fall to zero (in legitimate markets). In the past, they have always “reverted to the mean.”
Bitcoin is not the only one to cycle
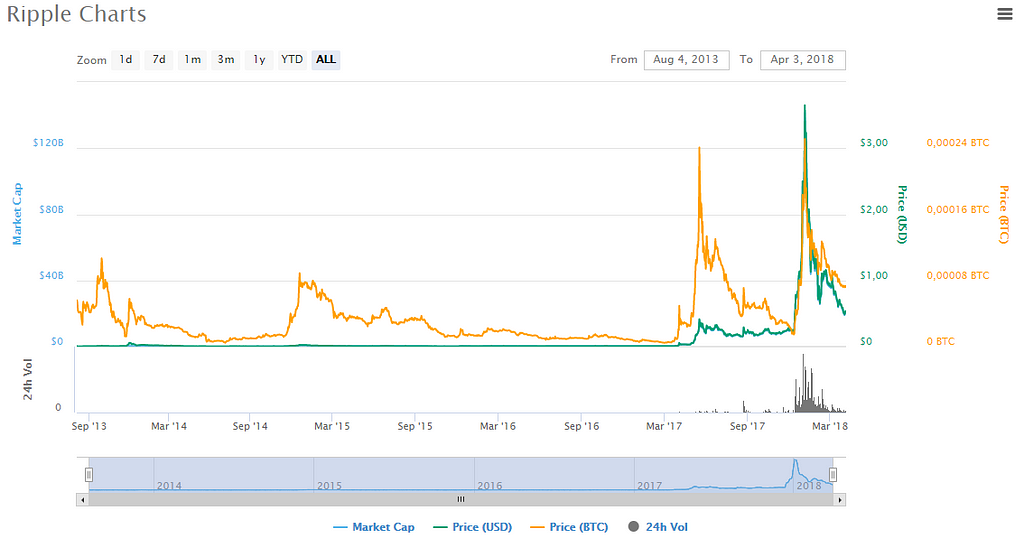
Bitcoin is not the only crypto that shows certain market cycles. Take a look at the Ripple chart. You can spot two large market cycles and two smaller cycles. This is just part of the “Altcoins season.” It’s not just limited to Ripple.
Market Cycle Trends
There are two major trends we generally see in a crypto market cycle:
- Entry of liquidity: New money flows into the market. Most of the money goes to Bitcoin as this is the entry point of the crypto market.
- Bitcoin dominance: The dominance of Bitcoin started to decline from December 2017 as many investors were looking for new altcoin investments. This surge of altcoin buying is sometimes an indicator that a market is overbought as people seek new opportunities, and so potentially indicates the start of a new decline in the near future.
Where are we at in the current market cycle?
First, no one knows, and we can only estimate. At the moment, it seems like we are between the stage of anger and depression (the image below shows the actual price and market cycles graph). As mentioned before, we have had a large correction from the $20K area to $6,000 (as of this writing). We expect the price to remain stable or slightly negative for a while. Is this positive overall? Yes, definitely. This is natural and needs to happen. The feeling of euphoria has bloated the blockchain space. The depression will kill a lot of unnecessary projects, the dumb money, and will create some room for the stronger real projects that are here to stay, and to new, better projects and new smart invested money.
The best approach to market cycle investing
As markets cycle from bear to bull, we believe it is necessary to experience a “recovery.” It is unlikely that markets will enter a true bull market until losses from the previous bear market are recovered. The phase of optimism/belief can be seen as the entry point of a new bull market. Generally speaking, buy when the market is weak (feelings of anger, depression or disbelief) or during a period of depression or accumulation (i.e., in mid-2014 to 2015 was a long accumulation period of around $300), and sell when the market is strong (feelings of optimism, belief or euphoria).
Watch out, because market cycles do not exactly follow this pattern. In some extreme markets, the bear market never fully recovers losses before falling into a deeper bear market.
In Conclusion: Key steps to understanding market cycles
- Market cycles are a natural thing, accept it.
- Cut out emotions as they can become your worst enemy.
- Look for both positive and negative catalysts that can trigger a new phase.
- It’s hard to pinpoint exact beginning and end points.
- Market cycles help analysts make better decisions.
- Buy low, sell high. As simple as that.
Originally published at cryptopotato.com on April 17, 2018.
Do you know about crypto market cycles? You should was originally published in Hacker Noon on Medium, where people are continuing the conversation by highlighting and responding to this story.
Disclaimer
The views and opinions expressed in this article are solely those of the authors and do not reflect the views of Bitcoin Insider. Every investment and trading move involves risk - this is especially true for cryptocurrencies given their volatility. We strongly advise our readers to conduct their own research when making a decision.


