Latest news about Bitcoin and all cryptocurrencies. Your daily crypto news habit.
Tracing is one of the pillars of Observebility, according to Twitter. AWS X-Ray helps you to get an overview of your distributed application, to find bottlenecks and to tune its critical path. Also, it provides you with the ability to trace your requests, so you can see which journey, any single request goes through when it enters your application. AWS X-Ray can potentially be a powerful tool for debugging your serverless application, however it’s still immature and there is a lot to improve. One of them is about its debugging ability and how it shows the errors.
I’m going to explain my point it with a simple serverless application as following:
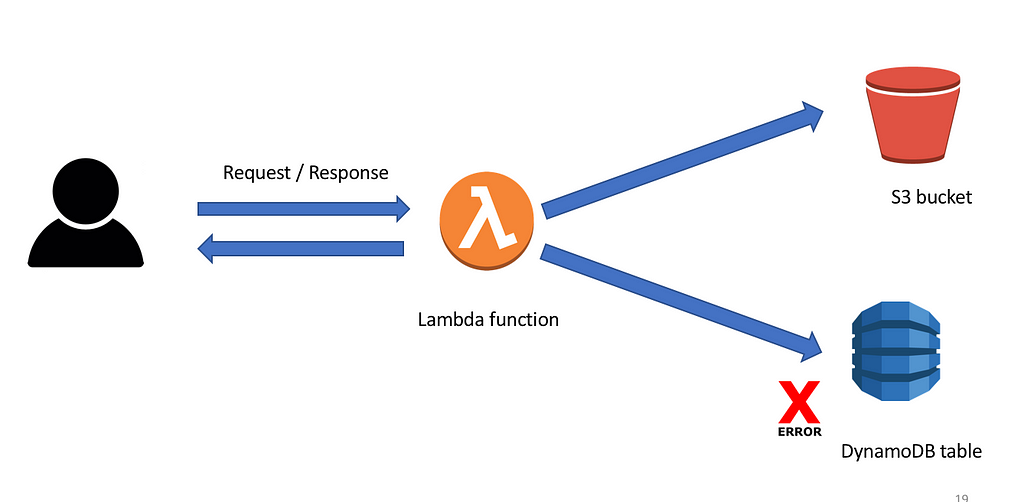
 Architecture of my example application
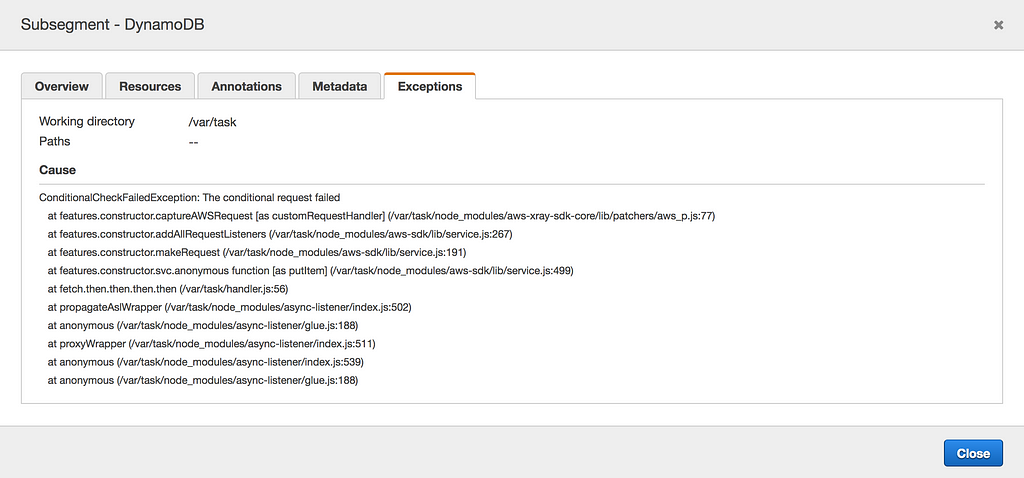
Lambda function downloads an image, saves it into a s3 bucket and records context.awsRequestId into a Dynamodb table. However, the latter part is an error prone operation: randomly the Lambda function chooses a repetitive partition key and subsequently Dynamodb throws ConditionalCheckFailedException. If an error is emitted directly from an AWS resource, normally it is shown in the Exceptions section of the subsegment. This is how the buggy trace looks like:
 AWS::Lambda::Function segment is generated by lambda function and error is reflected in the trace
 By clicking on DynamoDb subsegment, you can see the error trace in the Exceptions part
But this is not always the case; X-Ray doesn’t propagate your custom errors into the trace. These types of error can happen often in different parts of your app, and subsequently, you will see that your trace is error-free and the Exceptions part is empty, even though an error has occurred! This error-free trace doesn’t bring much help to you and for debugging, you should go through your logs. I contacted X-Ray support, they are aware of this problem and hopefully they will address this in future. However, I’ve come up with a workaround and currently, this is the only way to overcome this issue: You are able to propagate your custom error, if you create your custom subsegment! Then you can inject an error object or attach an annotation with it. Following is a snippet that you can use:
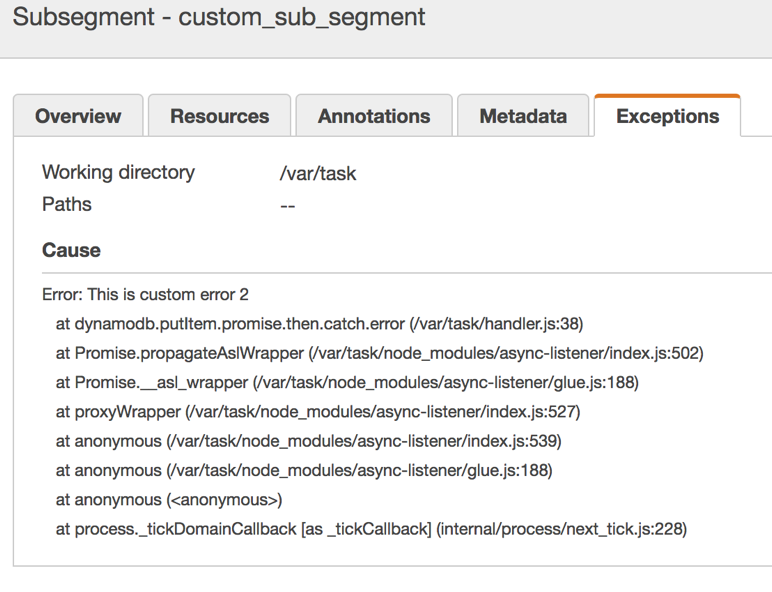
It makes your buggy trace to look like this:
 Custom error is injected into the custom segment and is visible in the trace
 If you inject an error object into your custom subsegment, you are able to see the trace
 You can put your error type as annotation, and then you can filter out races based on their error type
Now you are able to search for buggy traces with help of Filter Expression:
- You can filter out traces with specific annotation, for example: annotation.error=”customError 1"
2. You can filter out traces which have downstream issue / error with help of Complex Keyword, for example: service(“service-name”) { error = true }
You can optionally leave the service-name empty.
This workaround has a drawback; you should always create an extra subsegment to embrace your error(s), this makes it to look like a dirty workaround. But let’s hope AWS address this issue soon!
Please note:
- X-Ray categorizes client side (4xx series errors) as Error, and server side errors (5xx series errors) as Fault.
- 2. You can look into X-Ray SDK for Nodejs to find out different ways to create your subsegment
You can see my full conversation with X-Ray support team in here.
Thanks for reading. Please let me know if you have any comment or question.
Overcome X-Ray’s issue for Lambda debugging was originally published in Hacker Noon on Medium, where people are continuing the conversation by highlighting and responding to this story.
Disclaimer
The views and opinions expressed in this article are solely those of the authors and do not reflect the views of Bitcoin Insider. Every investment and trading move involves risk - this is especially true for cryptocurrencies given their volatility. We strongly advise our readers to conduct their own research when making a decision.