Latest news about Bitcoin and all cryptocurrencies. Your daily crypto news habit.

In this post, I’m covering five approaches for gaining observability in serverless (FaaS based) systems. I hope that it can help developers, system architects, and DevOps engineers make the serverless journey successful, less frustrating, and of course — enjoyable.
Serverless and Function-as-a-Service (FaaS) have been around for about three years now. It started with AWS Lambda, and quickly expanded into similar services provided by the leading cloud vendors — Microsoft, Google, IBM, and others. However, as people started using it, serverless became much more than just FaaS. Serverless systems today involve functions, containers, managed services provided by the cloud vendor (e.g., message queues, DBs, storage), and a vast variety of SaaS APIs (e.g., Auth0, Twilio, Stripe), all interacting with one another.
Due to the nature of these functions — limited running time, low memory, and no state, developers are encouraged to utilize more and more of these managed services. As the number of functions and APIs increase, so does the complexity of serverless applications. Modern applications are highly distributed (“nano-services”) and event-driven. On top of that, the lack of access to any server, and everything being stateless, doesn’t make things easier. Observability is a central challenge when trying to resolve issues quickly and preventing system downtime, as well as understanding performance and cost implications.
 Serverless system are distributed and event-driven
To overcome these challenge, developers and DevOps engineers have several options today for gaining observability into their systems. Each approach has pros and cons, and naturally — its sweet spots. Since AWS is the most popular platform for serverless today, many of the examples presented here are from AWS, but they can be applied in other cloud vendors.
1. “This is easy” — using the default cloud vendor console
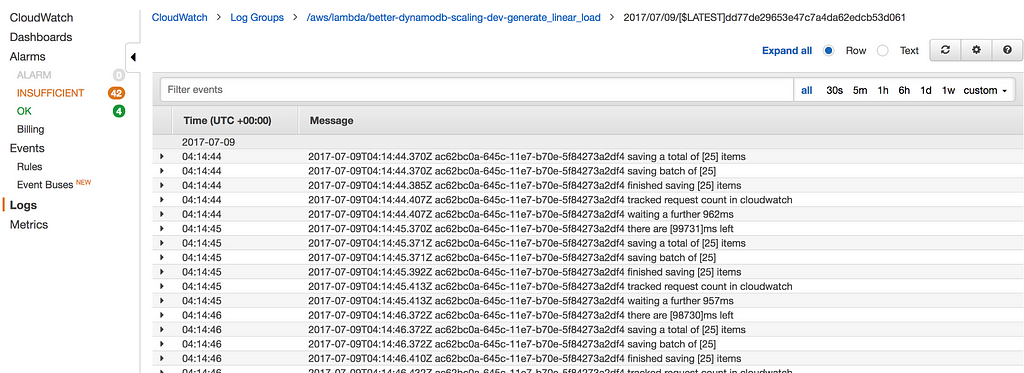
The cloud vendor’s console is the first and most direct approach to attempting to solve issues in your serverless system. AWS equips developers with CloudWatch, “a monitoring service for AWS cloud resources and the applications you run on AWS.” Anyone using AWS Lambda is well familiar with the CloudWatch console. There, you can find log groups for each of your functions, and each group contains all the logs of the function. The logs refresh asynchronously, and it can take any time from seconds to minutes for the logs to update.
Since most developers feel comfortable writing logs, it’s pretty straightforward to use. Just run your function, and take a look at the log. However, when things become a bit more complicated, i.e., in a distributed system with multiple functions, queues, triggers, and more, it can be quite challenging to understand the whole picture and connect all the different log items. Imagine a chain of 5 Lambda functions with triggers in between — not to mention the times you don’t remember to log everything. Azure and Google have a similar solution for logging from their FaaS services. The default console is great to start with, and indeed cannot be ignored. However, when crossing the 5 or 10 functions range, most teams quickly discover challenges in understanding their systems, and some even refer to it has “log hell.” Let’s explore some alternatives.
2. “Let’s go somewhere else!” — log streaming to an external service
When your serverless architecture evolves, and you’re going through logs, more logs, and some more logs, something suddenly doesn’t feel right. It shouldn’t be this way — should it? You’re spending all your time going through endless lists of lines, written from functions which run millions of times every day. It’s not practical, and it just doesn’t work anymore. Even if you found the correct error in the log, going backward and doing root-cause-analysis is nearly impossible.
What has been going on in all the message queues? Perhaps an external API is slowing your system down and causing your cloud bill to spike? There must be a better solution — right?
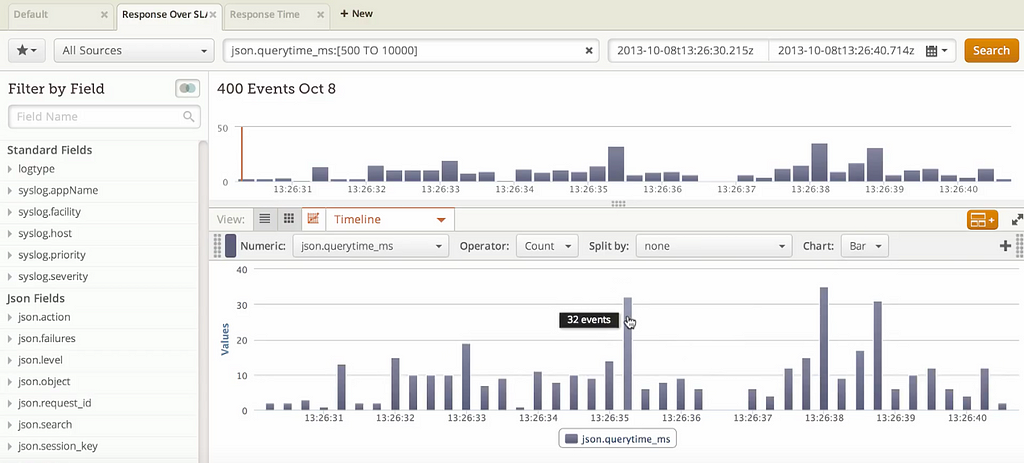
You probably heard about log aggregation platforms, such as Splunk, Loggly, and others. Some of them are great — they even automatically detect anomalies for you! In that case, why not stream all of your logs into such a service, and then quickly and easily search and filter everything there? No more manual log scrubbing? Hurray!
Disclaimer
The views and opinions expressed in this article are solely those of the authors and do not reflect the views of Bitcoin Insider. Every investment and trading move involves risk - this is especially true for cryptocurrencies given their volatility. We strongly advise our readers to conduct their own research when making a decision.

