Latest news about Bitcoin and all cryptocurrencies. Your daily crypto news habit.
 https://getstream.io/try-the-api/
First Things First
Here at Stream, we power activity feeds for 300+ million end users and love playing around with ways to utilize our product in all sorts of use cases. Most recently, we built Winds, an open-source RSS and Podcast application with a strong focus on UI and UX.
Shortly after we launched our second iteration of Winds, in late May of 2018, we started to see a major uptick in user signups. Most example apps, of course, don’t get this much traffic. Winds, however, went viral on Hacker News and Product Hunt. Up to that point, the example app code wasn’t very optimized. This blog post covers some quick beginner tips that can help you improve your app’s performance.
In this post, we’ll discuss how we decreased API call latency by optimizing our database schemas and adding caching, as well as touch on additional tools we implemented and improvements we made.
Visualizing & Optimizing API Calls
The first step to triaging an issue is understanding the underlying problem. This can be a daunting task if you’re not using the correct tools to help you visualize what’s going on in your codebase. For Winds, we utilize a combination of tools to gain better insight into what’s happening in our production environment, allowing us to pinpoint latency issues and bugs. Below is a quick rundown on which tools we use and why we love them.
New Relic
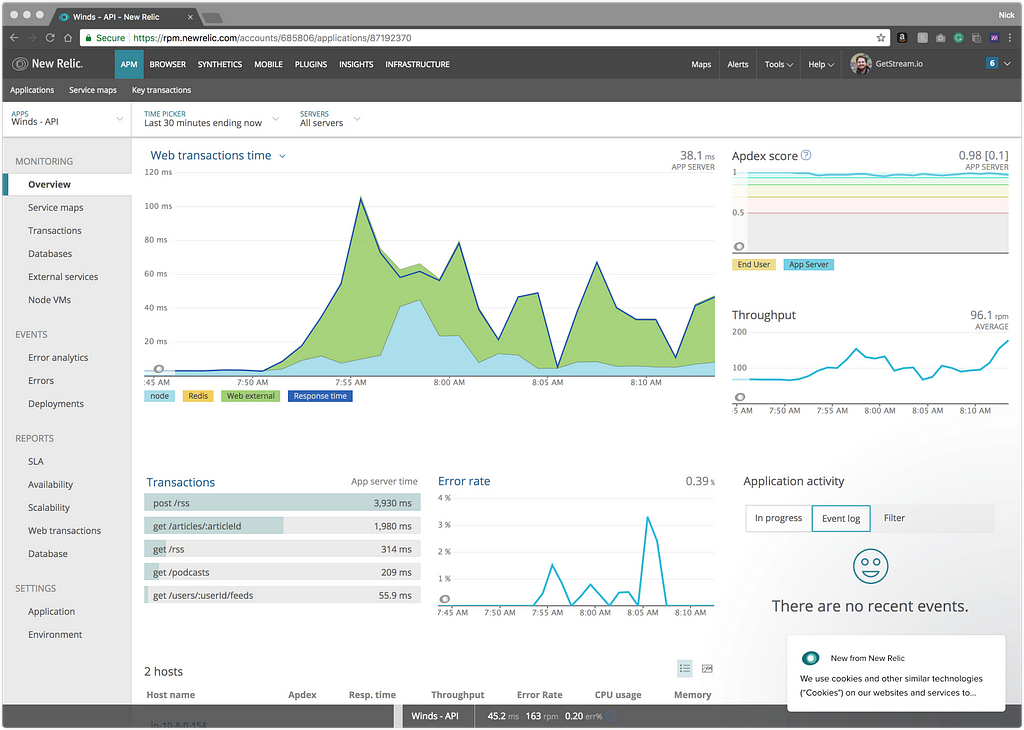
New Relic provides a comprehensive view of our request and response infrastructure, allowing our team to better understand and pinpoint slow routes. The implementation is extremely easy with Node.js (our language of choice) and other languages, alike — simply import the package and drop in your keys; New Relic takes it from there.
Here’s a screenshot of New Relic in the wild (you’ll notice we haven’t optimized our POST /rss endpoint yet — a perfect example of how New Relic allows us to see which endpoints need to be optimized).
Under “Transactions” in the screenshot above, you’ll see a list of routes. These are API routes and the time in milliseconds it takes to do a full round trip from the application to the API, database, and back. Having visibility into how long it takes for a roundtrip is super important for isolating slow response times.
VictorOps
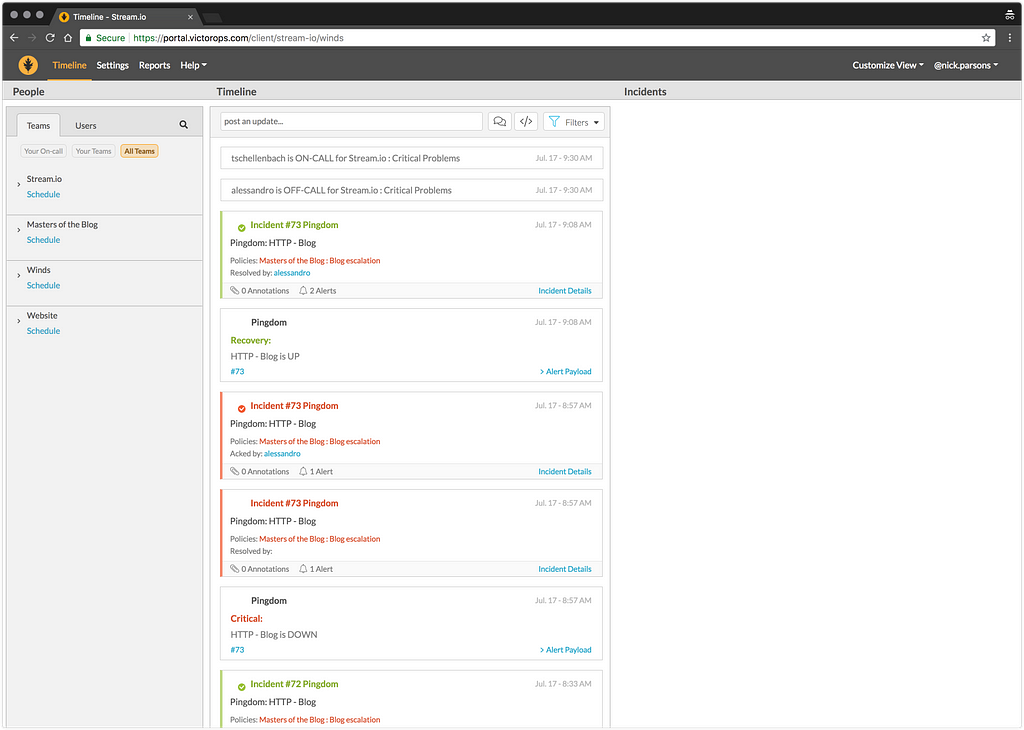
This tool is amazing. VictorOps allows our team to assign other team members to be “on-call”, and, if/when something goes wrong (like the API is down), VictorOps will ping the user on Slack and send an SMS message to get their attention. This process speeds up resolution time and allows everyone on the team to know if there is an issue going on with the application. Below is a screenshot of our account dashboard:
StatsD
Originally written by Etsy, StatsD is a set of tools that can be used to send, collect, and aggregate custom metrics from your application. The name refers to both the protocol used in the original daemon, as well as a collection of software and services that implement the protocol.
A StatsD system requires three components: a client, a server, and a backend. The client is a library that is invoked within our Winds application code to send metrics. These metrics are collected by the StatsD server.
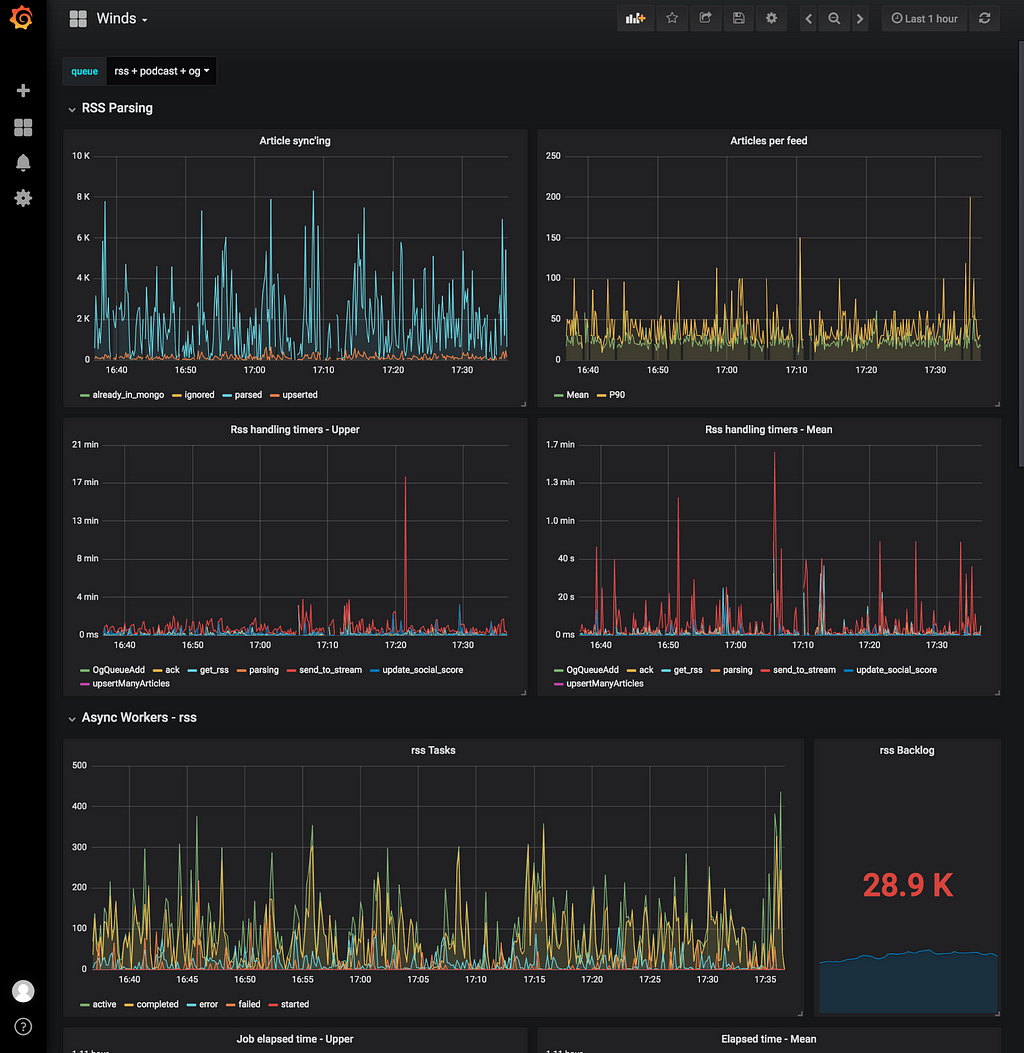
The server aggregates these metrics and then sends the aggregated data to a backend at regular intervals. The backends then perform various tasks with our data — for example, Grafana (shown in the Grafana section) is used to view real-time graphs of Winds workers (RSS, Podcasts, Open Graph, etc.) and other important infrastructure metrics.
For gathering data, we use a node library called node-statsd. Using the library, we’ve created a helper file to keep our code clean:
And we can call the util like this (everywhere a statsd comment is made):
It’s important to note that you can use the following metric types with StatsD:
- Counters — they represent a value over time or number of occurrences of a certain event (you can either set or increment/decrement). StatsD will calculate mean/average values, percentiles, etc.)
- Gauges — similar to counters, but instead of value over time it represents one value (latest data point available)
- Timers — like counters but for measuring the time that an operation took instead of how many times it occurred
Graphite
Graphite consists of three software components: Carbon, Whisper, and Graphite Web. Carbon is a high-performance service that listens for time-series data spit out by StatsD. Whisper is a simple database library for storing time-series data, and graphite-web is a Graphite’s user interface and API for render graphs and dashboards (though we don’t use Graphite Web for our projects, as we use Grafana).
To be more clear, metrics from StatsD are fed into the stack via the Carbon service, which writes the data out to Whisper databases for long-term storage. We then use the API provided by Graphite Web to visualize data in Grafana.
Detailed implementation and other information on Graphite can be found here.
Grafana
Grafana is the leading open-source software for time series analytics, which is why we chose to use it for Winds, and at Stream, in general. Grafana allows our team to query, visualize, alert on and understand Winds metrics retrieved from Graphite. It’s full of awesome visualization tools (as shown in the screenshot below), allowing our team to pick and choose how we want to display our data.
Optimizing Our MongoDB Database
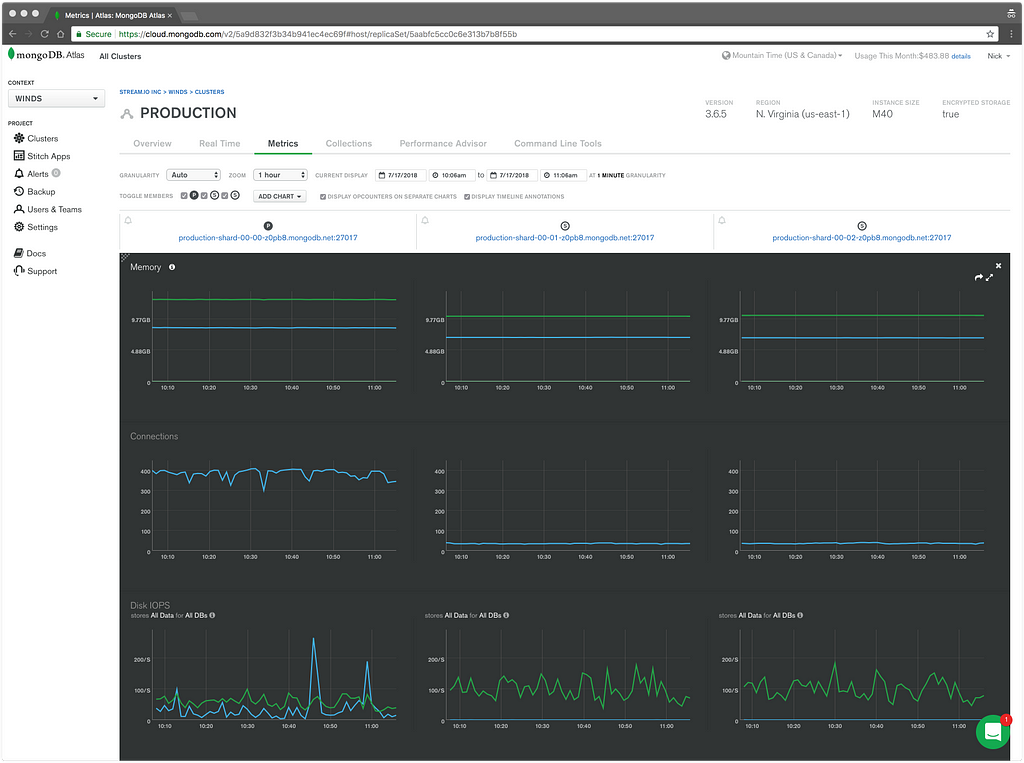
For our primary data store, we use MongoDB Atlas — a hosted version of MongoDB provided by MongoDB. This allows Winds to have a full replica set (3 servers) without having to manage them. The servers automatically upgrade and auto-patch themselves which is extremely convenient. MongoDB Atlas also performs regular backups and offers point-in-time backup of replica sets. Unfortunately, this luxury comes at a cost; however, it’s one that we’re willing to bear so that we can focus on improving the user experience of Winds.
Although MongoDB Atlas takes care of the heavy lifting of database management. That doesn’t mean it solves all problems. Documents need to be organized and indexed properly, and we need to ensure that we’re keeping reads and writes to a minimum so that we don’t use all of our allocated input/output operations per second (IOPS) and connections.
Index Usage
Incorrect indexes or no indexes at all are generally the number one cause for added latency in an application. Without indexes, MongoDB must perform a collection scan, i.e. scan every document in a collection, to select those documents that match the query statement.
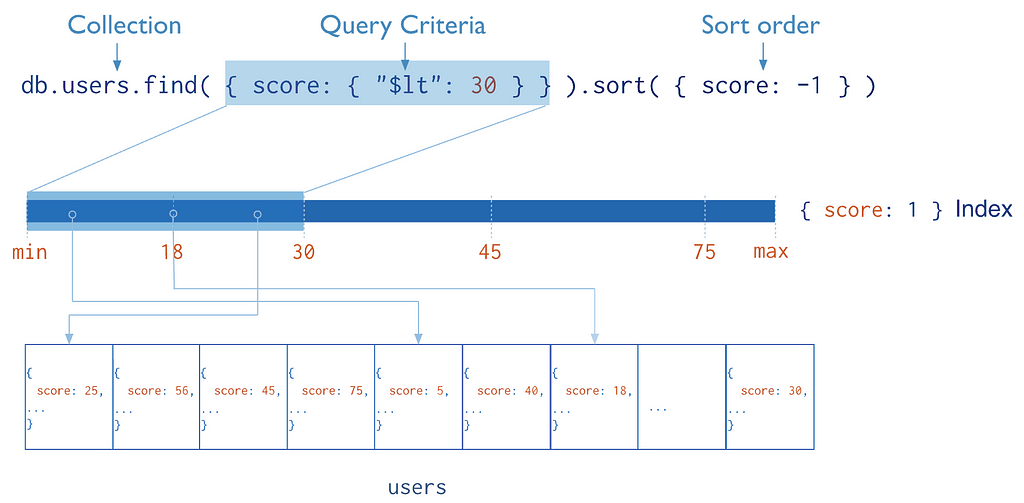
As described by MongoDB, indexes are special data structures that store a small portion of the collection’s data set in an easy-to-traverse form. The index stores the value of a specific field or set of fields, ordered by the value of the field. The ordering of the index entries supports efficient equality matches and range-based query operations. In addition, MongoDB can return sorted results by using the ordering in the index.
The following diagram illustrates a query that selects and orders the matching documents using an index:
Hashed Indexes
In Winds, we had nearly all of the proper indexes, however, we failed to recognize one major requirement/constraint in MongoDB. The total size of an index entry must be less than 1024 bytes. That’s not so hard to ensure… right? Well, the thing is, we index URLs to speed up the lookup process, and some of the URLs that enter the Winds API are more than 1024 bytes. This caused all sorts of unexpected errors.
After much research, we found a solution — hashed indexes. Hashed indexes maintain entries with hashes of the values of the indexed field. This meant that we could do a lookup on the same URL as before without worrying about its length AND still maintain integrity.
Note: MongoDB automatically computes the hashes when resolving queries using hashed indexes. Applications do not need to compute hashes.
Single Indexes
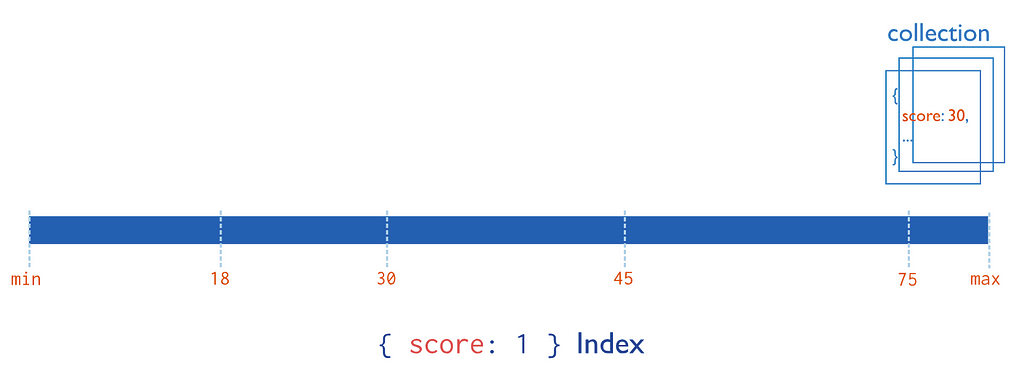
In addition to the default _id index, MongoDB supports the creation of user-defined ascending/descending indexes on a single field of a document. This is going to be your most used index type.
For a single-field index and sort operations, the sort order (i.e. ascending or descending) of the index key does not matter because MongoDB can traverse the index in either direction.
Compound Indexes
Similar to other databases, MongoDB supports compound indexes, where a single index structure holds references to multiple fields.
Note: You may not create compound indexes that have hashed index type. You will receive an error if you attempt to create a compound index that includes a hashed index field.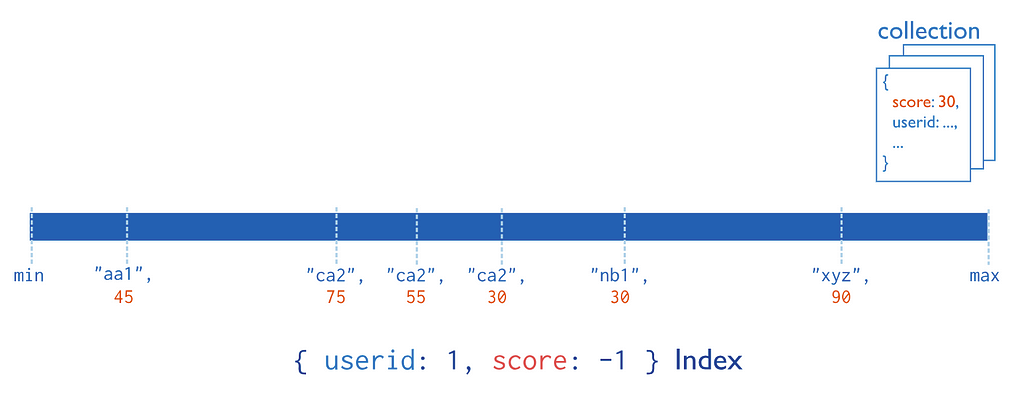
To create a compound index use an operation that resembles the following:
Or, if you’re using Mongoose, you will need to define the index at the schema level. Here’s an example:
Note: The above shows an example of adding a compound index, which is similar to adding a single index. The only difference is that with a single index, you only have one key with a value of 1 or -1.
The value of the field in the index describes the kind of index for that field. For example, a value of 1 specifies an index that orders items in ascending order. A value of -1 specifies an index that orders items in descending order.
Note: If you’re interested in an in-depth read on indexes in MongoDB, here’s a great resource. There’s also this wonderful SlideShare on indexing for performance.
Ensuring Indexes
One feature that MongoDB provides is the createIndex() operation. What this does is loops through every document in your database and “ensures” that it has the proper index. Many people fail to realize that this is a very tasking activity on the database, taking up precious CPU and memory, slowing down your database.
If you make updates to your indexes, you’ll need to run the createIndex() operation; however, we recommend doing this during off-peak hours when you’re database isn’t being hit with tons of requests/second.
To enable this feature in Mongoose, have a look at the documentation found here.
Note: If you’d like to read up on the createIndex() operation, MongoDB has extensive documentation on the topic.
Being Smart with Queries
Reducing queries to the database is the number one performance enhancement you can make. With New Relic, we found that a user signup route was extremely slow. A single signup API call turned into ~60 requests to the Stream API along with a couple calls to the database to fetch interests. After looking into the issue, we realized that we could do two things to reduce the total number of requests:
- Cache interests in Redis (coming up next), instead of making N number of API calls to the database for every user signup
- Batch API calls to third-party services such as Stream
Another common mistake is doing a simple query N times, instead of single query that reads all required records. When reading the feed from Stream we simply use the MongoDB $in operator to retrieve all of the articles with the id values stored in Stream.
Lean Queries
For our ODM, we used Mongoose, a feature packed and easy to use Node.js layer on top of the MongoDB driver. This allows us to enforce object models validation, casting, and business logic, which provides consistency throughout our APIs codebase. The only downside is that every query returns a heavy Mongoose Object with getter/setter methods and other Mongoose magic that we didn’t need at times.
To avoid the additional overhead sometimes seen in query responses, we used the lean() option on some of our queries. This resulted in a plain JavaScript object that could then be converted to JSON for the response payload. It’s as simple as doing something similar to the following:
The Explain Query
The $explain operator is extremely handy. As the name may suggest, it returns a document that describes the process and indexes used to return the query. This provides useful insight when attempting to optimize a query (e.g. what indexes to add to speed up the query).
This documentation on the $explain operator specifies how you can implement the query.
Redis
Redis is an in-memory data structure store. It can be used as a database, cache, and message broker. In my opinion, Redis is one of the most overlooked datastores out there — provided that it’s extremely flexible with what you can store. For Winds, we use it extensively as a cache to avoid unnecessary database lookups.
For example, during the signup step of Winds, we ask you what your interests are so that we can craft a user experience around what you like, using machine learning. This step used to require calls to the database to get the database ID so it could then be stored. Now, we simply store the interests as JSON and do a lookup against Redis instead. Because Redis stores everything in memory, it’s an extremely lightweight task with little to no added latency.
Here’s an example of how we store interests in Winds:
Some key takeaways for your applications:
Use Redis for:
- Storing popular and frequently queried data to keep database queries down (it’s far more efficient to query memory than have a database do a lookup against disk).
- Caching your data for the amount of time for which it will be valid (e.g. 60 minutes in our case for Winds) and using auto-expiration (this is by default).
- Associating your cache key with your application version number (e.g. interests:v2.0.0). This will force a re-cache when you deploy an update to your application, avoiding potential bugs and cache mismatches.
- Stringifying your data to ensure that it can be stored in Redis (it’s key value only and both must be a string.
Bull Queue
Bull is a fantastic queuing system that sits on top of Redis. We use Bull for our worker infrastructure in Winds, and have a couple of queues that we use to process (scrape) data:
- RSS
- Podcast
- Open Graph
Most importantly, we chose Bull for the following reasons:
- Minimal CPU usage due to a polling-free design
- Robust design based on Redis
- Delayed jobs
- Rate limiter for jobs
- Retries
- Priority
- Concurrency
- Multiple job types per queue
- Threaded (sandboxed) processing functions
- Automatic recovery from process crashes
We use a queuing mechanism for feeds and open-graph scraping because it separates the processes out so they don’t conflict without API performance. This is generally best practice as you don’t want your API hanging while you’re parsing 10,000 or more feeds every so often.
When building an API or app server, it’s important to step back and question whether or not a task is going to get in the way of your response times. Response times should be at most 250ms and even that number is slow. When in doubt, throw it into a queue and process it on a separate thread.
Note: Here’s a quick screenshot of our queue. This shows the number of active RSS, Podcast, and Open Graph jobs in the queue, along with their status. Bull provides all of this data via an API, allowing us to have a better insight into what’s going on behind the scenes. There are also other third-party UIs that you can use for monitoring such as Taskforce and Arena.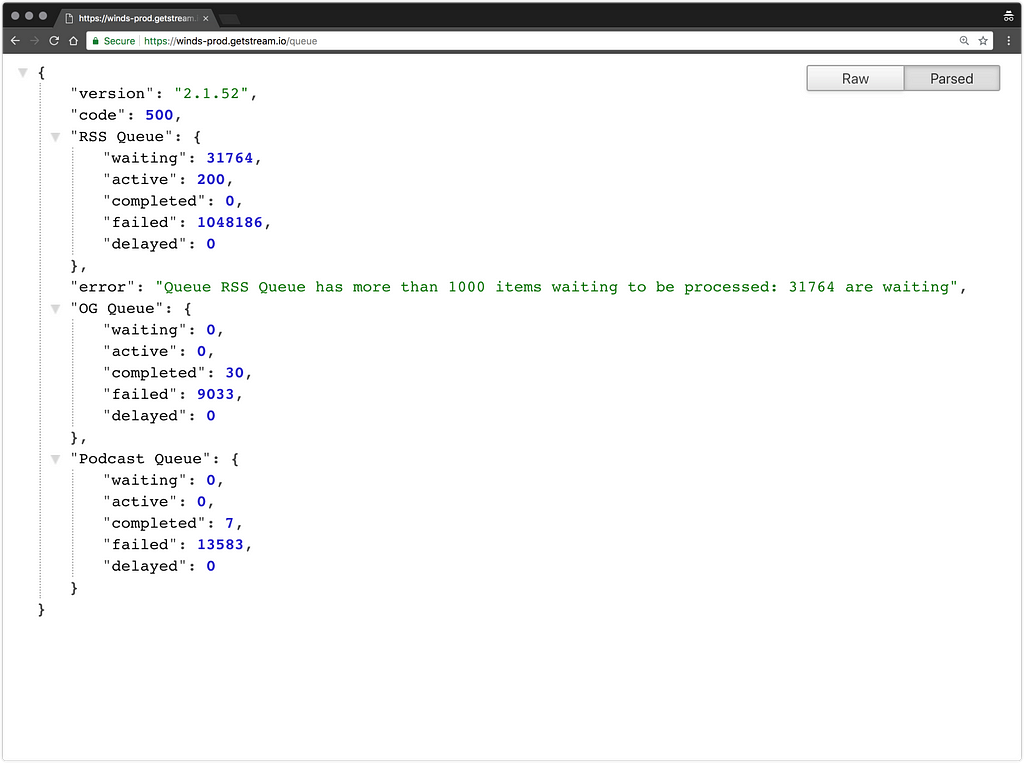
Use Dedicated Solutions
Similar to how Bull offloads processing burdens, it can be insanely valuable to use dedicated solutions to speed up your application. For example, we use our own service, Stream, to ensure that users are following the necessary feeds and receiving updates when they are put into the system. Building this from scratch would take months, if not years; however, by using a service, we were able to implement in hours.
Another third-party service that we love is Algolia. Algolia powers our search functionality in Winds, making lookups lightning fast (less than 50ms lookup times). While we could build search ourselves with a dedicated endpoint and a fancy MongoDB query, there’s no way that we would be able to scale the search functionality and maintain the same speed Algolia provides, and it would eat up precious API resources while it a user is performing a search.
Both these solutions far outperform what you can build in-house using a general purpose database.
Final Thoughts
We hope you enjoyed this list of basic tips for improving your Node app’s performance. Most real-world performance problems are caused by simple things. This post listed a few common solutions:
- APM tools such as New Relic, StatsD, and Grafana
- Index usage & Query optimization
- Redis & Caching
- Async Tasks
- Using specialized data stores for search and feeds
If you’re looking for more advanced topics check out the post about how Stream uses RocksDB, Go and Raft to power the feeds for over 300 million users.
If you’re building an application that requires newsfeeds or activity feeds, have a look at Stream. We have a 5-minute tutorial that will walk you through the various use-cases that we cover. The API tutorial can be found here.
Should you have any questions, please drop them in the comments below. And if you’re interested in following me on Twitter, my handle is @nickparsons.
Happy coding!
Simple Steps to Optimize Your App Performance with MongoDB, Redis, and Node.js was originally published in Hacker Noon on Medium, where people are continuing the conversation by highlighting and responding to this story.
Disclaimer
The views and opinions expressed in this article are solely those of the authors and do not reflect the views of Bitcoin Insider. Every investment and trading move involves risk - this is especially true for cryptocurrencies given their volatility. We strongly advise our readers to conduct their own research when making a decision.
