Latest news about Bitcoin and all cryptocurrencies. Your daily crypto news habit.
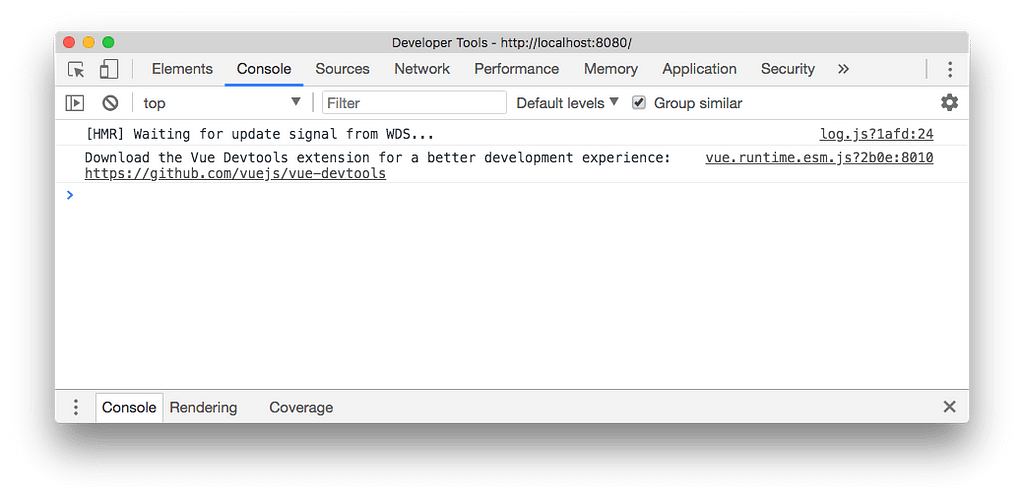
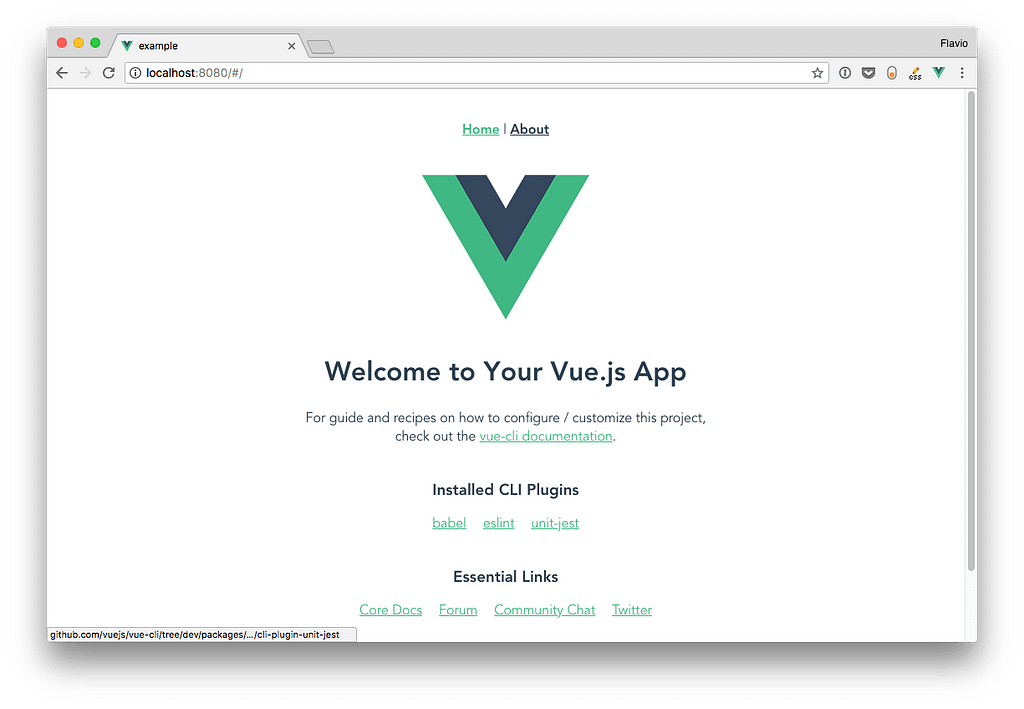
When you’re first experimenting with Vue, if you open the Browser Developer Tools you will find this message: “Download the Vue Devtools extension for a better development experience: https://github.com/vuejs/vue-devtools“
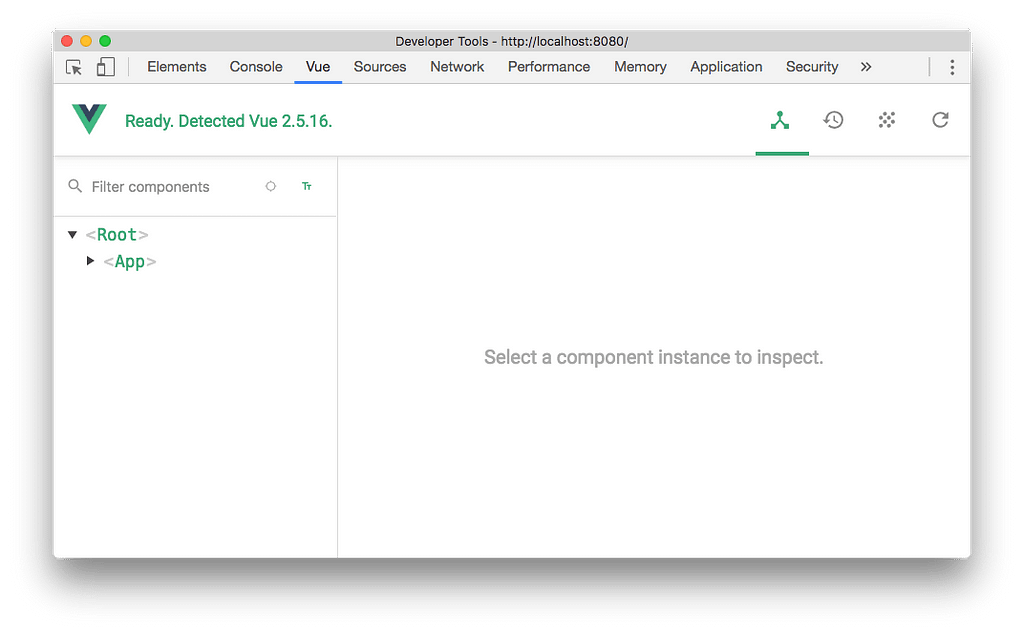
This is a friendly reminder to install the Vue Devtools Extension. What’s that? Any popular framework has its own devtools extension, which generally adds a new panel to the browser developer tools that is much more specialized than the ones that the browser ships by default. In this case, the panel will let us inspect our Vue application and interact with it.
This tool will be an amazing help when building Vue apps. The developer tools can only inspect a Vue application when it’s in development mode. This makes sure no one can use them to interact with your production app (and will make Vue more performant because it does not have to care about the devtools)
Let’s install it!
There are 3 ways to install the Vue Dev Tools:
- on Chrome
- on Firefox
- as a standalone application
Safari, Edge and other browsers are not supported with a custom extension, but using the standalone application you can debug a Vue.js app running in any browser.
Install on Chrome
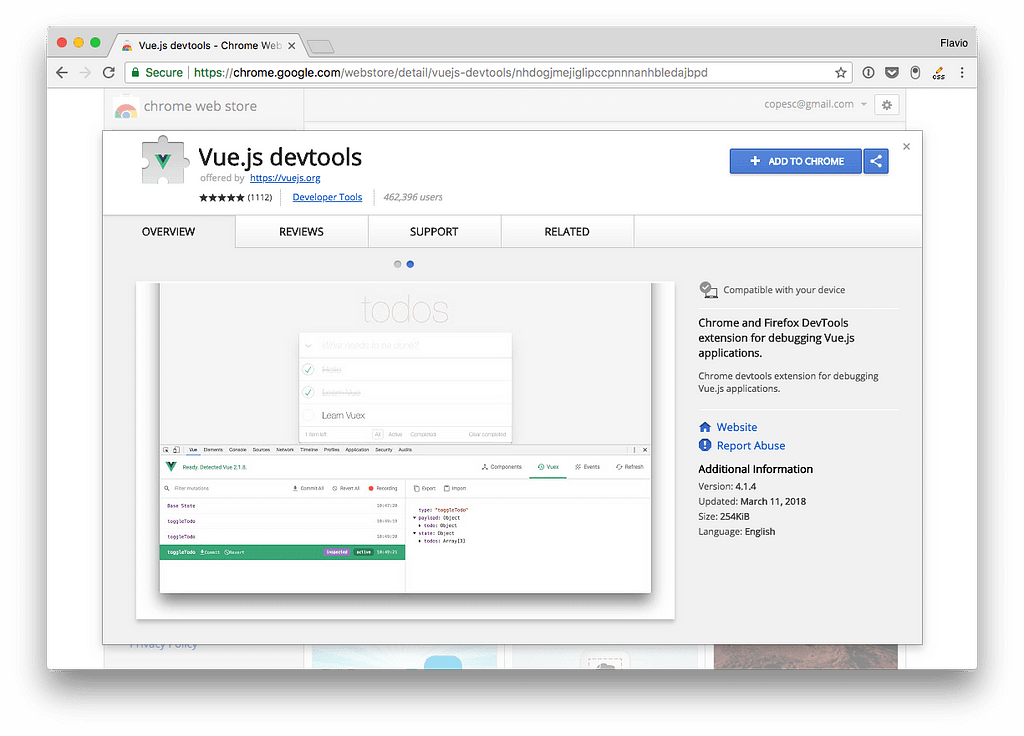
Go to this page on the Google Chrome Store: https://chrome.google.com/webstore/detail/vuejs-devtools/nhdogjmejiglipccpnnnanhbledajbpd and click Add to Chrome.
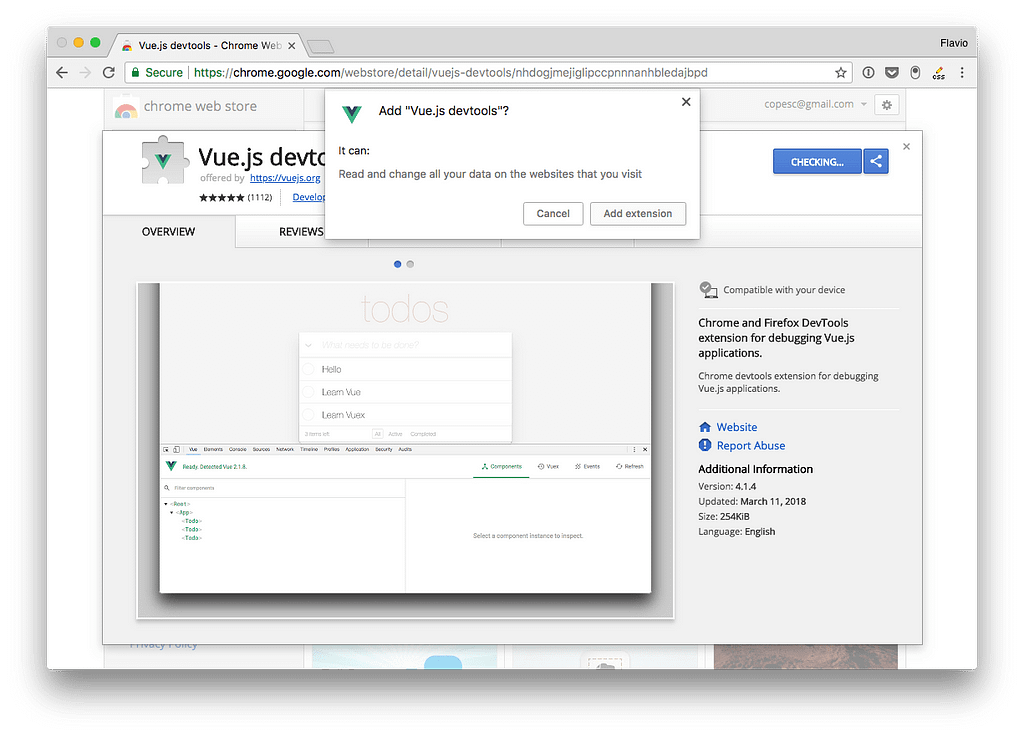
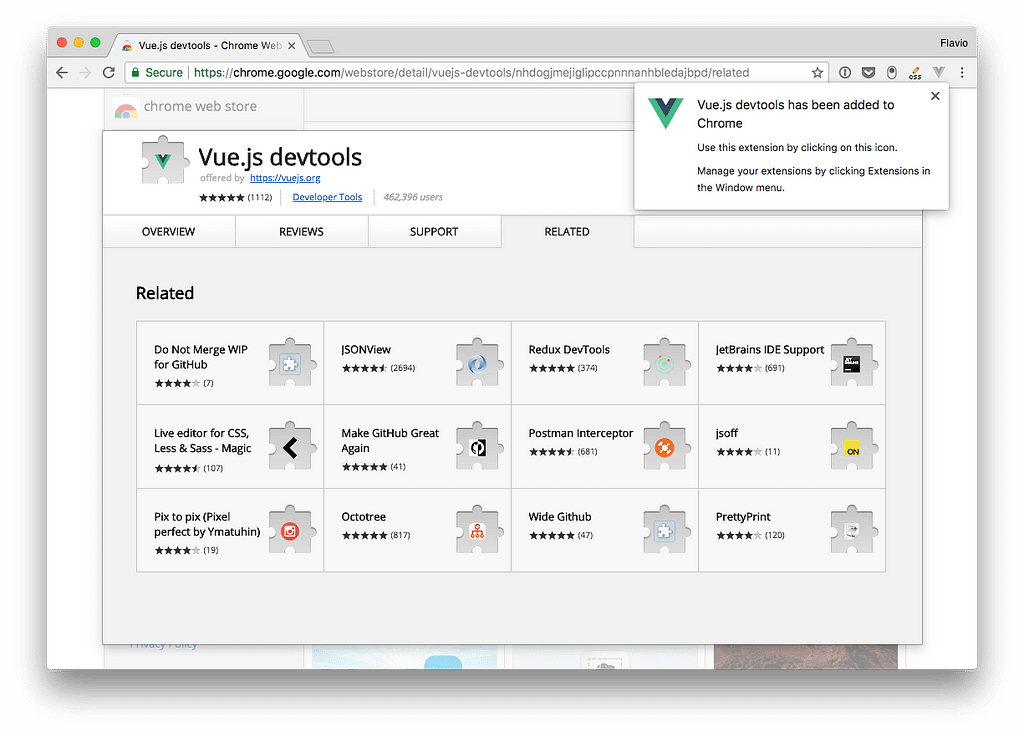
Go through the installation process:
The Vue.js devtools icon shows up in the toolbar. If the page does not have a Vue.js instance running, it’s grayed out.
If Vue.js is detected, the icon has the Vue logo colors.
The icon does nothing except showing us that there is a Vue.js instance. To use the devtools, we must open the Developer Tools panel, using “View → Developer → Developer Tools”, or Cmd-Alt-i
Install on Firefox
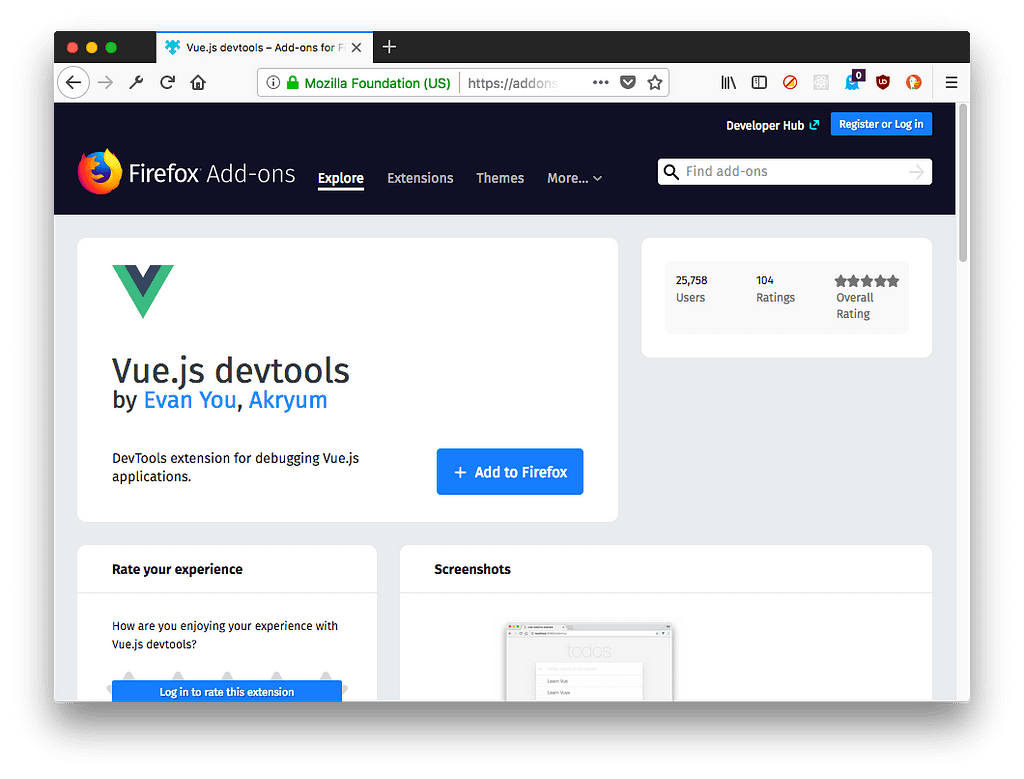
You can find the Firefox dev tools extension in the Mozilla addons store: https://addons.mozilla.org/en-US/firefox/addon/vue-js-devtools/
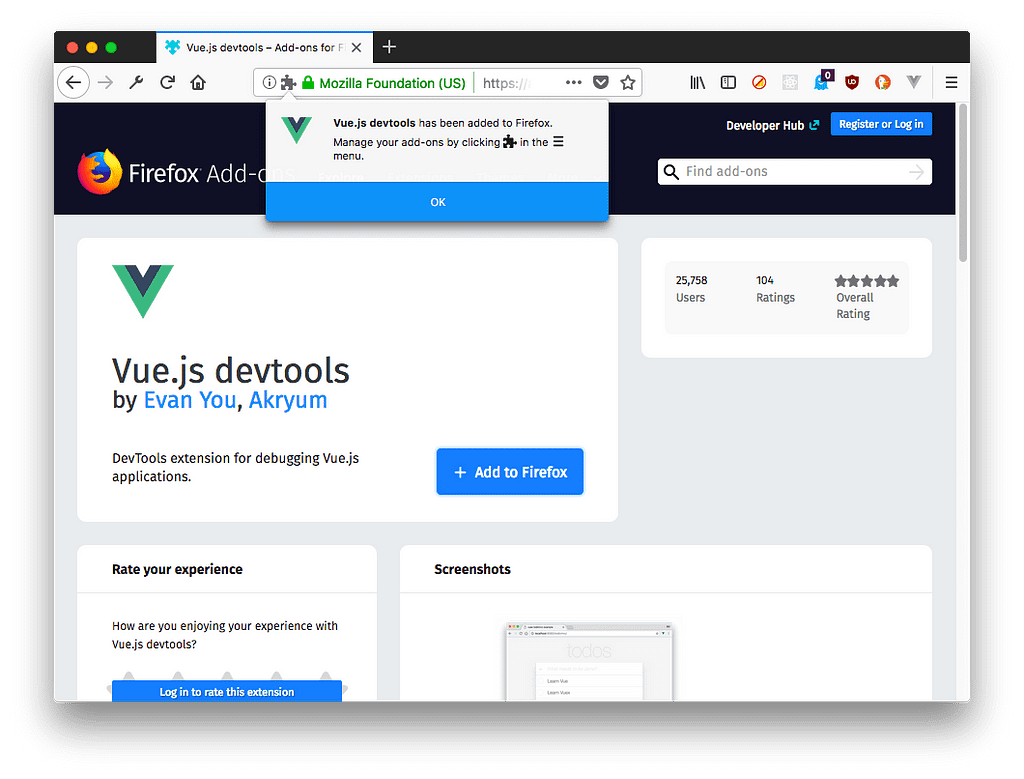
Click “Add to Firefox” and the extension will be installed. As with Chrome, a grayed icon shows up in the toolbar
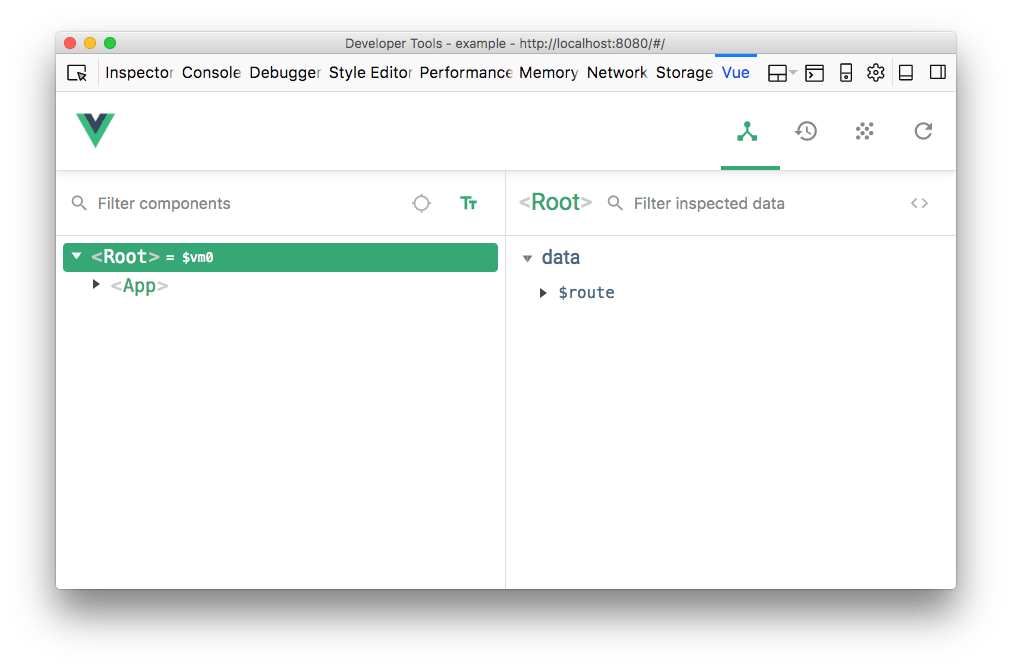
And when you visit a site that has a Vue instance running, it will become green, and when we open the Dev Tools we will see a “Vue” panel:
Install the standalone app
Alternatively you can use the DevTools standalone app.
Simply install it using
npm install -g @vue/devtools
//or
yarn global add @vue/devtools
and run it by calling
vue-devtools
This will open the standalone Electron-based application.
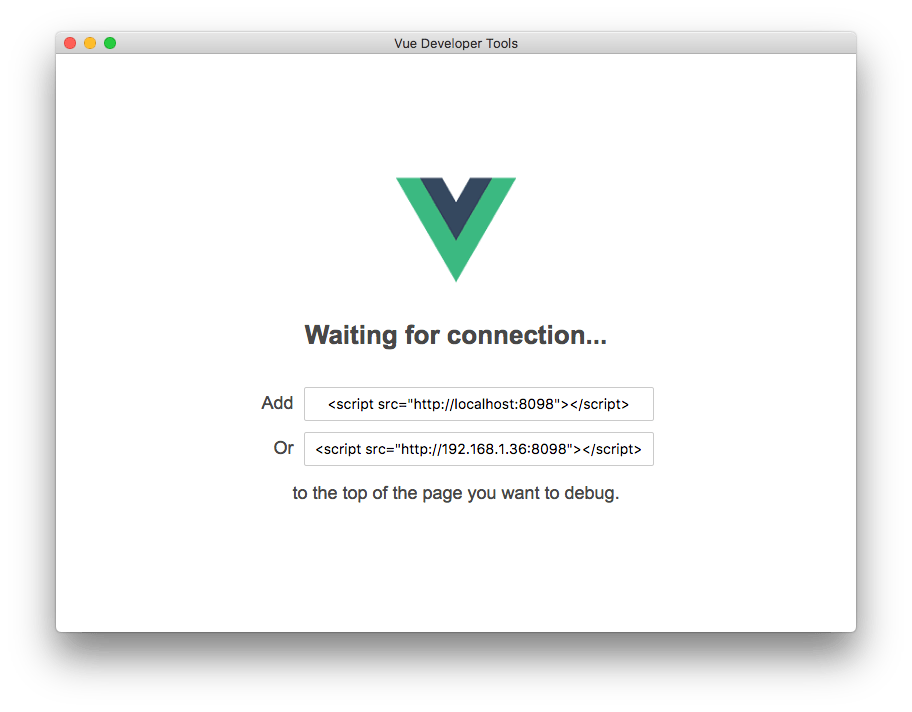
now, paste the script tag it shows you:
<script src="http://localhost:8098"></script>
inside the project index.html file, and wait for the app to be reloaded, and it will automatically connect to the app:
How to use the Developer Tools
As mentioned, the Vue DevTools can be activated by opening the Developer Tools in the browser, and moving to the Vue panel.
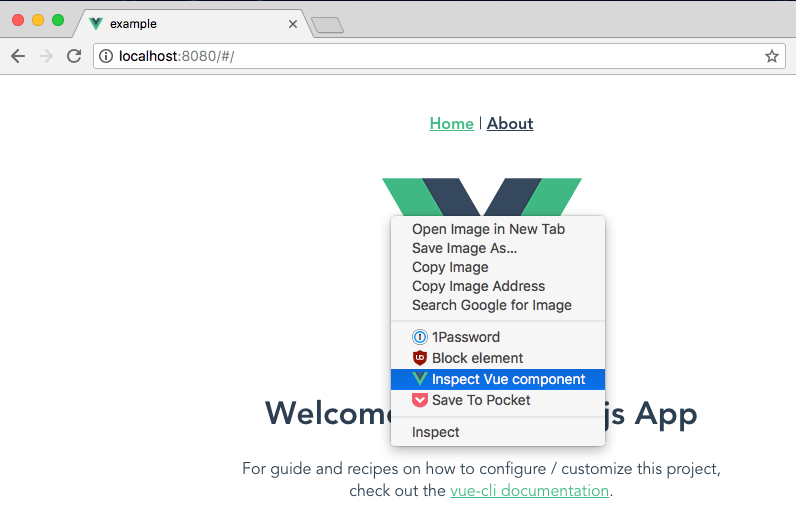
Another option is to right-click on any element in the page, and choose “Inspect Vue component”:
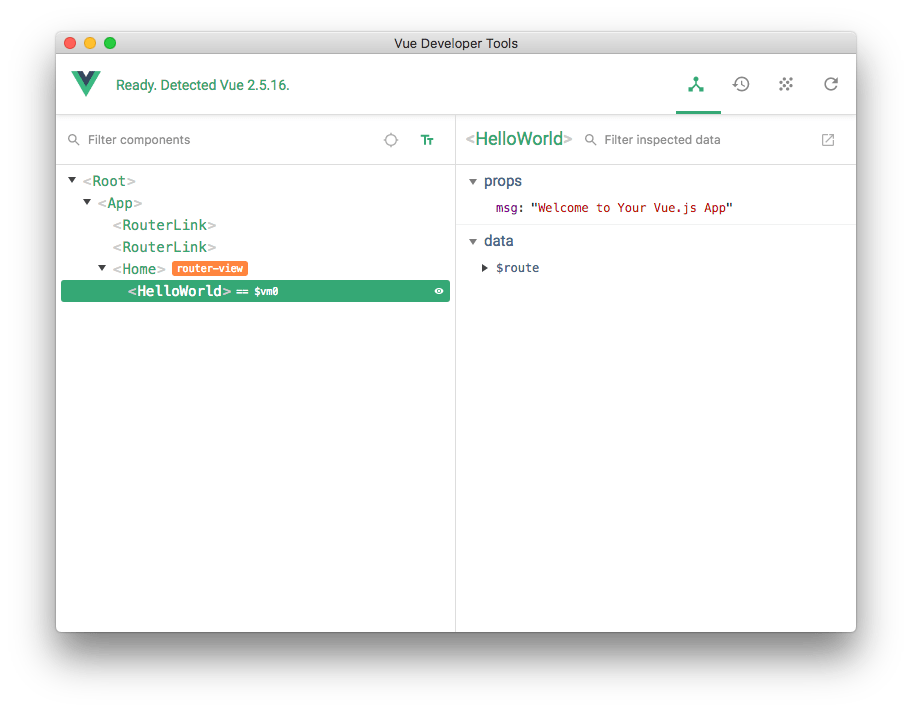
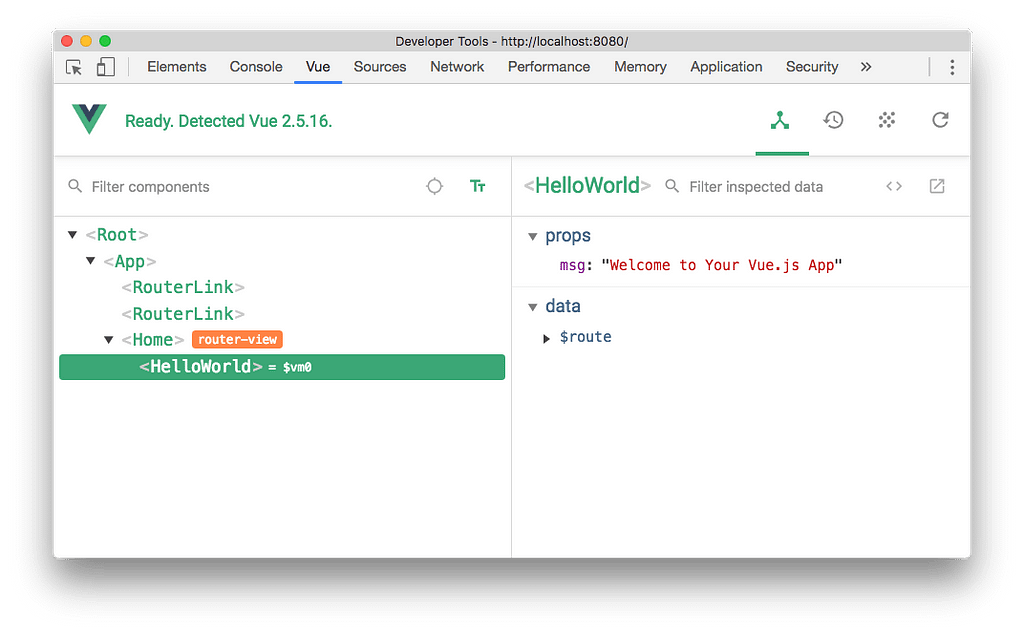
When the Vue DevTools panel is open, we can navigate the components tree. When we choose a component from the list on the left, the right panel shows the props and data it holds:
On the top there are 4 buttons:
- Components (the current panel), which lists all the component instances running in the current page. Vue can have multiple instances running at the same time, for example it might manage your shopping cart widget and the slideshow, with separate, lightweight apps.
- Vuex is where you can inspect the state managed through Vuex.
- Events shows all the events emitted
- Refresh reloads the devtools panel
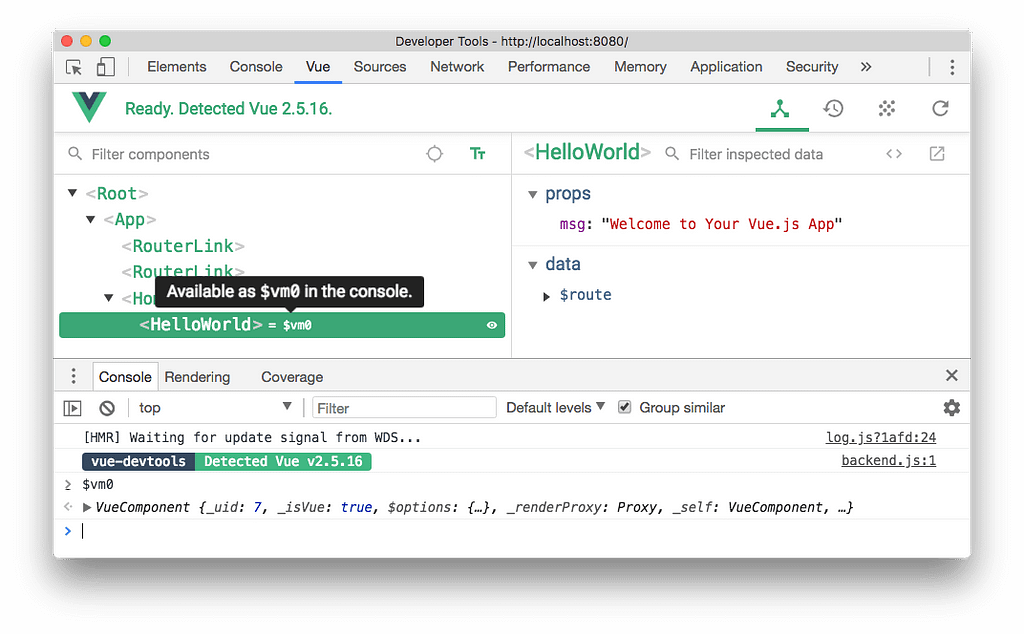
Notice the small = $vm0 text beside a component? It’s a handy way to inspect a component using the Console. Pressing the “esc” key shows up the console in the bottom of the devtools, and you can type $vm0 to access the Vue component:
This is very cool to inspect and interact with components without having to assign them to a global variable in the code.
Manage data
You can edit the components state directly by modifying the
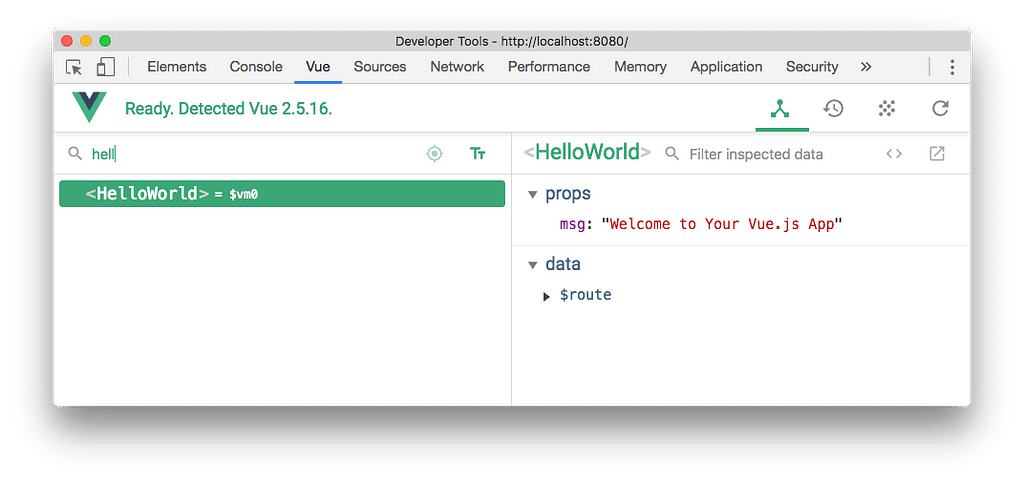
Filter components
Start typing a component name, and the components tree will filter out the ones that don’t match.
Select component in the page
Click the
button and you can hover any component in the page with the mouse, click it, and it will be opened in the devtools.
Format components names
You can choose to show components in camelCase or using dashes.
Filter inspected data
On the right panel you can type any word to filter the properties that don’t match it.
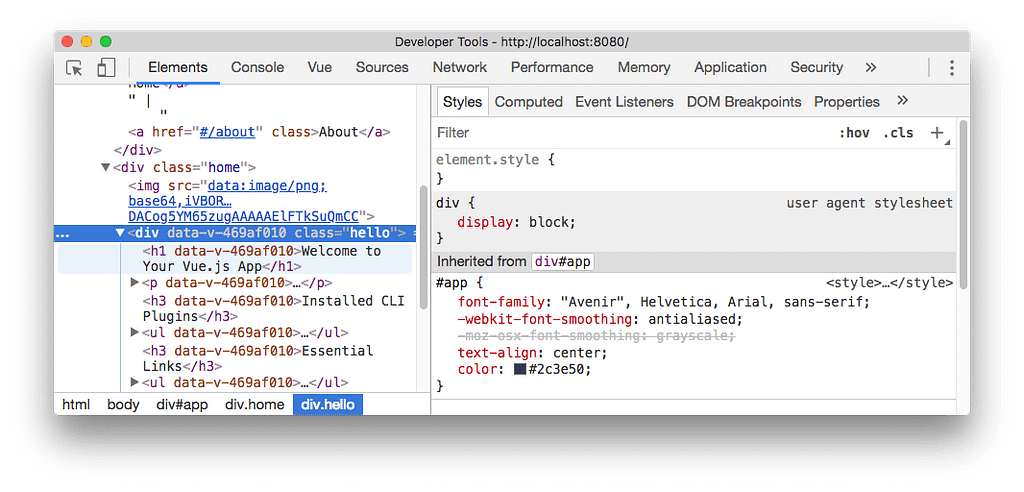
Inspect DOM
Click the Inspect DOM button to be brought to the DevTools Elements inspector, with the DOM element generated by the component:
Open in editor
Any user component (not framework-level components) has a button that opens it in your default editor. Very handy.
I’m going to learn Vue full-time for 2 months, and I’ll create a resource for you to learn it quickly as well, with tutorials and projects, working examples and screencasts. I will send you the free content I create 👨🏼💻 and I will keep you up to date with the course and offer you a big discount when the course is released. Stay in the loop!
Learn Vue.js with me! 👱🏼
I’m going to learn Vue.js full-time for 2 months, and I’ll create a resource for you to learn it quickly as well, with tutorials and projects, working examples and screencasts.
I will send you the free content I create 👨🏼💻 and I will keep you up to date with the course and offer you a big discount when the course is released. Stay in the loop, sign up here: https://flaviocopes.com/course/vue/ 🔥
How to use the Vue.js DevTools was originally published in Hacker Noon on Medium, where people are continuing the conversation by highlighting and responding to this story.
Disclaimer
The views and opinions expressed in this article are solely those of the authors and do not reflect the views of Bitcoin Insider. Every investment and trading move involves risk - this is especially true for cryptocurrencies given their volatility. We strongly advise our readers to conduct their own research when making a decision.
