Latest news about Bitcoin and all cryptocurrencies. Your daily crypto news habit.
Diving into Prisma’s CDP Stablecoin mkUSD and its associated risks

With the rapid adoption of ETH Liquid Staking Tokens (LSTs) post Shapella fork, there has been an explosion of Collateral Debt Position (CDP) protocols where users can use LSTs as collateral to mint stablecoins. Most of these protocols are an adaptation from the Liquity protocol to allow LSTs instead of only ETH. This has unlocked capital efficiency across the market as LST holders can continue earning their staking yields while unlocking their capital in the form of stablecoins. Prisma has combined the Liquity design with veTokenomics mechanisms to actively incentivize users to maintain healthy levels of collateral and minted mkUSD which has been a key element to Prisma’s success in bootstrapping liquidity in the protocol.
Prisma Risk Overview
Prisma Finance is one of these new CDP protocols and has gained significant traction over the past year for its vault design and in depth risk reports that it publishes on each newly accepted collateral.
CDP protocols are complex and have multiple economic risks as highlighted in ITB’s CDP risk article. With the new launch of ITB’s Risk Radar for Prisma, partnered with their existing extensive risk research, Prisma is high on the list of protocols helping users understand risk. The 12 metrics created for Prisma’s Risk Radar provide a deep understanding of the risks prevalent across all CDP protocols, as well as risk indicators specific to understanding Prisma’s design mechanics.
Peg Risks
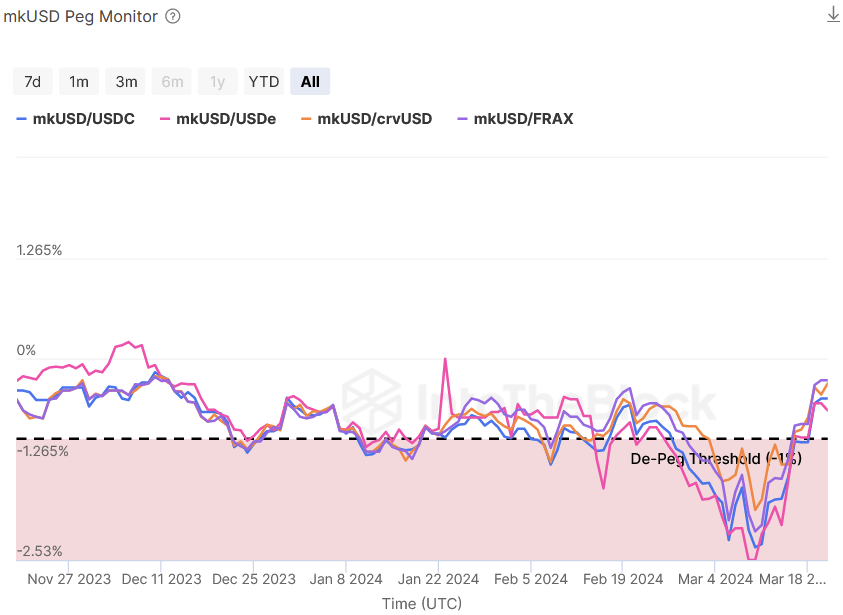
The most important economic risk when utilizing stablecoins, de-pegging events create situations that often drive a chain of multiple risks such as liquidations and impermanent loss to occur. The mkUSD Peg Monitor helps track the mkUSD peg against multiple other stablecoins. By tracking multiple stablecoins this provides insights into the robustness of the peg across multiple AMM pools and helps to isolate when there are certain events that only affect one stablecoin pairing.

mkUSD Peg Monitor. Source: IntoTheBlock Risk Radar
The chart above highlights mkUSD has been slightly depegged for the last month with a larger depeg occurring in the first weeks of March. CDP stablecoins can be susceptible to such depegs especially in bullish markets as vault owners increase sell pressure on the stablecoin by minting more, as their collateral value increases, and selling it in the market for other assets such as BTC or ETH. This type of depeg will often revert as collateral prices drop and users repay their minted stables to avoid liquidations.
Collateral Risks
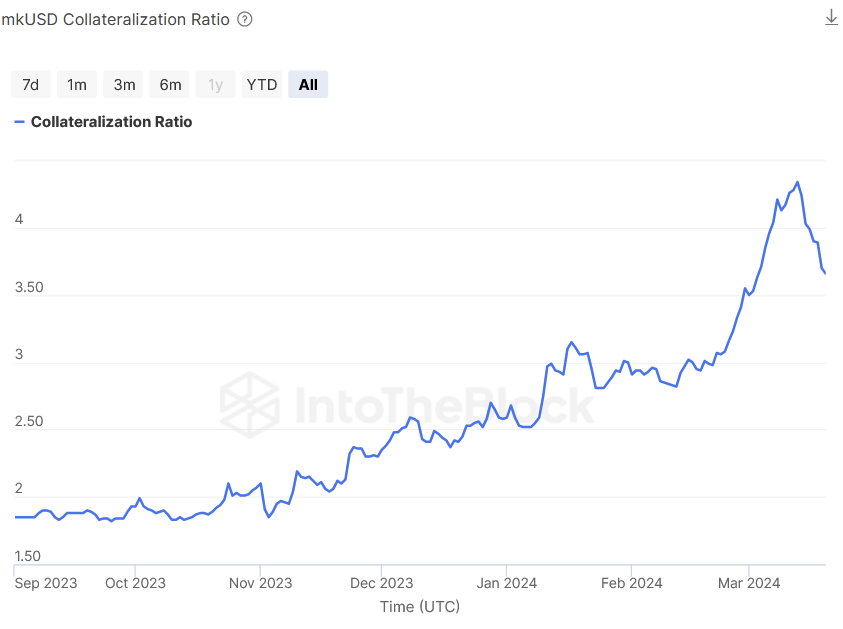
A strong indicator to interpret the overall health of the protocol and its potential exposure to a supply shock due to liquidations is the global collateralization ratio of the stablecoin. Specifically to Prisma, the mkUSD Collateralization Ratio tracks the total collateral supplied to the protocol in relation to the total amount of mkUSD that has been minted.
In the case of Prisma, the collateralization ratio is exceptionally important due to the Recovery Mode mechanism the protocol has in place. The Recovery Mode is implemented if the Global Total Collateral Ratio (GTCR) falls below 1.5 (150%). In the event of this happening, to prevent situations of bad debt and mkUSD not being fully backed, any positions that have lower than 1.5 collateralization ratio are opened to liquidations. Therefore, tracking the mkUSD Collateralization Ratio can help users understand the global risks of the protocol and how they are exposed to this risk.

mkUSD Collateralization Ratio. Source: IntoTheBlock Risk Radar
The chart above shows that the collateralization ratio across all vaults in Prisma is relatively high, with over 3.5 times the collateral backing each mkUSD. If this ratio were to drop precipitously and begin approaching a ratio of two or lower, vault users would want to evaluate their collateral ratio with respect to the global ratio to understand if they would be exposed to liquidations if the protocol enters Recovery Mode.
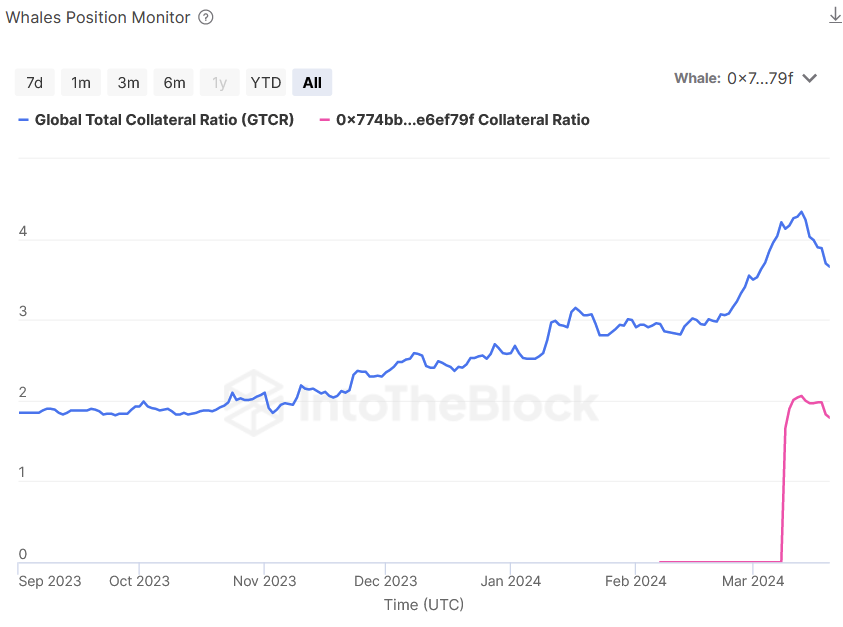
Another indicator that further breaks down the potential risks and supply volatility that would occur in the event of Recovery Mode being triggered is the Whales Position Monitor indicator. This indicator charts a specific whale’s collateral ratio in respect to the global collateral ratio. Monitoring the whale’s positions can help a user determine the potential large liquidations that could occur. Whale liquidations would substantially reduce the supply of circulating mkUSD. While most of these liquidations would ideally be covered by Prisma’s Stability Pool assets, if enough whales are liquidated this could trigger an event where the Stability Pool is depleted.

Whales Position Monitor. Source: IntoTheBlock Risk Radar
The whale address highlighted in this chart provides a good example of a whale to monitor. Though they are currently above the 1.5 Recovery Mode ratio, if the prices of collateral continue to decline as the trend shows, they could quickly drop below that point without some intervention from the address owner.
Slippage Risks
Slippage fees in AMM pools can greatly impact the viability of the pool to be used for swapping in between different assets. If the pool is imbalanced or has low liquidity, slippage can climb quickly as users try to make larger swaps. High slippage can impact the usability of the stablecoin and prevent supply growth as users are less inclined to buy the stablecoin on the market. Additionally, vault owners that have minted mkUSD and swapped it for another asset need to quickly reverse the trade to pay off their position will be greatly impacted by the slippage.
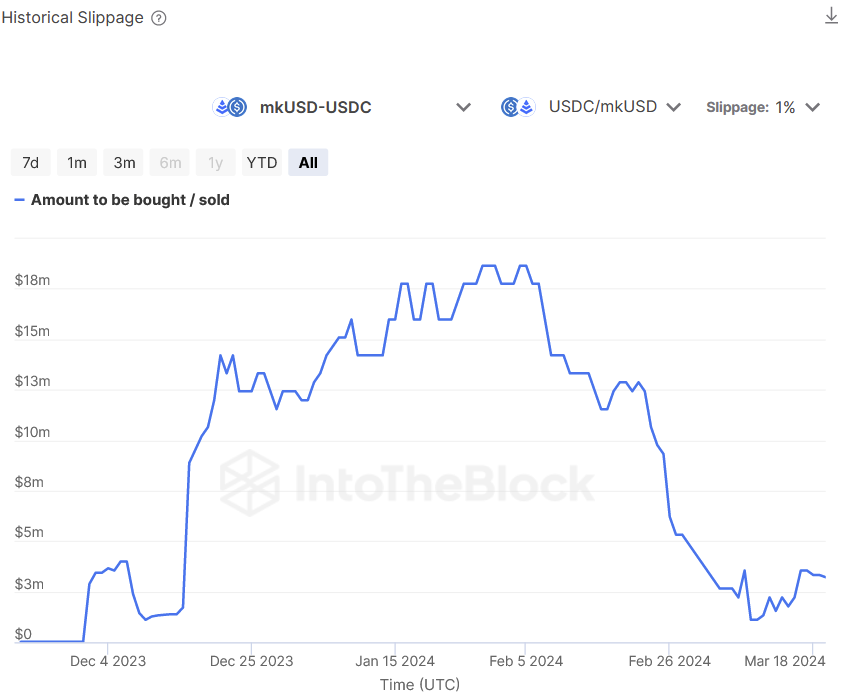
The Historical Slippage indicator helps monitor a pool’s capacity to handle swaps while staying below a certain slippage percent.

Historical Slippage. Source: IntoTheBlock Risk Radar
Here we see the mkUSD-USDC pool on Curve under the parameter settings of maximum 1% slippage and trading from USDC into mkUSD. From the chart we can see that the capacity of this trade used to be significantly higher than now, but the capacity has recently begun to grow again to just above $3 million. For a user who plans to mint mkUSD and trade it for another asset (like USDC) it is important to check what these swap capacities are going both directions and monitor how they evolve over time. This can help you dictate the size of the position that you decided to take while reducing your exposure to slippage fees.
Prisma Risk Radar Review
The Prisma protocol has developed a likely enduring stablecoin that can help users increase the capital efficiency of their LSTs while still holding on to them to keep upside price exposure and continue earning staking rewards. Though stablecoins are in theory supposed to be stable, it is a complex engineering feat to maintain a peg. The Prisma Risk Radar helps users monitor these types of risks to avoid capital loss through depegging events or liquidations.
The indicators used in this dashboard are based on the metrics used in our quant strategies to manage and mitigate risk for capital deployments into DeFi from large institutions and treasuries in the ecosystem. Our aim is to provide a comprehensive overview of economic risks in DeFi and we encourage any protocol or user to reachout to us for future collaboration or feedback on our existing dashboards.
About the IntoTheBlock DeFi Risk Radar
IntoTheBlock’s newly launched DeFi Risk Radar is a sophisticated tool for institutional-grade risk management in the DeFi sector. Developed through rigorous testing and partnerships, it addresses the significant economic risks within DeFi that have contributed to nearly $60 billion in losses.
The Risk Radar today supports twelve key DeFi protocols and offers tailored economic risk metrics, high data granularity, an intuitive API and CSV data download functionality. IntoTheBlock’s expertise, gained from years of working with the largest institutions in crypto, strengthened the development of this tool, aimed at enhancing risk analysis and management in the DeFi markets. Additionally, we expect to release more protocols in 2024, expanding the scope and efficacy of our risk management solution.
If you want to know more about Risk in DeFi, We recommend downloading our latest report, which explores DeFi risk in detail.
Additional general analytics on more CDP protocols can be found in our CDP Perspectives dashboard.
Exploring the Spectrum of Risks on Prisma was originally published in IntoTheBlock on Medium, where people are continuing the conversation by highlighting and responding to this story.
Disclaimer
The views and opinions expressed in this article are solely those of the authors and do not reflect the views of Bitcoin Insider. Every investment and trading move involves risk - this is especially true for cryptocurrencies given their volatility. We strongly advise our readers to conduct their own research when making a decision.