Latest news about Bitcoin and all cryptocurrencies. Your daily crypto news habit.
Here’s how the current Bitcoin price compares against the previous cycles when they were at similar phases in their lifespan.
Current Bitcoin Cycle Appears To Line Up With Previous Ones
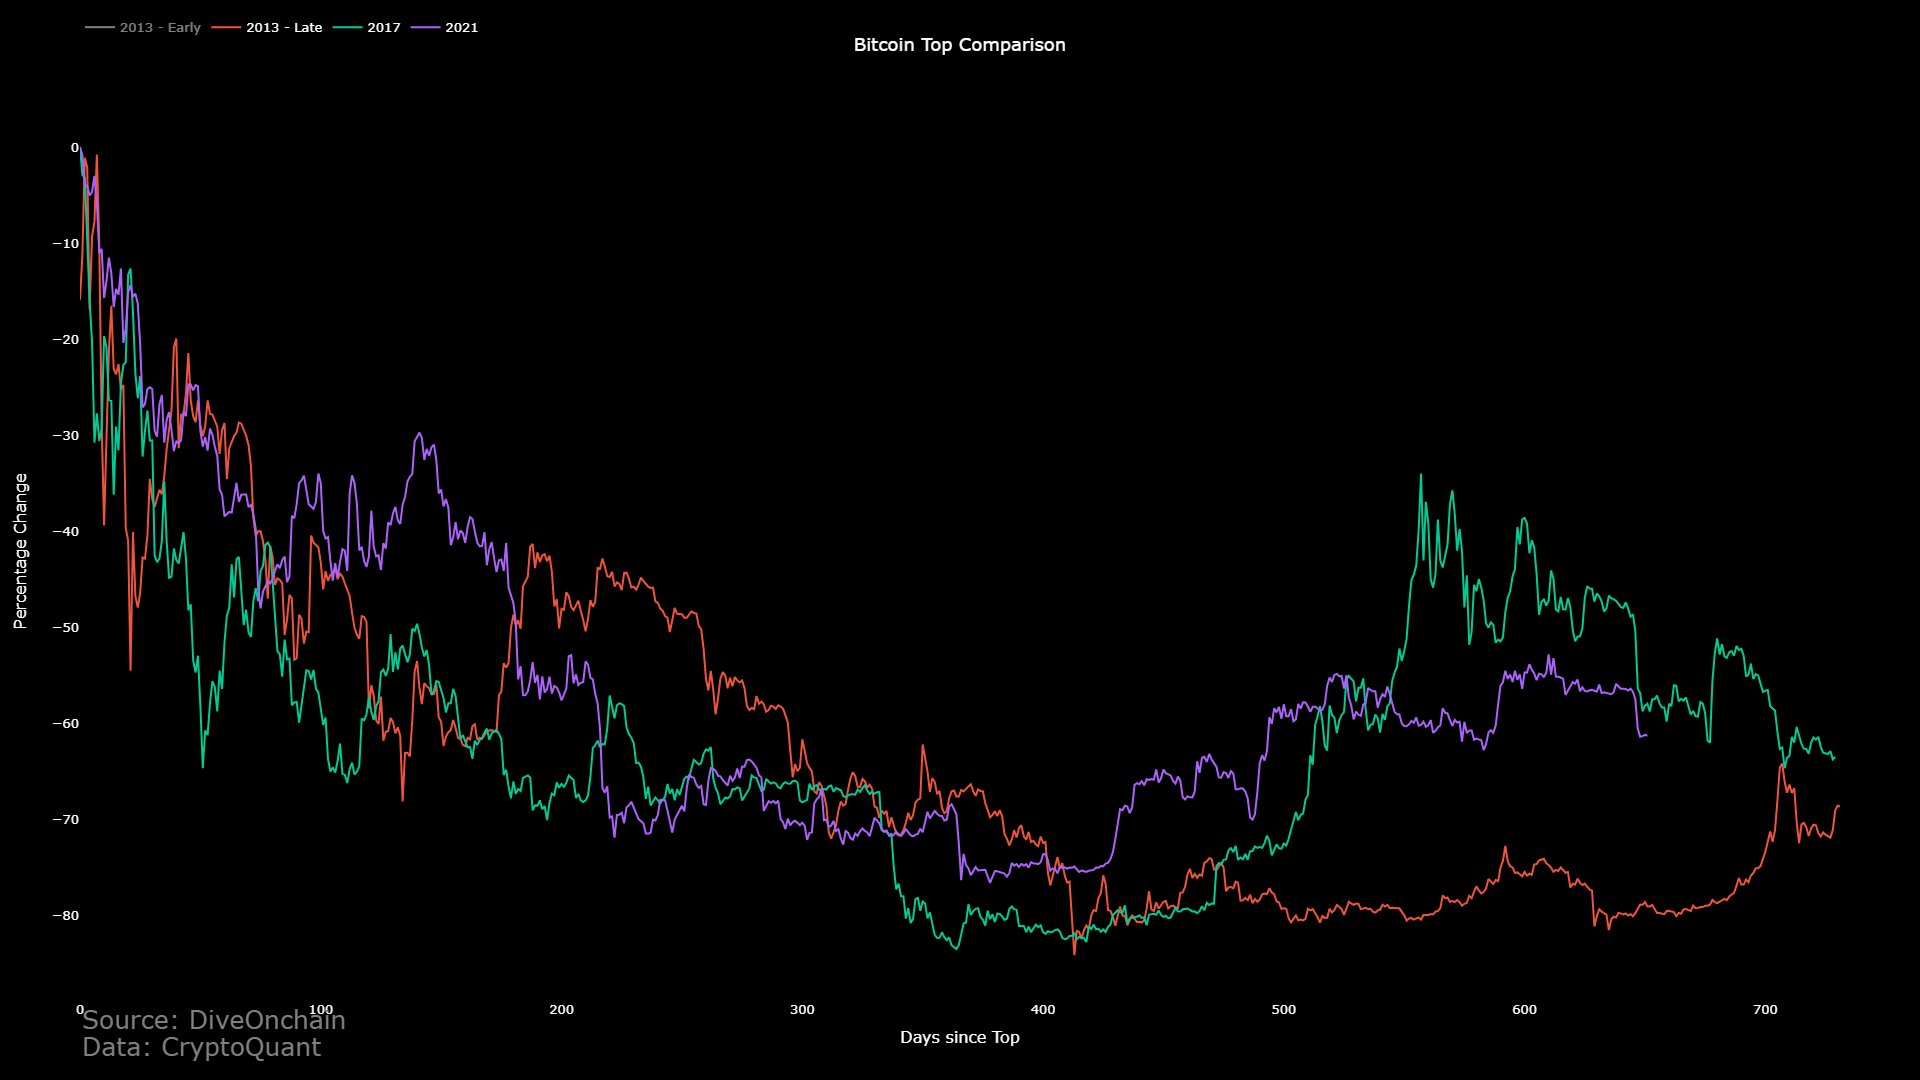
In a new post on X, the community manager at CryptoQuant Netherlands, Maartunn, discussed how the current cycle lines up against the last two cycles.
Here’s the chart in question:
From the chart, it’s visible that the analyst hasn’t compared the entire cycles, but rather from the points where each of these cycles set their respective all-time highs.
The basis of the comparison here is the percentage change in the price. Since the phase of the cycle relevant to this chart is the post-ATH, bear market period, the percentage change is on the negative scale for each of the cycles.
A striking similarity between them immediately becomes apparent on a first look at the bear market drawdown phase of each of these cycles. The price action in each of these doesn’t align perfectly, as each cycle had short-term fluctuations.
In a more long-term view, however, it’s interesting that the percentage drawdowns across these cycles have even been as close as they have been. The alignment becomes especially strong around the time of the cyclical bottoms, with each of these cycles observing their lows not too far from each other.
This is naturally under the assumption that the bottom seen back in November 2022 following the FTX collapse was indeed the bear-market bottom for the current cycle.
In the bear-market recovery phases of each cycle, the prices show more of a divergence, as the current and last processes both observed significant rallies. In contrast, the 2013 cycle saw an extended phase of consolidation.
Still, interestingly, the current Bitcoin crash almost precisely coincides with a sharp drawdown from the 2017 cycle, while the 2013 cycle, which had diverged from the other two, still saw a sharp decline not too long before the other two saw their crashes.
Following the current point, the 2013 and 2017 cycles had gone on to converge again. If the current cycle shows this same behavior, more drawdown might be coming for the price.
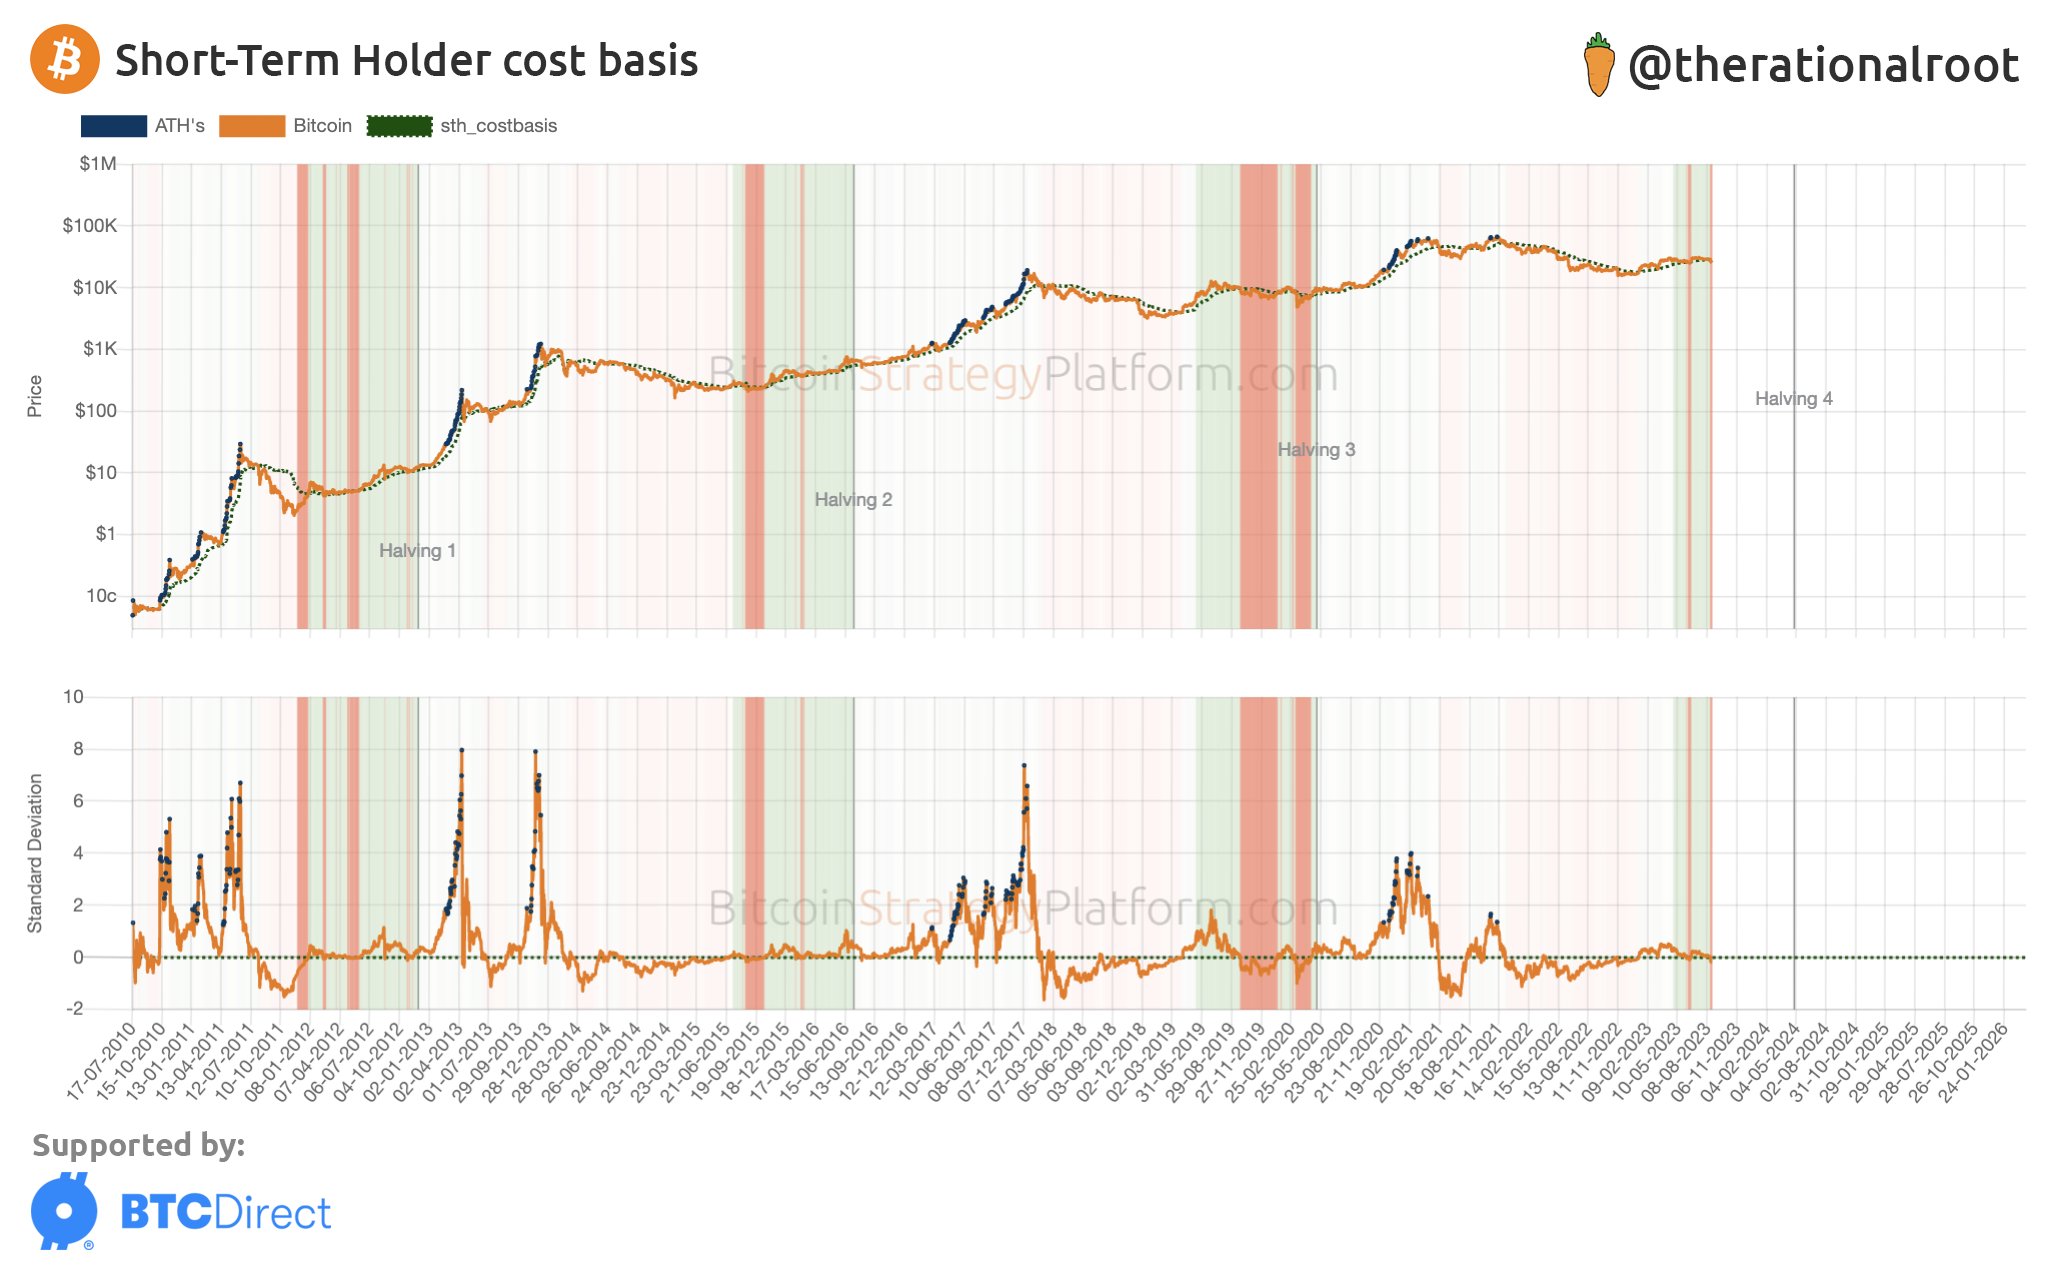
Recently, Bitcoin has lost an essential level in the form of the short-term holder cost basis. This level refers to the price at which the average short-term holder acquires coins.
Another analyst, Root, has posted a cycle comparison chart on X that displays how each of the cycles had gone through periods of being below this level in the final year leading up to the halving.
This would suggest that the current Bitcoin cycle isn’t showing something out of the ordinary with the latest crash below the short-term holder cost basis.
BTC Price
At the time of writing, Bitcoin is trading at around $26,400, down 7% in the last week.
Disclaimer
The views and opinions expressed in this article are solely those of the authors and do not reflect the views of Bitcoin Insider. Every investment and trading move involves risk - this is especially true for cryptocurrencies given their volatility. We strongly advise our readers to conduct their own research when making a decision.

