Latest news about Bitcoin and all cryptocurrencies. Your daily crypto news habit.
IntoTheBlock launches economic risk tools for Curve

After months of engineering effort, we are glad to release the Curve Risk Radar dashboard. Through these indicators, Curve users and liquidity providers will be able to monitor and manage their exposure to the most important economic risk factors that the protocol is exposed to.
IntoTheBlock DeFi Risk Radar
Risk management has emerged as a crucial component for the mainstream acceptance of decentralized finance (DeFi). Despite DeFi’s recent momentum, the ecosystem is vulnerable, especially to often-neglected economic risks like liquidations, de-pegging events, and large whale transactions. Economic risks, though less-publicized than DeFi hacks, can cause major losses to participants.
With the Curve release, IntoTheBlock (ITB) enhances the Risk Radar platform monitoring DeFi’s economic risks. The metrics in the Risk Radar are based on our quant strategies, which have safeguarded capital in DeFi for some of the largest institutions in the crypto space. For more info on the Risk Radar vision feel free to read our CEO’s announcement of the initial alpha release.
Curve Risk Overview
Curve is a decentralized exchange (DEX) optimized for stablecoin swaps with low slippage and fees. It employs automated market makers (AMMs) to facilitate trading, focusing primarily on stablecoins and other pegged assets. With over $3B in value deposited into Curve, it is one of the largest and most important protocols in the DeFi space.
Through 2022 and 2023, the crypto space learned the hard way that stablecoins are not risk-free. The Curve protocol exposes users to the risks of de-pegging events, slippage, and complex withdrawal fees varying depending on whale concentration and more.
With the nine metrics released in the Curve Risk Radar, we offer a transparent way for users to navigate these risks. Let’s take a look at some of the most relevant metrics and how to use them.
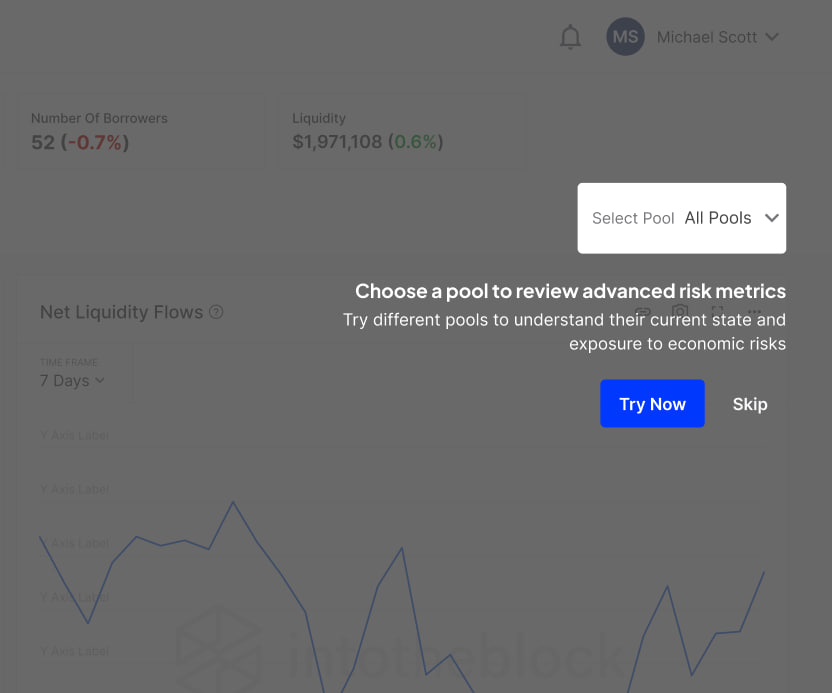
Before we get started, it’s worth noting that are only four metrics shown under “all pools”, but there is a lot more to cover when selecting a specific pool so make sure to check the indicators for your favorite pool in the top right corner.
Net Liquidity Flows
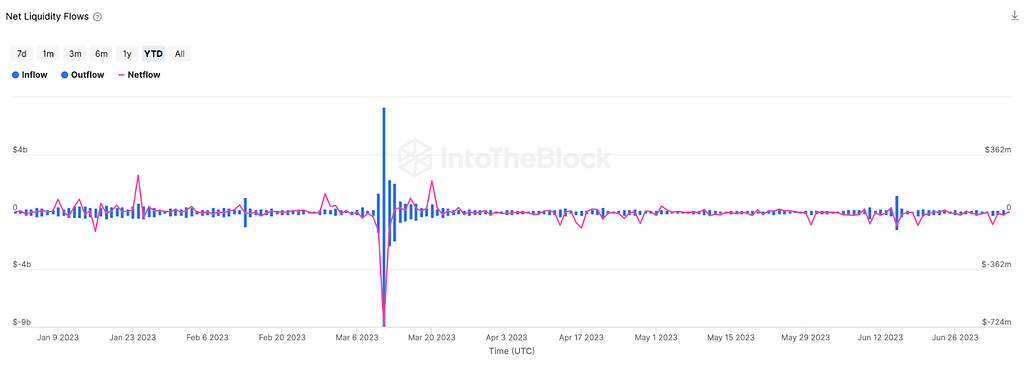
Inflows and outflows are crucial to understand the health of any DeFi protocol. In Curve’s case, inflows into the protocol increase liquidity, which allows for better trading execution to take place.
On the other hand, if there are negative netflows (more outflows than inflows) that indicates liquidity is decreasing.
https://defirisk.intotheblock.com/metrics/ethereum/curve
In the graph above we can see negative netflows of over $700M in Curve in early March. This coincides with the USDC de-pegging event, where its price dove to as low as $0.9 following the collapse of Silicon Valley Bank. Tracking such large deviations users will be able to identify potential risks, which are then covered in more depth in the remaining indicators.
Peg Monitor
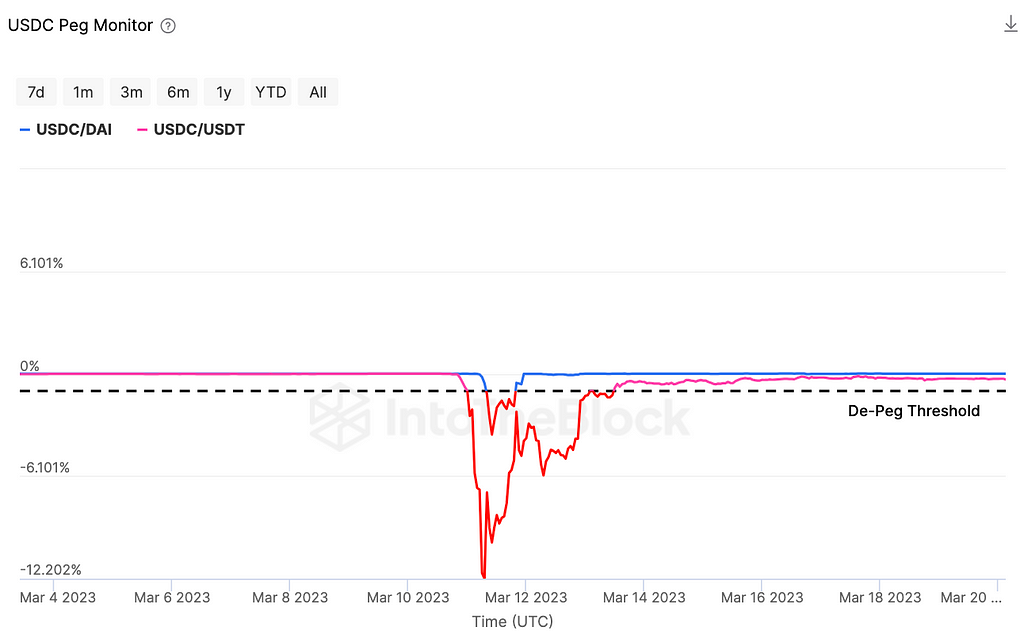
Through the USDC example, it is evident that tracking the price of an asset relative to its intended peg is essential. Through the Peg Monitor we display the premium/discount of an asset versus the other asset(s) available in the pool.
https://defirisk.intotheblock.com/metrics/ethereum/curve
Above we can see that USDC’s de-pegging event in March was much more severe against USDT than against DAI. A likely reason for this is that DAI is partly backed by USDC, which meant that it also was indirectly exposed to the SVB collapse.
Through the ITB Risk Radar users will be able to monitor potential de-pegging events in near real-time, download the data to analyze previous instances and soon be able to receive alerts to be notified as they happen.
Market Depth
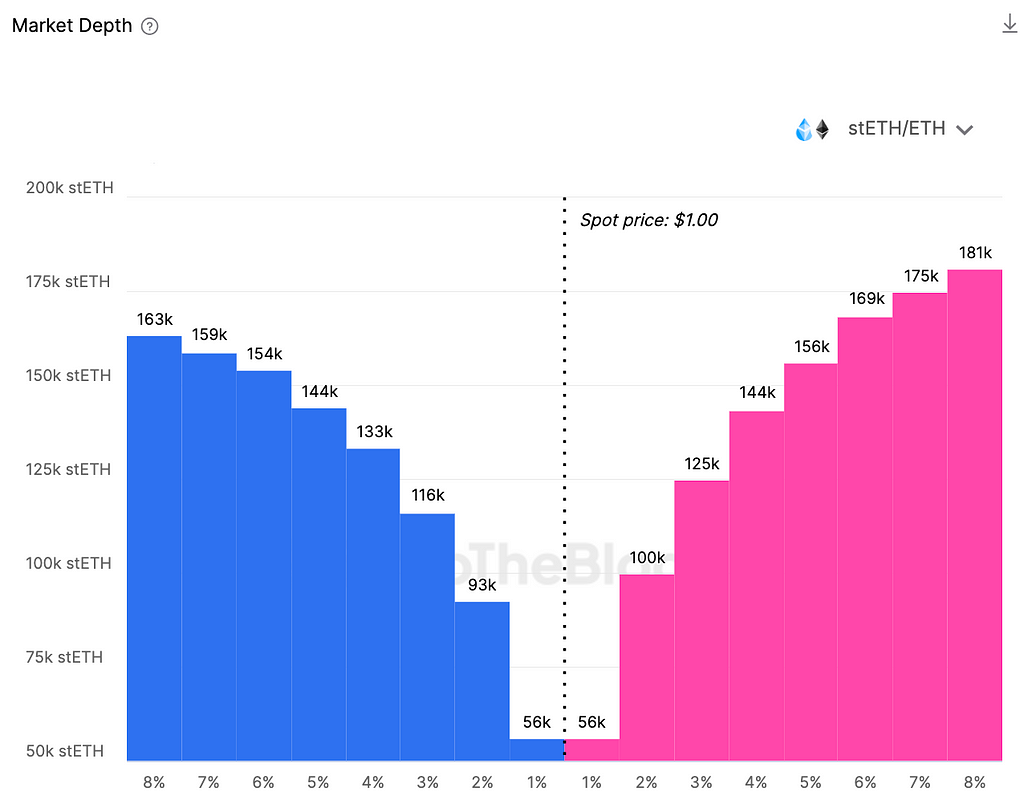
From a trader standpoint, it is important to understand the slippage that one may incur by trading a given size. Borrowing from centralized exchanges, we show this impact through the Market Depth indicator.
https://defirisk.intotheblock.com/metrics/ethereum/curve
The data above shows in the x-axis the price impact on either direction, and in the y-axis the size that would be traded to produce such movement in price.
Therefore, we can observe that a 93k stETH sell order on Curve would produce a slippage loss of only 2%. This is important to monitor to understand how resilient the pegs of Curve assets can be to large buy/sell orders.
Exit Fee Evolution
One thing that is clear in DeFi protocols is that they consist of multiple players that can affect each other. In AMM pools, if a whale withdraws their liquidity, it can lead to significant losses for a liquidity provider looking to remove their assets afterwards.
Through the Exit Fee Evolution indicator we provide an environment for users to simulate this impact by showing the slippage they would incur exiting in one coin if a large percentage of the pool is withdrawn.
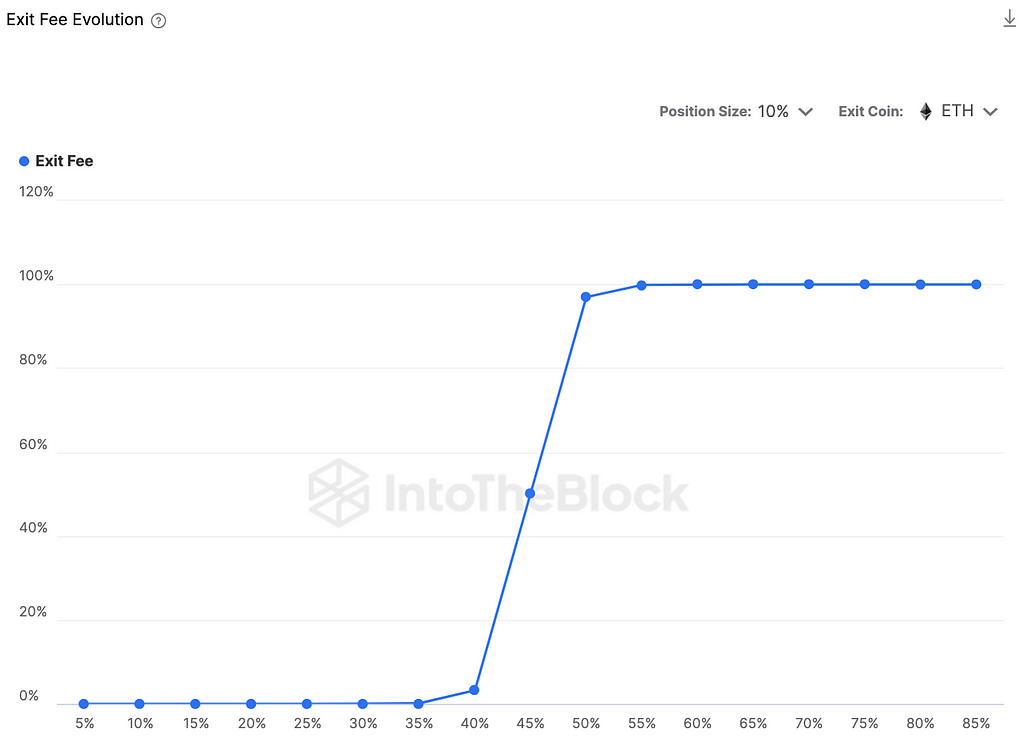
https://defirisk.intotheblock.com/metrics/ethereum/curve
In the indicator above, we simulate the exit fee (y-axis) a position with 10% of the stETH/ETH pool would have if a large percentage of the pool (x-axis) is withdrawn. As can be seen, exit fees are relatively negligible up to the point when 30%+ of the liquidity is withdrawn, when they begin increasing exponentially.
Given the adverse and unpredictable conditions that can arise in crypto, it is essential for any large depositor to be following these dynamics. From our experience in DeFi strategies, modeling the evolution of exit fees has allowed us to protect and automatically withdraw positions that would have otherwise been exposed to major losses.
Overall, the indicators above provide a glimpse of the complex risks that can emerge in Curve and other decentralized exchanges. By creating these open risk dashboards we hope to support users and liquidity providers to better manage risks and make DeFi safer over the long-term.
Introducing Curve Risk Radar was originally published in IntoTheBlock on Medium, where people are continuing the conversation by highlighting and responding to this story.
Disclaimer
The views and opinions expressed in this article are solely those of the authors and do not reflect the views of Bitcoin Insider. Every investment and trading move involves risk - this is especially true for cryptocurrencies given their volatility. We strongly advise our readers to conduct their own research when making a decision.