Latest news about Bitcoin and all cryptocurrencies. Your daily crypto news habit.

By Viktor Stanchev
Welcome back to Engineering @Anchorage Digital! As a fast-scaling company, Anchorage Digital’s technical staff is core to our institutional digital asset platform. In this blog series, we are pleased to showcase the great work being done by our engineering team to help institutions participate in the digital asset ecosystem.
Please follow our Twitter and LinkedIn pages for company news and updates or check out our company Insights blog as this page now features engineering-specific content.
At Anchorage Digital, we use logging to debug our code in production and we’ve always written our backend in Go. We are particularly excited about the release of Go 1.21, coming in August. It adds a new package, slog, which is intended to fill the need for structured logging with a focus on performance and extensibility. While exciting, and something we plan to use going forward, slog does not address observability and testability, core to our business. In this blog, we’ll go over three ways to extend the slog package to fill these needs. These features are part of our existing custom logging system and we think they are a good addition to slog.
Next, we’ll cover how loggers integrate with tests, distributed tracing, and custom log sinks so any engineer reading this can determine if these features would be useful to them.
Testing integration
When writing tests, it’s possible to print directly to stdout and the output will be available. However, if the tests are running concurrently, or there are sub-tests, this doesn’t work well. Consider the following test:
package print_test


import (
 "fmt"
 "testing"
 "time"
)


func TestPrint1(t *testing.T) {
 t.Parallel()
 time.Sleep(time.Second)
 fmt.Println(1) // BAD! Replace with t.Log(1) to capture output accurately
 time.Sleep(time.Second)
}


func TestPrint2(t *testing.T) {
 t.Parallel()
 fmt.Println(2) // BAD! Replace with t.Log(2) to capture output accurately
 time.Sleep(time.Second)
 time.Sleep(time.Second)
}
During runtime, it causes confusion in the output of the two tests:
=== RUN   TestPrint1
=== PAUSE TestPrint1
=== RUN   TestPrint2
=== PAUSE TestPrint2
=== CONT  TestPrint1
=== CONT  TestPrint2
2
1
--- PASS: TestPrint1 (2.00s)
--- PASS: TestPrint2 (2.00s)
PASS
ok      example.com/print    2.003s
If we replace fmt.Println with t.Log, the output is attributed to the correct sub-test:
=== RUN   TestPrint1
=== PAUSE TestPrint1
=== RUN   TestPrint2
=== PAUSE TestPrint2
=== CONT  TestPrint1
=== CONT  TestPrint2
    print_test.go:17: 2
=== NAME  TestPrint1
    print_test.go:11: 1
--- PASS: TestPrint2 (2.00s)
--- PASS: TestPrint1 (2.00s)
PASS
ok      example.com/print    2.004s
When running inside tests, logging packages should capture the t variable and call t.Log instead of logging directly. This requires instantiating a different logger per test, but the extra boilerplate improves the debugability of tests. The logger can also use its access to testing.TB to fail the test by calling t.Error() if a test triggers an error log without explicitly expecting it. It can even have a mode to capture logs, allowing tests to check if specific things were logged. This opens up many new testing capabilities. Similar to how dependency inversion is standard practice in Go to enable testing, creating a custom logger with access to testing.T should be standard practice because retrofitting is difficult. If done from the beginning, it’s easy to replicate and can enable very powerful tests.
Distributed tracing
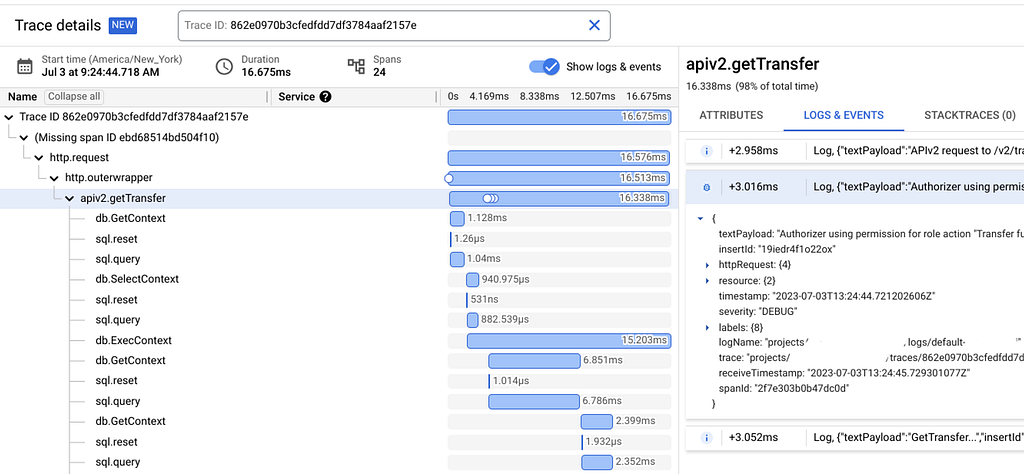
When working with multiple backend services that communicate over the network, or even with a single large service, it is crucial to be able to identify where issues occurred. Distributed tracing enables engineers to get a clear understanding of where time was spent while servicing a client’s request or performing any complex task. This is achieved through tracing instrumentation such as OpenTelemetry. On Google Cloud and other platforms that aggregate logs and traces, they can be correlated, allowing engineers to navigate between them when debugging.
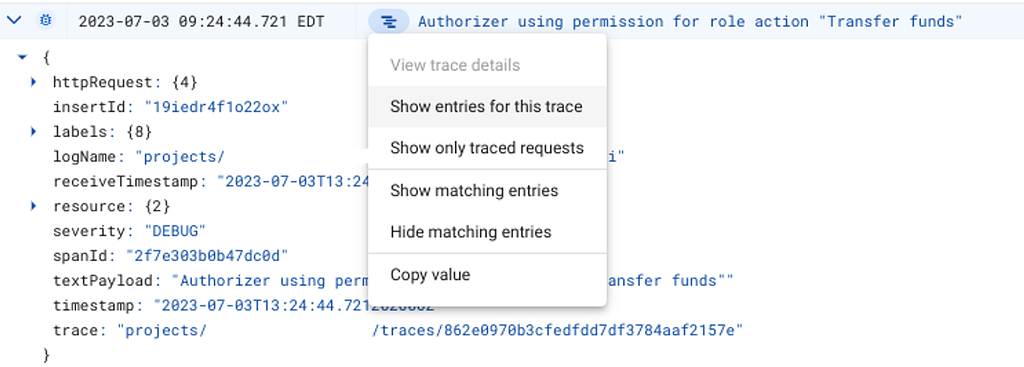
To enable tracing, functions normally pass context.Context as the first argument all the way down the chain and across any forks in the logic. By passing the context into log statements, the TraceID and SpanID can be included in log entries and they can be correlated with the traces. Doing this has a performance impact, so it might not be ideal for every use case, but all code we write has benefited from always passing the logger and the trace data in the context. Below is an example of what this looks like in practice in the Google Cloud interface:


The slog package supports passing context.Context, but it doesn’t require it. However, it’s a good practice to require code authors to always pass the context wherever they need to log. This way, when an on-call engineer is inevitably woken up at 2 AM to fix a production issue, they can navigate the logs and better understand what happened.
Custom log sinks and multiple destinations
Not all logging occurs in the cloud, where systems have already been set up to scrape process output. We run some machines in offline environments, where they are accessed infrequently, so we prefer to keep the surrounding infrastructure lightweight. For logging, this means that if we want logs to be sent somewhere, we must do so ourselves in our Go code. There is a popular Go proverb: “A little copying is better than a little dependency.” Similarly, we believe that a little Go code is better than a little infrastructure. Therefore, it is important for logging systems to be extensible and capable of sending logs to multiple backends.
In addition to printing to stdout, we send all logs to another machine that aggregates and forwards them, preserving the security of our system while allowing us to see what is happening in the data centers. We also have systems that send certain logs to an error aggregation system in addition to logging them to stdout. Sometimes an infrastructure team will take care of all this and engineers don’t have to worry about it, but it’s very convenient to be able to set up integrations with log and error aggregation systems directly from Go code.
Implementation options
When it comes to implementation of these features, there are three ways to integrate with slog. Writing slog.Handler implementations is the most obvious. Another is wrapping slog.Logger in a custom logger struct with a slightly different interface. The last one is to use slog.JSONHandler or slog.TextHandler, but to wrap the io.Writer they use to redirect their output or to pass other options to them such as ReplaceAttr. We expect to use a combination of all three to meet our needs and we are excited to see how open source libraries and other companies choose to integrate with slog after the Go 1.21 release. Interested in building systems with good observability, consider joining our team at Anchorage Digital.
This post is intended for informational purposes only. It is not to be construed as and does not constitute an offer to sell or a solicitation of an offer to purchase any securities in Anchor Labs, Inc., or any of its subsidiaries, and should not be relied upon to make any investment decisions. Furthermore, nothing within this announcement is intended to provide tax, legal, or investment advice and its contents should not be construed as a recommendation to buy, sell, or hold any security or digital asset or to engage in any transaction therein.
Three logging features to improve your slog was originally published in Anchorage Digital on Medium, where people are continuing the conversation by highlighting and responding to this story.
Disclaimer
The views and opinions expressed in this article are solely those of the authors and do not reflect the views of Bitcoin Insider. Every investment and trading move involves risk - this is especially true for cryptocurrencies given their volatility. We strongly advise our readers to conduct their own research when making a decision.