Latest news about Bitcoin and all cryptocurrencies. Your daily crypto news habit.
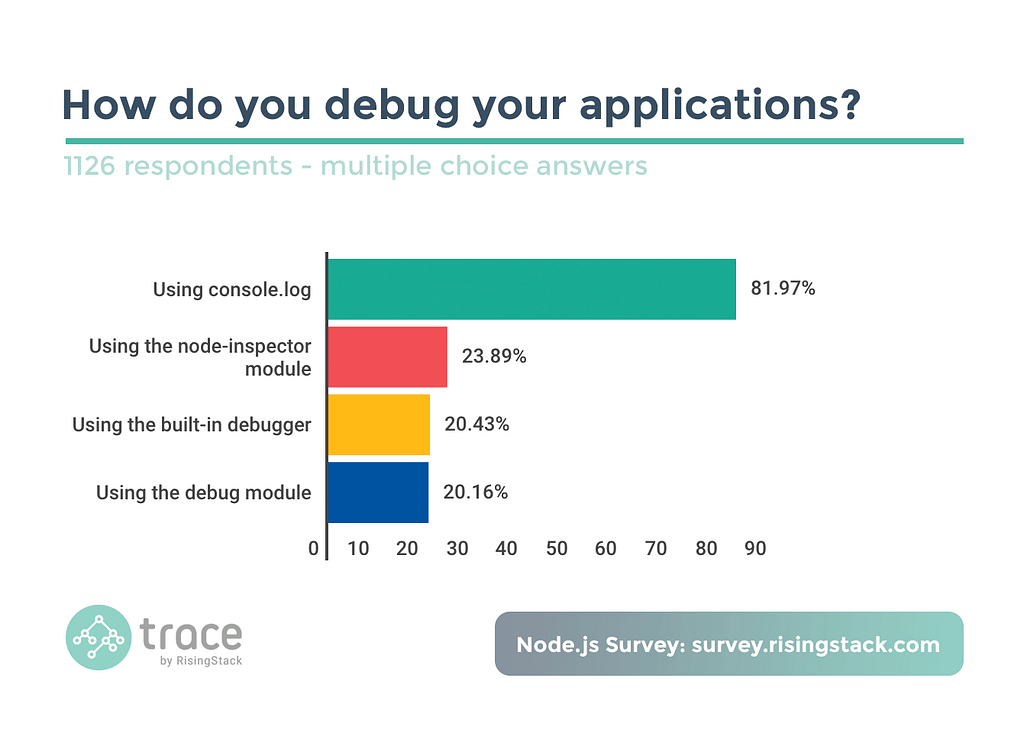
 RisingStack: How Developers use Node.js — Survey Results
Adding console.log() to our code is probably one of the most common practice among developers. However, I have spent a lot of time in my life to persuade beginners (and sometimes proficient coders) to stop using it for debugging JavaScript, here is why.
First, I must admit that I am still doing console.log() statements in my code, old habits die hard ! I am not alone, around ¾ of Node.js developers report using it (in 2016) for finding errors in their applications. In a couple of situations it is either the simplest thing to do, because you know exactly what and where to log information, or the only thing to do, because you are in constrained production/embedded environments with no other tool. However, this not an excuse to make the exception lead your daily practice. Indeed, as a general rule, console.log() is painful and prone to errors as you will see hereafter — while much-sophisticated solutions are available.
Missing contextual information
console.log() force you to consciously select which information to be logged prior debugging. And what you display in a first place is not sufficient or even completely irrelevant, because you usually don’t yet have any idea of what’s going on. Every time you launch your app you go a step further, realizing you are still not logging the right information at the right time, wasting hours changing your statements again and again to display new information and hide irrelevant one.
Counter-attack with a debug tool:
- display/watch any JS variable inline while debugging (function arguments, local variables, global variables, etc.);
- explore the call stack to get the complete context in which your problem appear.
Algorithms are usually designed to automate a large number of small tasks, loops and recursion being fundamental building blocks for this. Along with console.log() it results in a large number of lines displayed in front of you, i.e. a hard time coming to find the right information.
Counter-attack with a debug tool:
- create conditional breakpoints to pause the execution when a specific condition is met so that you can take time to analyse what’s going on;
- watch custom JS expressions (variables, conditions, etc.) so that you don’t waste time to derive the same expression at each step of a loop;
- create a debug log classification in addition to your standard application log in order to activate debug messages on-demand for the “domain” of interest (e.g. file, service, class, etc.).
You cannot always trust information reported by console.log() because there is simply no standardized behavior about it. You don’t really know what happens under the hood. Most of the time calling console.log() when the console is not yet active only results in a reference to the object being queued, not the output the console will contain. As a workaround you will need to either clone the information or serialize snapshots of it. The rendering happen asynchronously (being throttled to rate-limit updates), as future interactions with the logged objects like expanding object properties in the browser console.
Counter-attack with a debug tool:
- asynchronous stack traces (now the default in Chrome) allow you to inspect function calls beyond the current event loop, just like a context-aware travel in time to the originators of your asynchronous callbacks.
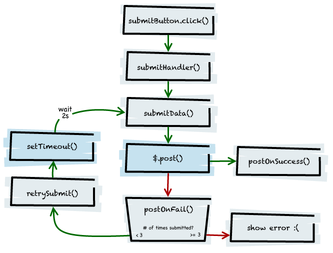
The “standard” way to debug asynchronous code is to console log “1”, “2”, “3”, “4”, etc. i.e. all executed steps before the output you’re expecting, until you get the right order. As a consequence you modify the code and thus the way it runs, which can lead to really hard to track unsteady behaviors. After you finish debugging, you also have to remember to delete all the stray console logs in your code.
Counter-attack with a debug tool:
- when it comes time to really understand the flow of an application, step-by-step is mandatory;
- when it comes time to really understand the timing of asynchronous callbacks, breakpoints are your best friends (select the type that best suits your problem).
The debugging toolkit for JavaScript
To help you debug a full stack JS application you actually really need a few tools:
- Chrome DevTools, now it supports Node.js debugging in addition to JS code running in a local or remote browser (i.e. on a mobile device);
- Node.js debug module.
One can mention winston or loglevel as fairly good customisable loggers but I prefer to use them for production grade logs (information, warnings, errors, etc.).
And if you believe you cannot use the debugger when running your tests consider reading this article and other similar resources you might easily find on the internet.
Please stop using console.log(), it’s broken… was originally published in Hacker Noon on Medium, where people are continuing the conversation by highlighting and responding to this story.
Disclaimer
The views and opinions expressed in this article are solely those of the authors and do not reflect the views of Bitcoin Insider. Every investment and trading move involves risk - this is especially true for cryptocurrencies given their volatility. We strongly advise our readers to conduct their own research when making a decision.


