Latest news about Bitcoin and all cryptocurrencies. Your daily crypto news habit.
Authored by Johnny Louey, Dave Chan and Barry Jiang, Researchers at Huobi Research Institute
Abstract
The crypto market has bounced back from its mid-June low. Bitcoin (BTC) has reclaimed the US$22,500 resistance level while Ethereum (ETH) broke out of the trading range of between US$1,000 to US$1,280 and has been showing signs of strength upon the announcement of the ETH 2.0 merge due mid-September.
This article analyzes the formation of BTC and ETH bottoms with regard to Wyckoff’s methodology of accumulation scheme. The scheme explains that the trend reversed after being tested multiple times by market demand and supply.
This article also suggests that the expectation of the Fed’s adjustment of the interest rates increment from 100bps to 75bps contributed to this reversal. In addition, the announcement of ETH 2.0 merge in late September added strength to ETH’s upward price movement, causing ETH to trend higher.
Lastly, this article highlights various valuable protocols which survived the last bear market and suggests that these protocols will be likely to recover and trend higher with ETH should BTC shows signs of strength in the near future.
1. Wyckoff’s methodology analysis on BTC/USD and ETH/USD
The crypto market has bounced back its mid-June low. Bitcoin (BTC) has reclaimed the $22,500 resistance level while Ethereum broke out of the trading range between US$1,000 to US$1,280 and has been showing a sign of strength upon the announcement of the ETH 2.0 merge due mid-September.
It is interesting to notice that there has been an accumulation of BTC and ETH since mid-June to early July. Let’s have a look at the charts of BTC and ETH to visualize the accumulation process.
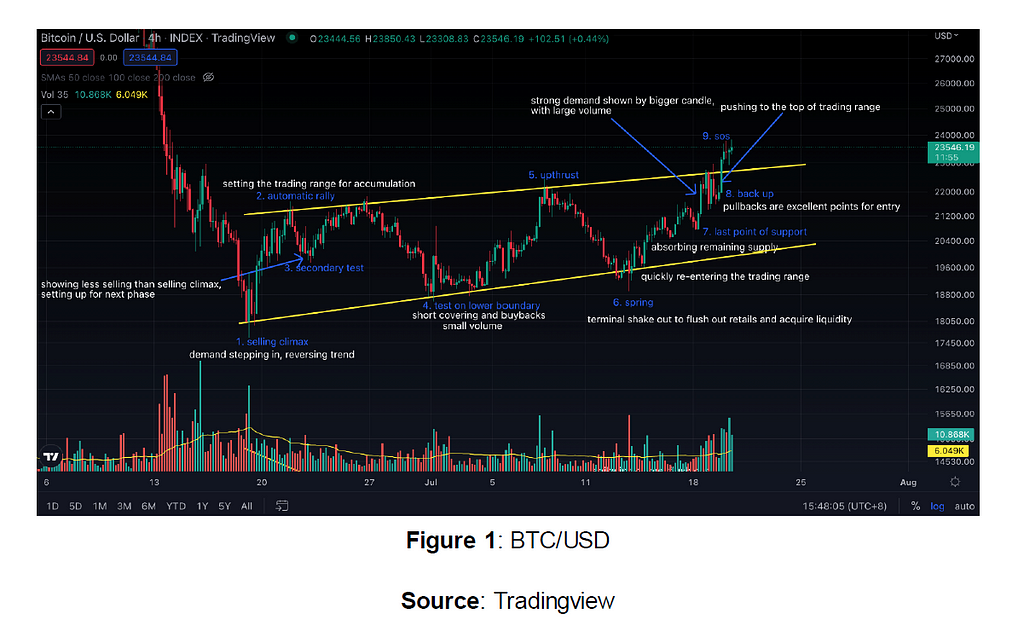
The accumulation phase of BTC started with (1) the selling climax, which carried a large volume as a large amount of selling pressure occurred there. The immense selling pressure was absorbed by the demand, reversing the trend. The reversal was rapid, indicated by an upward hammer candlestick followed by a full upward candlestick with good volume.
The reversal trend pushed the price of BTC to (2) automatic rally, where the price paused surging as some of the market players took profits from buying the dip, and selling pressure started to appear and set the upper boundary of the trading range from the selling climax bottom. Supply subsequently stepped in and pushed the price downwards. The (3) secondary test indicated that demand stepped in again and absorbed the supply. Notice that at (3) the volume diminished compared to (1), signalling a weakened supply in the market. The price was driven up by the demand from the (3) secondary test and pushed above the (2) automatic rally. Supply appeared again as shorts accumulated at the upper boundary of the trading range.
At this stage, we can assume that demand in the market was greater than supply because the price was pushed above (2) automatic rally, which suggests that whales/smart money could continue their accumulation schemes at lower prices. The trend reversed as shorts and supply appeared and moved to (4) which tested and set the lower boundary of the trading range. This phase had two traits: (1) testing market supply across the trading range and (2) acquiring liquidity at lower prices. After confirming the lower boundary of the trading range, shorts recovered and buybacks occurred, indicated by increased volume and a rapid price surge forming a full upward candlestick. The demand was confirmed, and the trend reversed again with sizeable volume. The price was pushed to the upper trading range with full candlesticks and significant volume, forming (5) upthrust.
The accumulation phase has not yet finished; the smart money/whales need to acquire more liquidity at lower prices. They would initiate shorts to pose selling pressure on the market at the top of the trading range to push the price lower. On 13 July, when the CPI was released at a higher level than last month, retailers and some investors deemed it a bearish signal and there was a sudden selling pressure right at the CPI was released. The price hence dipped below the trading range. However, it immediately pushed back into the trading range with large volume, signalling a rejection of lower prices by demand. This can be explained by the strong upward hammer candlestick with healthy volume. Smart money and whales already acquired sufficient liquidity at cheap prices and when supply was drained out from the market, price started to push upwards, forming an upward trend from the (6) spring.
The upward trend from (6) carried less volume in retracement and more volume in upward price movements, signalling strength. (7) Last point of support appeared at mid-range of the trading range as supply was diminishing and more demand was appearing along the way up. We observed an appearance of selling pressure after (7) last point of supply as price pushed closer to the upper boundary of the trading range and (8) buybacks immediately absorbed the remaining supply in the market indicated by large volatility and large volume.
After absorbing the remaining supply in the market across the trading range, the mark up phrase began with shorts liquidation and more people joining the upward trend. The accumulation phase was confirmed by (9) sign of strength and the price is expected to trend higher.
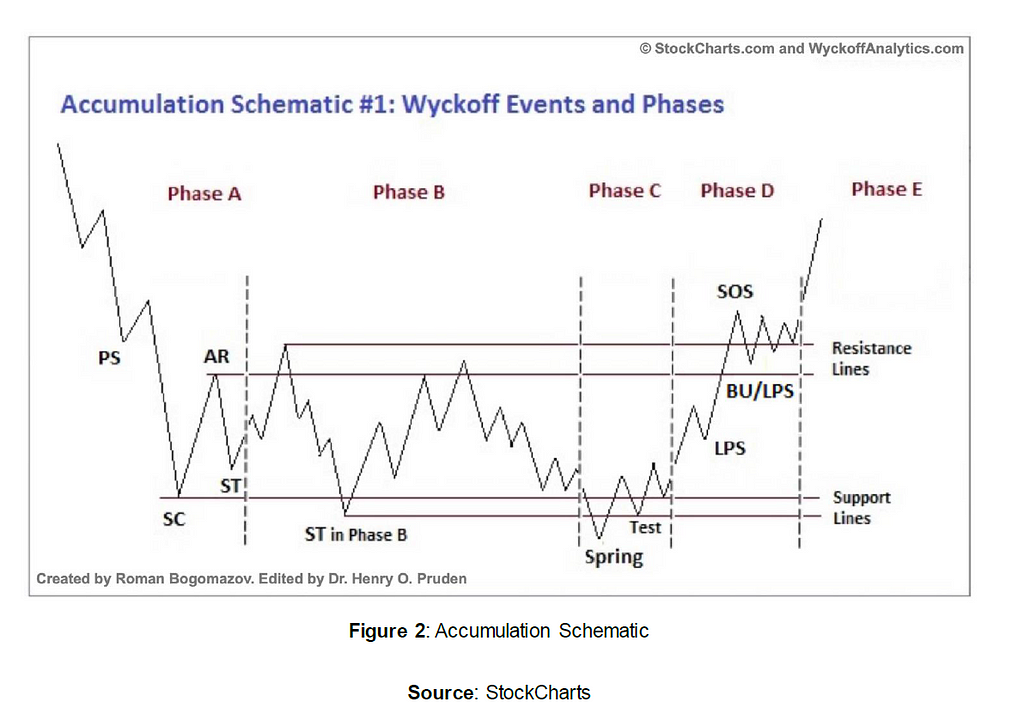
The above highlights a typical accumulation pattern suggested by famous trader Richard Demille Wyckoff. The BTC/USD chart provided above looks similar to the following playbook (below).
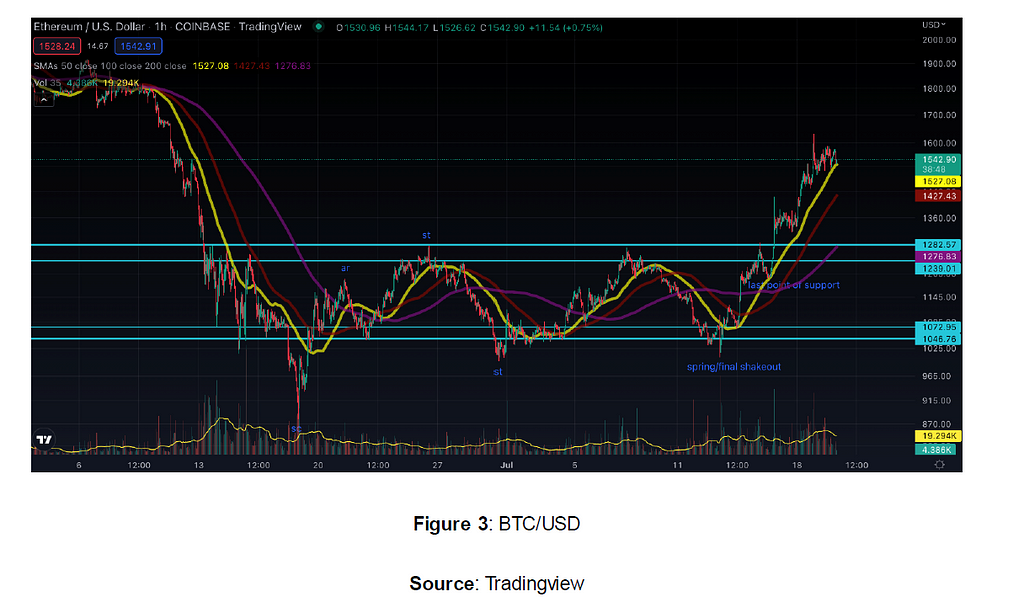
An interesting point to note is that ETH/USD displayed a similar accumulation pattern.
Why would smart money would deem these BTC and ETH price levels as opportunistic accumulation zones? There are reasons behind the formation of this potential local bottom.
On Thursday, July 14, St. Louis Fed President James Bullard said he is inclined to stick with a 75 bp rate hike later this month (July 28) rather than a larger hike after June U.S. CPI data exceeded expectations. Bullard is a well-known hawkish official within the Fed, and his statement seems to be lowering expectations for a 100 bp Fed rate hike in July. On Thursday, market expectations for a 100 bp hike waned after Fed Governor Christopher Waller said he also supported a 75 bp hike. The Fed’s appeasement of market sentiment gave the market reason to correct upward in the short term.
The reason behind the preceding uptrend of ETH is the high expectations the market has the ETH 2.0 Merge. On July 14, Tim Beiko, a core Ethereum developer, said that the expected the implementation date for the Merge Upgrade of Ethereum to take place on September 19. Although developer superphiz.eth explained that September 19 has not yet been finalized, but is as yet a tentative date, the community believes that the Merge will be completed this year.
Furthermore, July 18 came the news that the Ethereum Goerli test network will merge on August 11, with the TTD (Total Terminal Difficulty) for the Goerli merger expected to be selected early next month. This again gave the community confidence and raised expectations that the Merge will succeed.
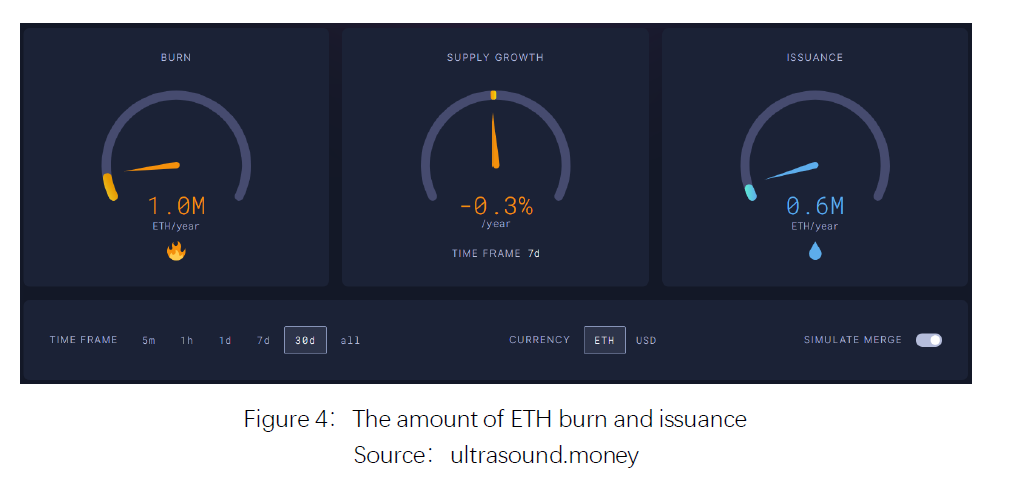
The amount of ETH in circulation on the market will drop after the Merge, which is good news. First of all, it should be noted that ETH will not necessarily achieve deflation after the Merge, the main uncertainty is how much ETH the network can burn. But the inflation rate, meaning incremental ETH available on the market, will be significantly reduced. According to ultrasound, the network currently produces about 5.5 million ETH per year; post-merge, it is estimated to produce 0.6 million ETH per year, a decrease of nearly 90%. The community refers to this effect as “triple halving”, meaning that the reduction in production after the transition to POS is equivalent to that of BTC after 3 halving cycles (about 12 years).
Smaller incremental volume means less selling pressure, which will naturally favor a price increase. With the estimated burning volume of the last 30 days, the whole network can burn 1 million ETH a year and ETH will likely go into deflation. Of course, in a less active bear market, ETH may not necessarily deflate; on the contrary, ETH may accelerate deflation and the price will rise. In addition, considering that other POS public chains that have been running longer have deposit rates of between 40%-70%, while Ethereum currently has a deposit rate of only 10%, the demand for deposits on Ethereum will continue to rise, and circulation of ETH will continue to fall, thus pushing up the price.
While fear was instilled in the market amidst a bearish macroeconomic environment, some large players deemed it as an attractive opportunity to buy more Bitcoin and Ethereum. It’s interesting that ETH/USD broke out of the trading range and trended higher before BTC did, catalysed by the announcement of the ETH 2.0 merge. The accumulation period was well-planned and executed. Now, those who participated in the accumulation zone could enjoy profits marked up by the ETH 2.0 merge news.
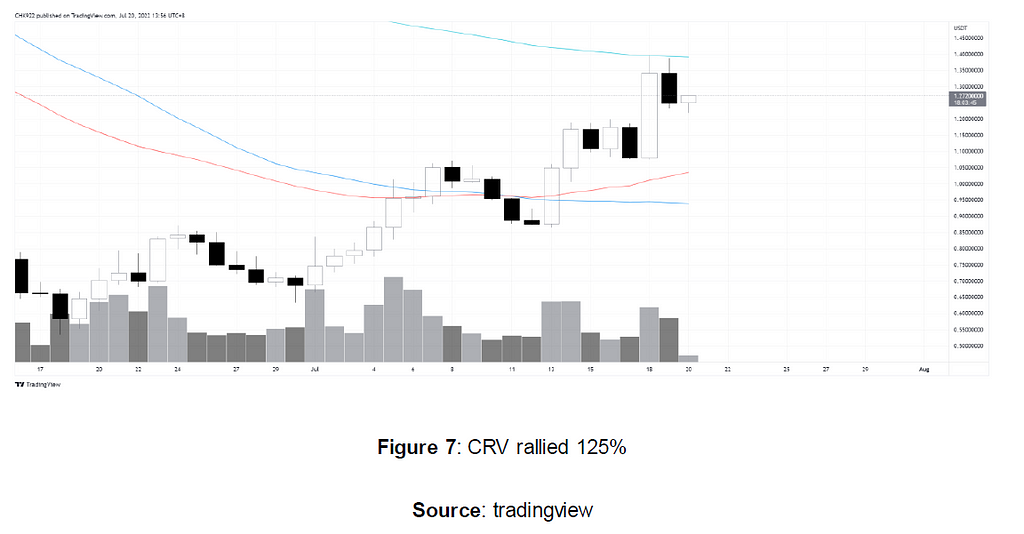
Assuming BTC successfully breaks out of the trading range and trends higher with strength, this could be a bullish development of crypto. There are indeed some valuable protocols which survived the last bear market and demonstrated their value. These protocols are likely to rise with ETH if the bullish development continues.
2. Associated Bets
After reading the Wyckoff analysis, the Bull Phase I associated bets need to be explained. Given that Bull Phase I is just a probability, readers should analyze your own risk exposure and protect yourself. There is no investment advice given in that sense.
A Bull Phase I cycle bets on protocols or equities that survived the market — such as protocols that have proven to be a valuable project after a long bear market. These tokens are getting pumped the first. In the meantime, new tokens will also get pumped. It is because ventures have not exited their positions when token prices have not gone up to some extent.
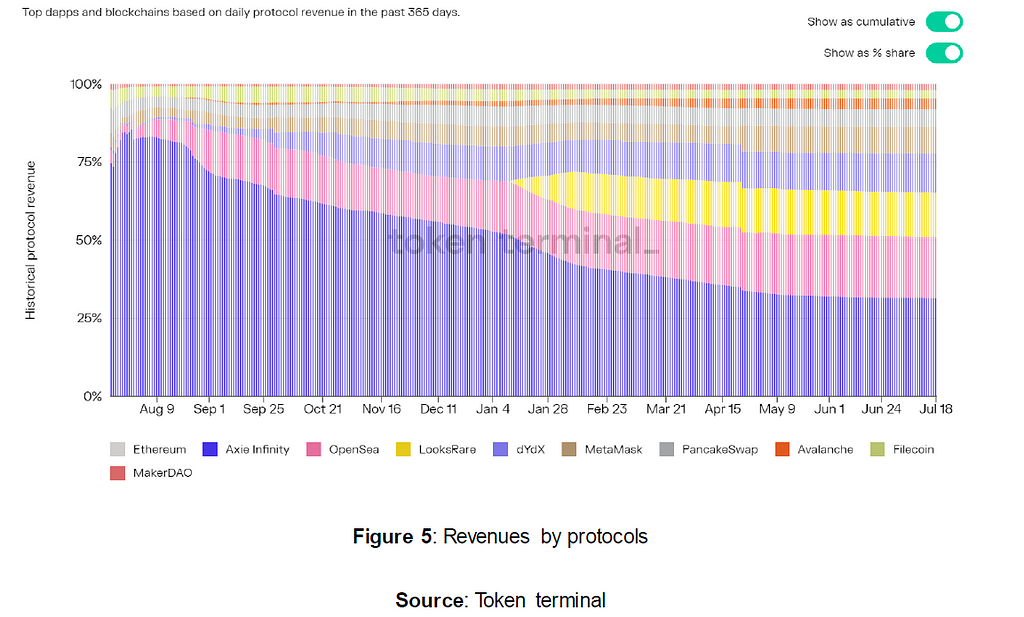
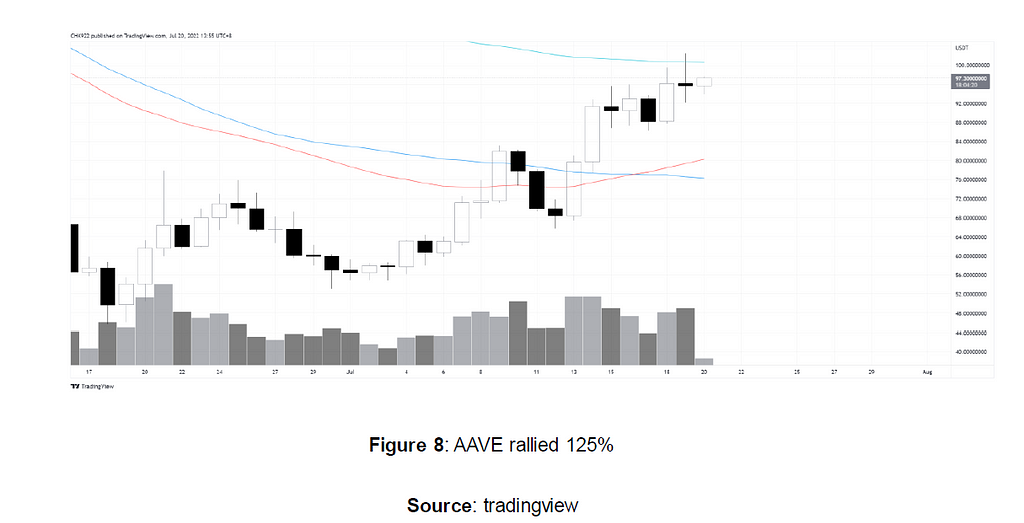
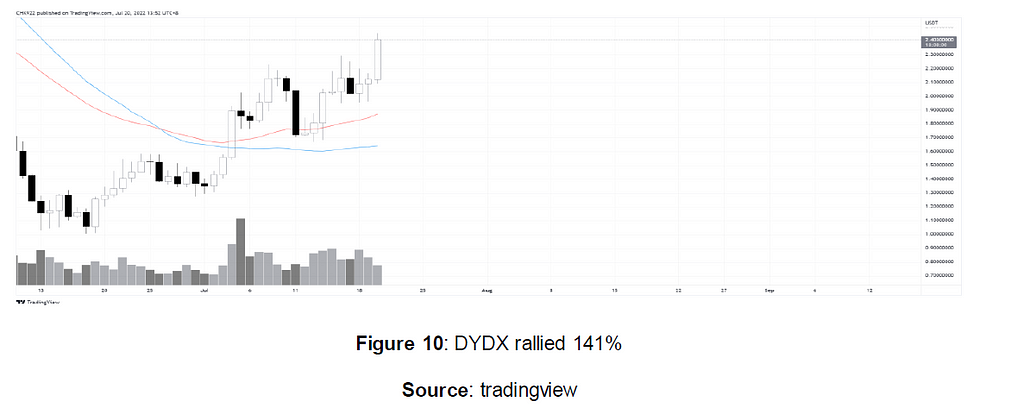
The first category is DeFi. The survival winners are AAVE, CURVE, DYDX and ETH. These DeFi protocol still prevailed even as institutional liquidation started with 3 Arrows Capital.
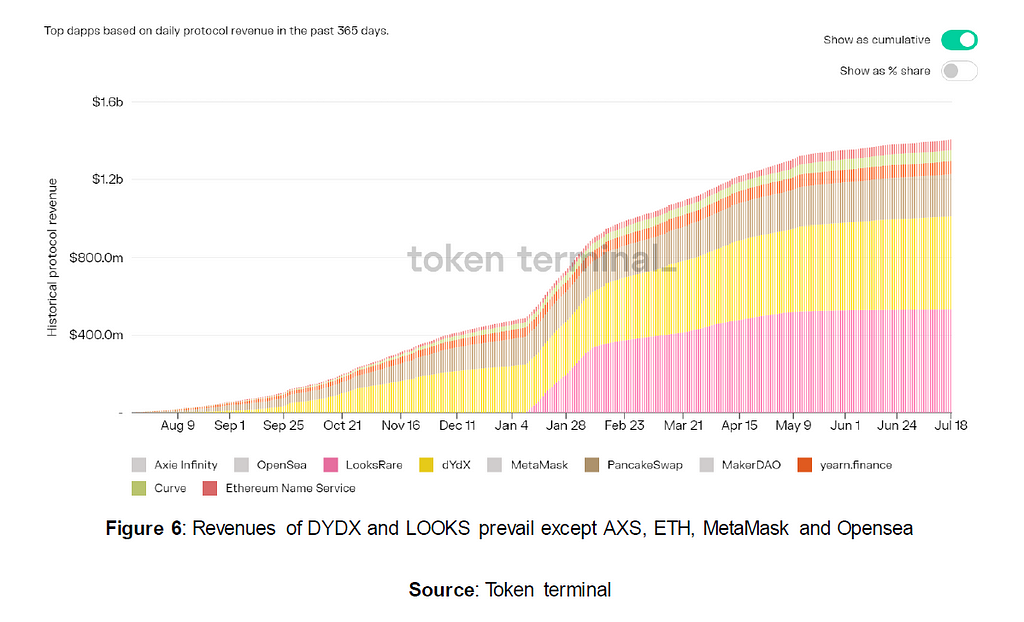
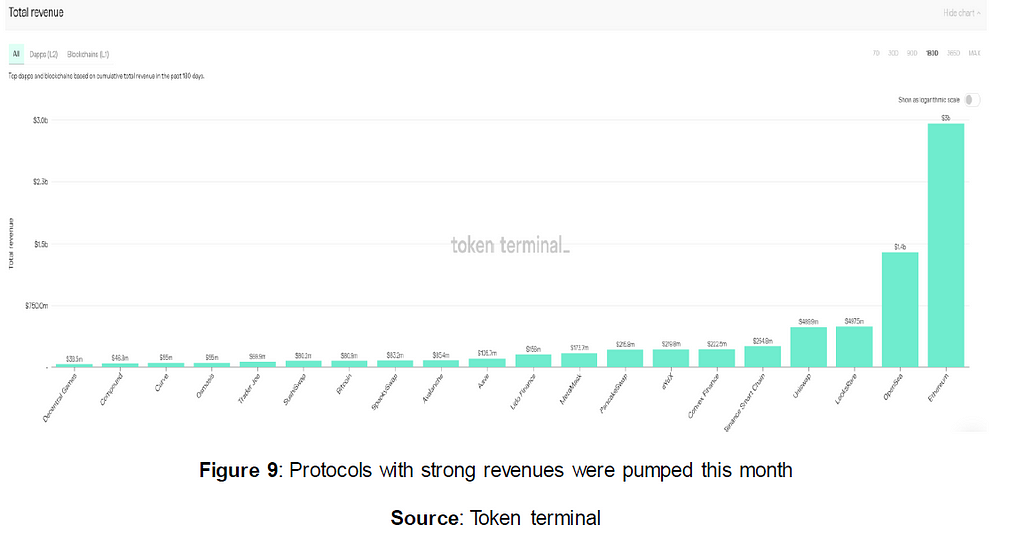
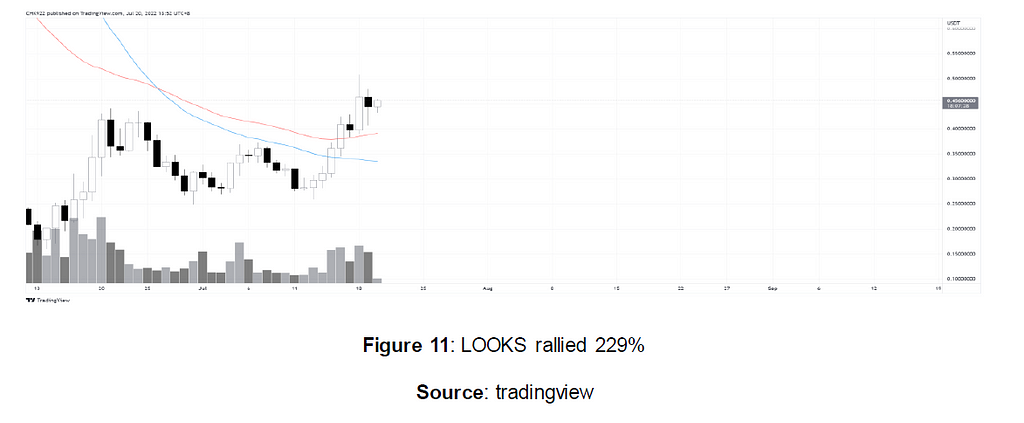
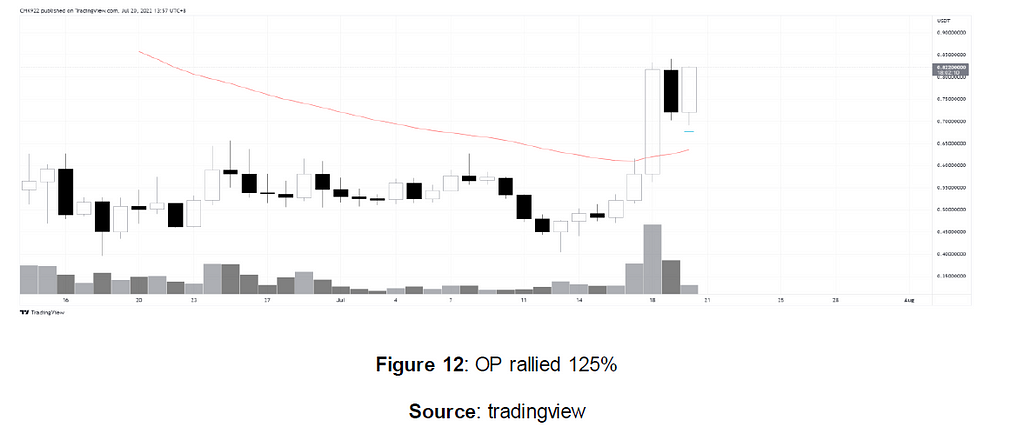
The second category is new protocols that are expected to generate strong positive revenue growth. Some of the relatively new tokens are LOOKS, OP and DYDX As seen above, LOOKS and DYDX are dominating top dApps and blockchain protocols in terms of revenue growth. These tokens are also quite new on the market compared with ETH and SOL.
3. Conclusion
The prolonged downtrend has drained supply out of the bear market. Demand emerged on June 19 which set the local bottom price of ETH. The ETH price went through a consolidation and accumulation period. Additionally, the ETH 2.0 merge announcement without a doubt accelerated the upward trend movement of ETH by attracting more demand. ETH is now signaling a position of strength.
An accumulation phase has been played out in Bitcoin. Demand emerged on June 19 to reverse the downtrend by kick-starting sideway consolidation and accumulation. The lowered rate hike expected by St. Louis Fed President James Bullard stoked demand for crypto. On July 20, the BTC price broke out of the trading range and signaled a position of strength.
Readers should also bear in mind that the techniques by Wyckoff cannot predict how far prices can rise. What we observed from BTC/USD is an accumulation phase deployed across mid-June to mid-July. Smart money and whales can distribute their cheap token accumulated at lower price levels whenever and wherever they deem fit. The selling pressure cannot be forecast until signs of weaknesses are observed in the future.
Disclaimer
1. The author of this report and his organization do not have any relationship that affects the objectivity, independence, and fairness of the report with other third parties involved in this report.
2. The content of the report is for reference only, and the facts and opinions in the report do not constitute business, investment and other related recommendations. The author does not assume any responsibility for the losses caused by the use of the contents of this report, unless clearly stipulated by laws and regulations. Readers should not only make business and investment decisions based on this report, nor should they lose their ability to make independent judgments based on this report.
3. The information, opinions and inferences contained in this report only reflect the judgments of the researchers on the date of finalizing this report. In the future, based on industry changes and data and information updates, there is the possibility of updates of opinions and judgments.
4. The copyright of this report is only owned by Huobi Blockchain Research Institute. If you need to quote the content of this report, please indicate the source. If you need a large amount of reference, please inform in advance (see “About Huobi Blockchain Research Institute” for contact information), and use it within the allowed scope. Under no circumstances shall this report be quoted, deleted or modified contrary to the original intent.
5. The copyright of this report is only owned by Huobi Blockchain Research Institute. If you need to quote the content of this report, please indicate the source. If you need a large amount of reference, please inform in advance (see “About Huobi Blockchain Research Institute” for contact information), and use it within the allowed scope. Under no circumstances shall this report be quoted, deleted or modified contrary to the original intent.
About Huobi Research Institute
Huobi Blockchain Application Research Institute (referred to as “Huobi Research Institute”) was established in April 2016. Since March 2018, it has been committed to comprehensively expanding the research and exploration of various fields of blockchain. As the research object, the research goal is to accelerate the research and development of blockchain technology, promote the application of blockchain industry, and promote the ecological optimization of the blockchain industry. The main research content includes industry trends, technology paths, application innovations in the blockchain field, Model exploration, etc. Based on the principles of public welfare, rigor and innovation, Huobi Research Institute will carry out extensive and in-depth cooperation with governments, enterprises, universities and other institutions through various forms to build a research platform covering the complete industrial chain of the blockchain. Industry professionals provide a solid theoretical basis and trend judgments to promote the healthy and sustainable development of the entire blockchain industry.
Consulting email:
research@huobi.com
Official website:
https://research.huobi.com/
Twitter: @Huobi_Research
https://twitter.com/Huobi_Research
Medium: Huobi Research
https://medium.com/huobi-research
Wyckoff Methodology on BTC & ETH local bottom formation and valuable protocols after the bear was originally published in Huobi Research on Medium, where people are continuing the conversation by highlighting and responding to this story.
Disclaimer
The views and opinions expressed in this article are solely those of the authors and do not reflect the views of Bitcoin Insider. Every investment and trading move involves risk - this is especially true for cryptocurrencies given their volatility. We strongly advise our readers to conduct their own research when making a decision.