Latest news about Bitcoin and all cryptocurrencies. Your daily crypto news habit.

Quality assurance engineers know that choosing the right technology stack for testing Android applications can be a real pain. The tools you pick have to be catered specifically to the needs and features of a particular app, and you might have to go through a number of paid and open-source instruments before you find what works best.
Among all of the tools out there, there’s one particular tool we’d like to talk about — the Android Studio IDE (AS IDE). It’s primarily a developer’s instrument, used as a native environment for design, development, and testing. However, it’s not exclusively a developer’s toy. In fact, here at SteelKiwi we believe that the Android Studio IDE should be in every quality assurance engineer’s toolbox.
This article is a short guide on how to use several AS IDE features to improve the quality of your everyday work. We cover the basics of creating Android virtual device configurations, running ADB commands, recording device logs, monitoring the use of hardware resources, and more.
What is Android Studio IDE?
Android Studio IDE is an integrated environment for Android development. It was announced on May 16, 2013 during the Google I/O event, and in December 2014 JetBrains presented the first official AS IDE version 1.0. By 2017, the third version of the app was already available — and it’s widely used and appreciated by millions of IT professionals all over the world.
The Android Studio IDE can be installed with the Java Development Kit (JDK). Once it’s installed properly, you can simply plug in a test device and start working. Note that the AS IDE is quite demanding of system resources, so it would be best to make sure that your machine meets the minimum requirements before installing.
Steelkiwi advice: For those running Windows: on top of the IDE, you also need to install the ADB Driver so that you’re able to connect test devices via USB cable.
Exploring the interface
The main window of the AS IDE consists of many elements. It can be rather intimidating at first, but everything gets much better once you realize that the features are neatly packed into a number of key areas:
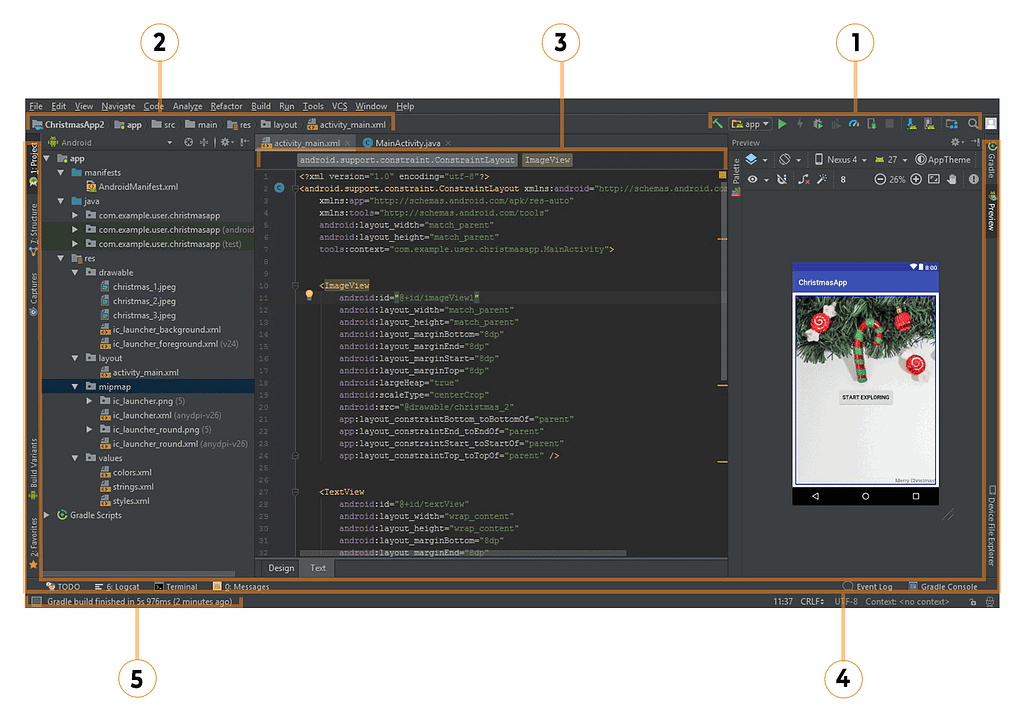 Android studio main window interface
- The toolbar is used to work with apps whose source code has been cloned from a repository.
- The navigation bar (naturally) helps you navigate project files.
- The editor window displays code that can be edited.
- The tool window bar, located outside the main AS IDE window, offers a number of buttons to open additional tools.
- The status bar displays the status of the last action performed within the IDE.
Steelkiwi advice: The Android Studio IDE offers quite a lot of features, and it takes some time to get used to it. The more you play around, the faster you’ll learn.
AS IDE for quality assurance
Here at SteelKiwi, we use a number of Android Studio features to aid us with QA testing:
- Emulators with different API versions, settings, and configurations
- Android Device Monitor for recording logs
- Terminal ADB commands to manage builds and data
- UI Monkey Exerciser for stress tests
- Android Profiler to monitor CPU, RAM, and network usage
Emulators
When you don’t have a physical device running the version of Android you need, an emulator can be a lifesaver. However, they’re also awesome for checking various settings and UIs, simulating interruptions, faking GPS coordinates, rotating screens, and so on.
Keep in mind that some hardware cannot be replicated with emulators: Bluetooth devices, SD card insertion/ejection, NFC modules, plugged-in headphones, and USB cables, for instance.> Newer virtual devices with higher-level APIs can support the emulation of Wi-Fi and have Google Play services pre-installed.
Steelkiwi advice: Newer virtual devices with higher-level APIs can support the emulation of Wi-Fi and have Google Play services pre-installed.
Of course, you shouldn’t think that a virtual device is a full-fledged substitute for a physical one, but they’re still pretty cool for some types of tests, especially given that the Android platform fragmentation is a real (and quite painful) thing.
The SteelKiwi QA team often uses emulators during the early stages of development to check the layout on flagship phones, as we need to make sure that each detail corresponds with the design samples across a number of screen resolutions.
Here’s our step-by-step guide to setting up an emulator in the AS IDE:
- Launch Android Studio IDE.
- Navigate to Tools -> Android -> AVD -> Manager to launch the Android Virtual Device (AVD) manager. The main AVD window displays a list of configurations that have been created previously. From here, you can delete virtual devices and also run devices, clone devices, and wipe data.
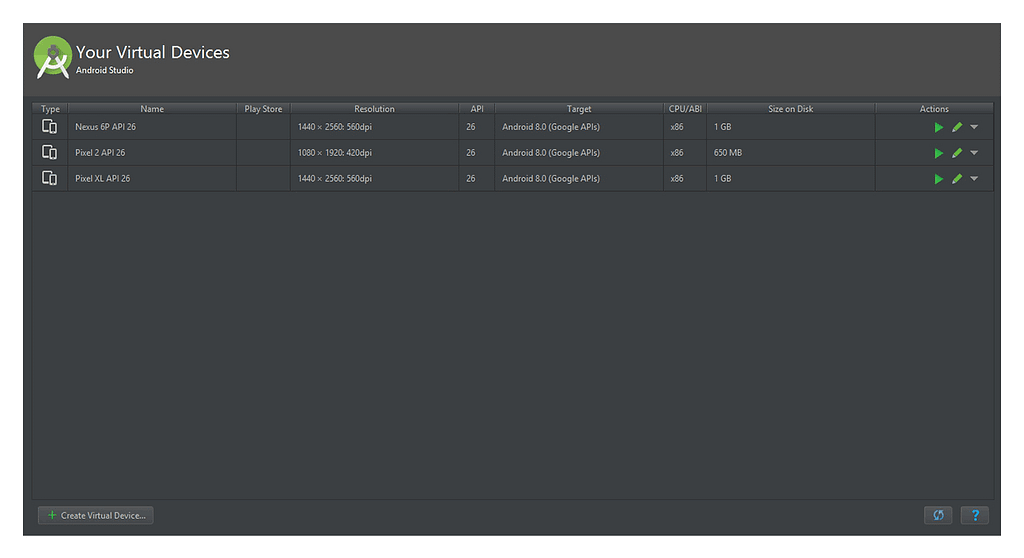 Android Virtual Device manager main window interface
3. To add a new configuration, simply click Create Virtual Device, which opens the Select Hardware window. Here, you can choose a virtual device from the list of categories and models. If you’re looking for a specific device that isn’t available in the standard collection, you can either import an existing hardware profile or build it yourself. Once you’ve selected a device, click Next to continue.
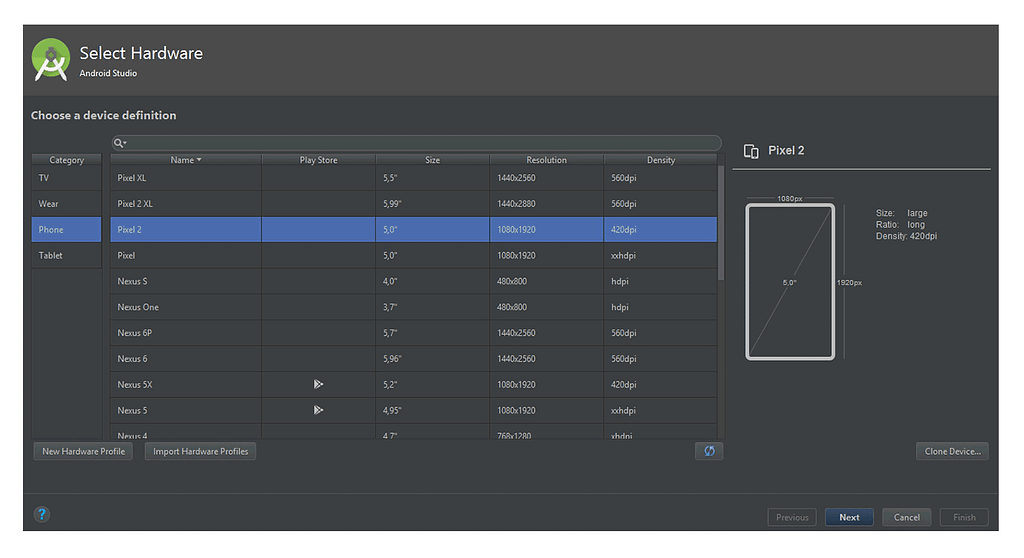 Select Hardware main window interface
4. In the System Image window, select the version of Android you want the virtual device to run. You can either choose from the recommended images or use the x86 ones. Once you’ve chosen, click Next again.
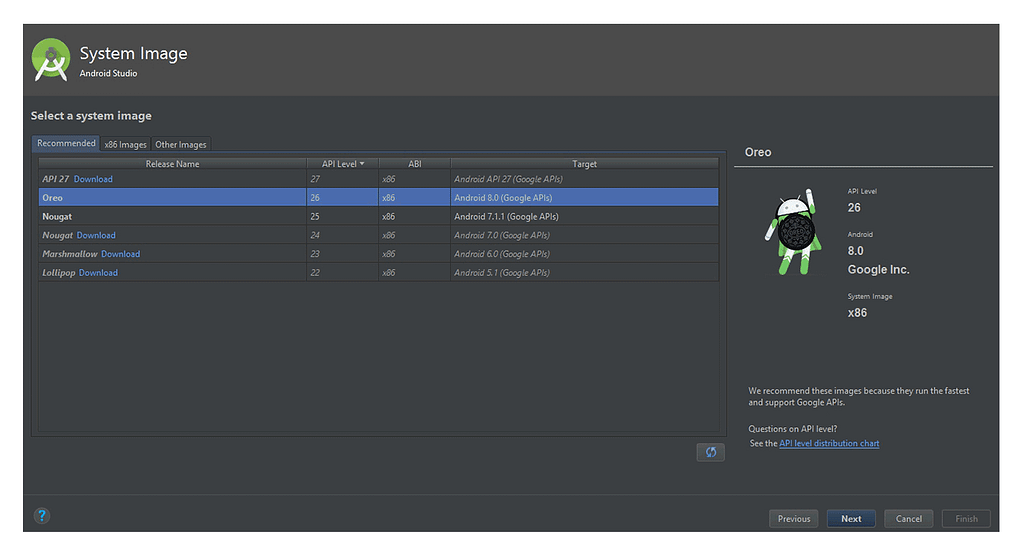 System image main window interface
5. Verify the selected configuration and click Finish to create your virtual device.
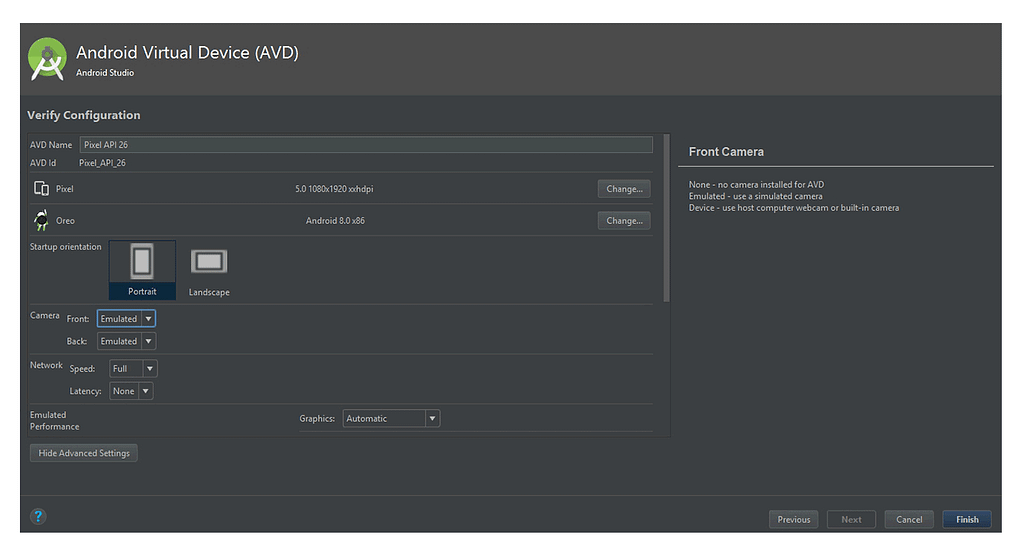 Verify configuration main window interfaceSteelkiwi advice: The Verify Configuration window allows you to make a number of configurations before running an emulator. By clicking Show Advanced Settings, you can disable the device frame (which could be useful when your computer doesn’t have enough RAM), select between portrait and landscape modes, and reserve virtual memory. There are some other settings as well, so feel free to explore them on your own.
Now you’re ready to start testing. Launch the emulator and drag your .apk file onto the empty screen. The installation process will begin automatically, and the application will be added to your virtual device.
Here’s a small list of things you can do with an emulator:
- Rotate the screen from portrait to landscape and vice versa
- Take screenshots
- Set GPS coordinates
- Set network type and signal strength
- Make battery adjustments
- Simulate phone call interruptions
- Configure virtual sensors
- Generate bug reports with logs
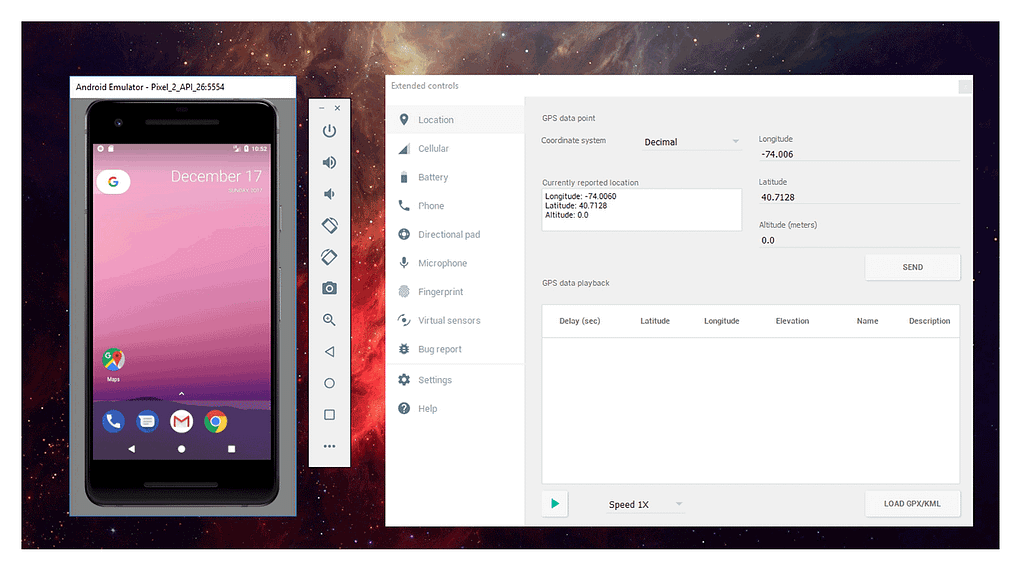 Emulator and Settings window interfaceSteelkiwi advice: Remember that using a virtual device is only good when you’re not testing usability, user experience, gestures, changes in device location, response speed, and similar things. Our team always tries to combine the best of both worlds by alternating between physical devices and virtual ones depending on the context.
Recording device logs
Logs are records of an application’s activity that help identify crashes and locate their source. Recording logs properly is integral to testing, especially when bug reports describe severe defects. Reports save developers a lot of time and allow them to concentrate on fixing issues instead of reproducing them.
The AS IDE has a built-in feature that helps keep track of logs both in real time (for connected devices via the Logcat window) and by recording them to a .txt file. The Logcat window can also be used to run the app through troublesome places and observe whatever’s going on when code is executed. As QA engineers, our task is to record the necessary logs and attach the .txt file containing them to our bug report, thus providing a more in-depth presentation of the issue.
Steelkiwi advice: Before trying to record any logs from an Android device, you should first verify that the app developer has enabled log visibility in the dev build you’re about to test. Unless they have, the logs won’t be visible and thus will be impossible to record (the .txt file will simply be empty).
Note that there’s a number of log level types that a device can record in a second, but we’re only concentrating on the errors occurring within a given app (for which we apply a filter). Errors are the most illustrative when it comes to fixing crashes and identifying the reason they occurred.
Here’s our guide to help you start recording logs via Android Device Monitor:
- Make sure that log visibility has been enabled and that logs are visible.
- Connect your test device to the computer via the Android Debug Bridge and verify that a connection has been established.
- Navigate to Tools -> Android -> Android Device Monitor.
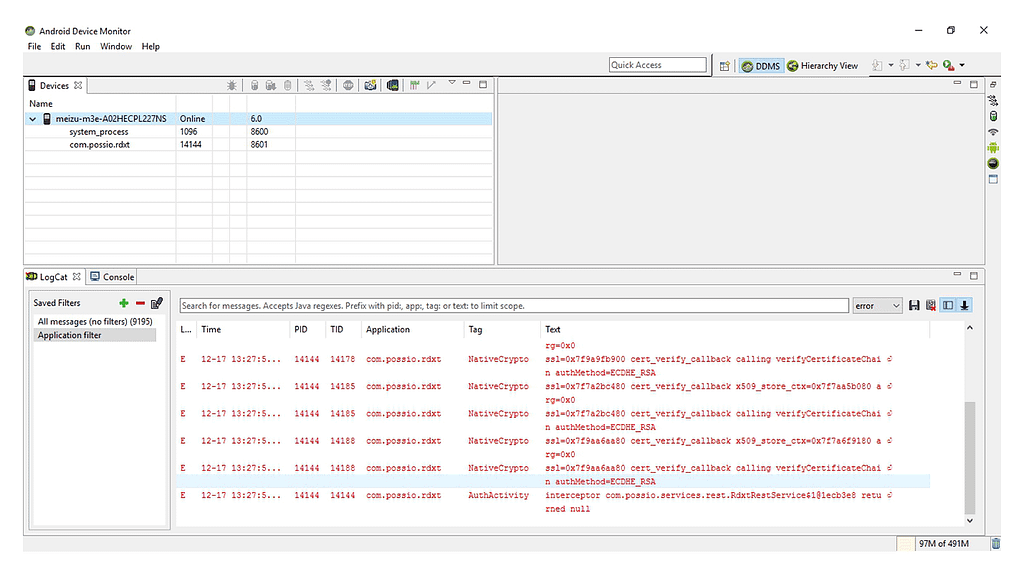
- Launch the Android Device Monitor. If the connection with your test device has been established properly, you’ll be able to see a lot of logs displayed in the Logcat tab and track new ones appearing every second. Your goal is now to filter them and get the window to display application logs only (omitting system processes and other such stuff).
- Click Add a New Logcat Filter.
- Type the filter name in the Filter Name field.
- Type the package name in the by Application Name field and click OK. In order to get the package name, you can either ask the developer or run an ADB command. Other fields can be left empty.
- Select the Error filter.
- Launch the application on your connected device and recreate the sequence of actions that cause the crash or unpredicted behavior.
- After you’ve successfully reproduced the crash, click Export Selected Items to Text Fileto save the recorded logs as a .txt file
- Open the saved file to check whether the logs have actually been saved.
- Attach the log file to your bug report.
 Android Device Monitor main window interface
ADB commands
Android Debug Bridge (ADB) is a command-line instrument that creates a virtual layer between your computer and the connected test device (or its emulator), allowing you to execute terminal commands on the Android device. These commands can help you manage builds, clear the application cache, record logs, reboot the device, and so on. ADB is a client-server program containing three main components:
- A client, which runs on your host machine and sends commands to the connected device;
- A daemon (adbd), which is responsible for running commands on the connected device;
- A server, which controls the client-daemon communication.
Although there are many different ADB commands and parameters, we’re going to cover only the ones that are useful for QA engineers. All of them should be executed either on the connected test device itself (which has USB debugging enabled) or on an emulator.
Steelkiwi advice: If you’re encountering issues executing ADB commands, double-check to see whether you’ve installed the ADB drivers properly and then try again.
Here’s SteelKiwi’s list of useful commands:
- adb devices — checks whether the device is properly connected to your computer via the Android Debug Bridge and displays the DEVICE_ID
- adb devices DEVICE_ID install appname.apk — lets you install programs from the host machine to the connected test device by using the .apk file name; before using this command, make sure you’ve located the folder containing YOUR_BUILD.apk file through the terminal
- adb devices DEVICE_ID uninstall com.package.name — uninstalls programs from the connected device by package name
- adb install -r appname.apk — simulates application .update
- adb shell dumpsys window windows | grep Focus — helps identify the package name. (Note that the package of the program whose name you want to get should be launched on the connected test device when you’re executing this command.)
Steelkiwi advice: To execute adb shell dumpsys window windows | grep Focus on Windows, use findstr instead of grep.
Here’s another way you can get the package name:
- adb shell to enable the shell mode
- pm list packages -f to display the list of packages installed on the connected device
- exit to exit the shell mode
- adb shell screencap /sdcard/Download/Bluetooth/screenshot.png to make a screenshot of the connected device and save it to any folder
- adb shell am force-stop com.package.name to close the application. (This command is especially useful when the app has frozen and isn’t responding).
- adb shell pm clear com.package.name to delete the app’s cache and all of its previously collected data
If for some reason you aren’t able to record logs via the Android Device Monitor, you can always do it with the ADB commands. For this method to work, you don’t need to launch AS IDE, but your computer has to recognize the device properly. Here’s how you can record and save logs using ADB commands:
- Make sure that logs are visible.
- Connect the test device to your computer via the Android Debug Bridge and verify that the connection has been established properly.
- Open the AS IDE terminal or another terminal.
- Type the following command into your terminal: adb -d logcat *:E | grep com.package.name > name_of_logfile.txt You should write the application package name and specify the name for the log file.
Steelkiwi advice: ADB commands are very flexible — you can set different filters and parameters for viewing and recording logs. Again, use findstr instead of grep for Windows machines.
5. Launch the application on your test device and recreate the sequence of actions that leads to the crash or unexpected behavior.
6. Stop recording by pressing Ctrl + c within the terminal.
7. Open the .txt file and check to see whether the logs have been recorded properly.
8. Attach this file to your bug report.
As you can see, ADB commands can make application testing a lot more efficient.
Testing with Monkey: Create simple stress tests
Monkey-generated scenarios have a random number of inputs, touches, and gestures to imitate a variety of user interactions. One such combination could very easily lead to crashes or freezes. If you only use a manual testing approach, it would be easy to miss some of the less obvious cases, and you’ll be able to notice such defects only after the app has been officially released. That’s why Monkey is so cool — it allows us identify bugs and prevent negative feedback from real-life users.
Apart from that, automated Monkey tests are very easy to set up and execute: just launch the AS IDE, connect your test device, enter a command, and you’re good to go.
By performing Monkey tests, you can verify long-time application reliability. Monkey is a flexible instrument, offering plenty of features. For instance, you can run tests on both emulators and physical devices, change the speed of code execution, record command sequences, and reuse your tests. Monkey makes imitating long-term use a lot easier, helping you make sure that the software doesn’t show any issues under a continuous load.
Here’s a guide on how to run a simple stress test using the UI Monkey Exerciser tool. Before starting the test, perform the following actions:
- Launch the AS IDE.
- Connect your test device via ADB or run an emulator.
- Open an integrated command line or the terminal.
- Launch the application you want to stress test and keep it open.
You can perform stress tests straight from the terminal without launching the AS IDE. To do so, just launch the terminal and make sure that the device is connected and properly recognized by your machine. To launch a simple test, execute the following command: adb shell monkey -p com.package.name -v 300
This test will be performed with 300 random touches and gestures, including the use of system keys. If you want to do more, simply increase the number of gestures and launch the test again.
For a more advanced version of this test, add the — pct-syskeys 0 key to make Monkey exclude system keys. The updated command should look like this: db shell monkey — pct-syskeys 0 -p com.package.name -v 300 Now run the command and compare your results to the previous command — you’ll see that the behavior and sequence of actions have changed. Cool, right? Well, it’s just the beginning.
To slow down the execution of actions, use the following command: adb shell monkey — pct-syskeys 0 — throttle 100 -p com.package.name -v 300 Here, you can set whatever throttle value you want in milliseconds. The set delay will occur between each action.
To record the sequence, use the following command:
adb shell monkey — pct-syskeys 0 — throttle 100 -p com.package.name -s 1 -v 300
Steelkiwi advice: If you want to apply the same sequence again, simply add -s 1.
This command is especially useful when you’ve found an issue within a recorded sequence and want to check whether the developer has actually solved it.
Once a sequence has caused a crash, use the following command to kill the process:
adb shell monkey — kill-process-after-error — pct-syskeys 0 — throttle 100 -p com.package.name -s 1 -v 300
There are many ways in which you can specify stress in the Monkey UI Application Exerciser. You can find the full list of commands by typing adb shell monkey. Use them to create tests that are suited to your situation.
We also strongly recommend that you play around with the — pct keys. These are the ones that can add settings and configure tests according to your needs. You can use them after finishing all of the defined testing activities to make a couple of extra reliability checks. The whole idea of using this tool is not to break the application, but to find its vulnerable spots where exceptions in code could lead to crashes and unexpected behaviors given a certain combination of inputs.
Android Profiler: monitor CPU, memory, and network
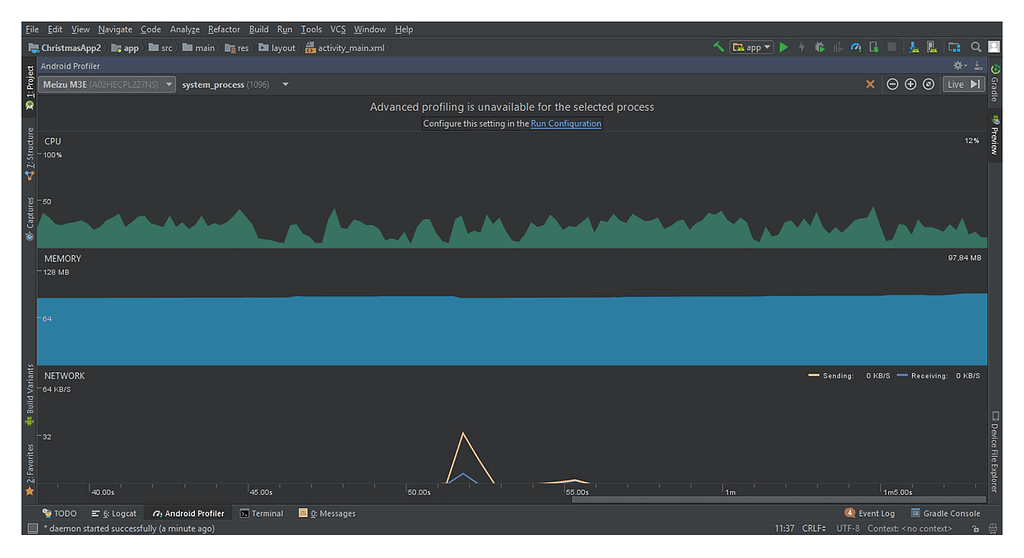
Android Profiler allows us to view detailed statistics about the CPU, memory, and network of your test device. We often use the profiler when measuring application performance, especially when an app freezes or responds poorly on a number of target devices.
By default, the profiler displays a timeline with high-level graphs. The profiler can also record data and get more detailed information, but if you’re using a device with API level less than 26, you’ll need to enable it in settings.
 Android Profiler main window interface
In order to enable advanced profiling, navigate to Run -> Edit Configurations -> Profiling -> Enable Advanced Profiling. After turning on this option, you’ll be able to click on the high-level graph and see detailed information about the settings displayed.
CPU monitoring allows you to monitor the central processing unit, displaying usage in real time. Advanced monitoring gives even more details about the traces of each method. Optimizing CPU usage will provide a smooth user experience and save battery life, resulting in an application that’s more pleasant to use. Because of that, we need to use the CPU monitor and be able to deliver this type of information to developers.
You can record traces by performing the following steps:
- Connect a physical device to your computer and verify that the connection has been established properly.
- Open the Android profile and select your app’s profile information.
- Click on the CPU graph to open the low-level information pack.
- Select Instrumented or Sampled configuration.
- Click Record.
- Start interacting with the app you’re testing and click Stop when you’re done.
Memory monitoring presents a real-time graph of your app’s memory usage and can help identify memory leaks, which are processes that cause an uncontrollable decrease in your device’s available RAM. There are a couple of reasons why memory leaks can appear. For instance, code might be written poorly so that objects that aren’t used by the app keep taking up device memory even though they should’ve been removed by the Garbage Collector. When something like this happens, you’re likely to get the OutOfMemoryError and see the app crash.
How can you identify memory leaks?
First, check the app’s memory in real time via the memory monitor: just open the application you’re testing and repeat the same sequence of actions a couple of times. If you notice that memory consumption is increasing with each iteration, you could be facing a memory leak.
How can you record information about memory leaks?
- Connect a physical device and verify that the connection has been established properly.
- Open the Android Device Monitor.
- Select the application you want to test and click Update Heap.
- Perform any repeatable sequence of actions a couple of times.
- After you’re done interacting with the application, click Dump HPROF file.
- Save the generated file and give it to the Android developer.
Whenever there’s a memory leak, you’ll see an increase in the size of allocated memory.
Network monitoring displays real-time network activity, letting you observe an application’s send and receive requests. You can also track how often the app turns the device’s radio transmitter on when in a high power state. If it does, the radio will not only waste battery life to send and receive requests, but will also use additional power to keep itself running.
This process is impossible to record, but is rather simple to analyze by investigating the amount of traffic and the content of server requests and responses.
Conclusion
In this article, we’ve covered some Android Studio IDE features that are useful for QA engineers. AS IDE is a tool clearly made not only for developers.
Of course, it has a number of disadvantages, but they usually come in the form of how much time it takes to explore the app’s features and how many hardware resources it requires. But the functionality that comes with the AS IDE totally justifies its drawbacks.
Implement the Android Studio IDE whenever testing Android applications, and don’t stop exploring it on your own to keep on improving your professional skills.
Useful links:
- What is Android Debug Bridge?
- How can you set up an emulator?
- View logs with Logcat
- Using the CPU monitor
- Using the network monitor
Originally published at steelkiwi.com
Quality Assurance Toolkit: Using Android Studio IDE was originally published in Hacker Noon on Medium, where people are continuing the conversation by highlighting and responding to this story.
Disclaimer
The views and opinions expressed in this article are solely those of the authors and do not reflect the views of Bitcoin Insider. Every investment and trading move involves risk - this is especially true for cryptocurrencies given their volatility. We strongly advise our readers to conduct their own research when making a decision.
