Latest news about Bitcoin and all cryptocurrencies. Your daily crypto news habit.
NOTE: I have originally published this article a while ago on Toptal blog.
I once drove an Audi with a V8 twin-turbo engine inside, and its performance was incredible. I was driving at around 140MPH on IL-80 highway near Chicago at 3AM when there was nobody on the road. Ever since then, the term “V8” has become associated with high performance to me.
Node.js is a platform built on Chrome’s V8 JavaScript engine for easy building of fast and scalable network applications.
Although Audi’s V8 is very powerful, you are still limited with the capacity of your gas tank. The same goes for Google’s V8 — the JavaScript engine behind Node.js. Its performance is incredible and there are many reasons why Node.js works well for many use cases, but you’re always limited by the heap size. When you need to process more requests in your Node.js application you have two choices: either scale vertically or scale horizontally. Horizontal scaling means you have to run more concurrent application instances. When done right, you end up being able to serve more requests. Vertical scaling means that you have to improve your application’s memory usage and performance or increase resources available for your application instance.
Debugging Memory Leaks in Node.js Applications
Recently I was asked to work on a Node.js application for one of my Toptal clients to fix a memory leak issue. The application, an API server, was intended to be able to process hundreds of thousands of requests every minute. The original application occupied almost 600MB of RAM and therefore we decided to take the hot API endpoints and reimplement them. Overhead becomes very pricey when you need to serve many requests.
For the new API we chose restify with native MongoDB driver and Kue for background jobs. Sounds like a very lightweight stack, right? Not quite. During peak load a new application instance could consume up to 270MB of RAM. Therefore my dream of having two application instances per 1X Heroku Dyno vanished.
Node.js Memory Leak Debugging Arsenal
Memwatch
If you search for “how to find leak in node” the first tool you’d probably find is memwatch. The original package was abandoned a long time ago and is no longer maintained. However you can easily find newer versions of it in GitHub’s fork list for the repository. This module is useful because it can emit leak events if it sees the heap grow over 5 consecutive garbage collections.
Heapdump
Great tool which allows Node.js developers to take heap snapshot and inspect them later with Chrome Developer Tools.
Node-inspector
Even a more useful alternative to heapdump, because it allows you to connect to a running application, take heap dump and even debug and recompile it on the fly.
Taking “node-inspector” for a Spin
Unfortunately, you will not be able to connect to production applications that are running on Heroku, because it does not allow signals to be sent to running processes. However, Heroku is not the only hosting platform.
To experience node-inspector in action, we will write a simple Node.js application using restify and put a little source of memory leak within it. All experiments here are made with Node.js v0.12.7, which has been compiled against V8 v3.28.71.19.
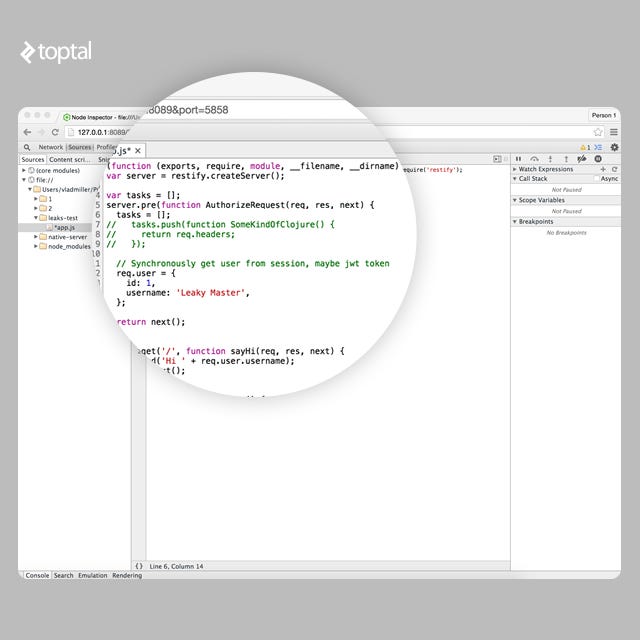
var restify = require('restify');var server = restify.createServer();var tasks = [];server.pre(function(req, res, next) { tasks.push(function() { return req.headers; }); // Synchronously get user from session, maybe jwt token req.user = { id: 1, username: 'Leaky Master', }; return next();});server.get('/', function(req, res, next) { res.send('Hi ' + req.user.username); return next();});server.listen(3000, function() { console.log('%s listening at %s', server.name, server.url);});The application here is very simple and has a very obvious leak. The array tasks would grow over application lifetime causing it to slow down and eventually crash. The problem is that we are not only leaking closure but entire request objects as well.
GC in V8 employs stop-the-world strategy, therefore it means more objects you have in memory the longer it will take to collect garbage. On log below you can clearly see that in the beginning of the application life it would take an average of 20ms to collect the garbage, but few hundred thousand requests later it takes around 230ms. People who are trying to access our application would have to wait 230ms longer now because of GC. Also you can see that GC is invoked every few seconds which means that every few seconds users would experience problems accessing our application. And delay will grow up until application crashes.
[28093] 7644 ms: Mark-sweep 10.9 (48.5) -> 10.9 (48.5) MB, 25.0 ms [HeapObjectsMap::UpdateHeapObjectsMap] [GC in old space requested]. [28093] 7717 ms: Mark-sweep 10.9 (48.5) -> 10.9 (48.5) MB, 18.0 ms [HeapObjectsMap::UpdateHeapObjectsMap] [GC in old space requested]. [28093] 7866 ms: Mark-sweep 11.0 (48.5) -> 10.9 (48.5) MB, 23.2 ms [HeapObjectsMap::UpdateHeapObjectsMap] [GC in old space requested]. [28093] 8001 ms: Mark-sweep 11.0 (48.5) -> 10.9 (48.5) MB, 18.4 ms [HeapObjectsMap::UpdateHeapObjectsMap] [GC in old space requested]. ... [28093] 633891 ms: Mark-sweep 235.7 (290.5) -> 235.7 (290.5) MB, 357.3 ms [HeapObjectsMap::UpdateHeapObjectsMap] [GC in old space requested]. [28093] 635672 ms: Mark-sweep 235.7 (290.5) -> 235.7 (290.5) MB, 331.5 ms [HeapObjectsMap::UpdateHeapObjectsMap] [GC in old space requested]. [28093] 637508 ms: Mark-sweep 235.7 (290.5) -> 235.7 (290.5) MB, 357.2 ms [HeapObjectsMap::UpdateHeapObjectsMap] [GC in old space requested].
These log lines are printed when a Node.js application is started with the –trace_gc flag:
node --trace_gc app.js
Let us assume that we have already started our Node.js application with this flag. Before connecting the application with node-inspector, we need to send it the SIGUSR1 signal to the running process. If you run Node.js in cluster, make sure you connect to one of the slave processes.
kill -SIGUSR1 $pid # Replace $pid with the actual process ID
By doing this, we are making the Node.js application (V8 to be precise) enter debugging mode. In this mode, the application automatically opens the port 5858 with V8 Debugging Protocol.
Our next step is to run node-inspector which will connect to the debugging interface of the running application and open another web interface on port 8080.
$ node-inspector Node Inspector v0.12.2 Visit http://127.0.0.1:8080/?ws=127.0.0.1:8080&port=5858 to start debugging.
In case the application is running on production and you have a firewall in place, we can tunnel remote port 8080 to localhost:
ssh -L 8080:localhost:8080 admin@example.com
Now you could open your Chrome web browser and get full access to Chrome Development Tools attached to your remote production application. Unfortunately, Chrome Developer Tools will not work in other browsers.
Let’s Find a Leak!
Memory leaks in V8 are not real memory leaks as we know them from C/C++ applications. In JavaScript variables do not disappear into the void, they just get “forgotten”. Our goal is to find these forgotten variables and remind them that Dobby is free.
Inside Chrome Developer Tools we have access to multiple profilers. We are particularly interested in Record Heap Allocations which runs and takes multiple heap snapshots over time. This gives us a clear peek into which objects are leaking.
Start recording heap allocations and let’s simulate 50 concurrent users on our home page using Apache Benchmark.
ab -c 50 -n 1000000 -k http://example.com/
Before taking new snapshots, V8 would perform mark-sweep garbage collection, so we definitely know that there is no old garbage in the snapshot.
Fixing the Leak on the Fly
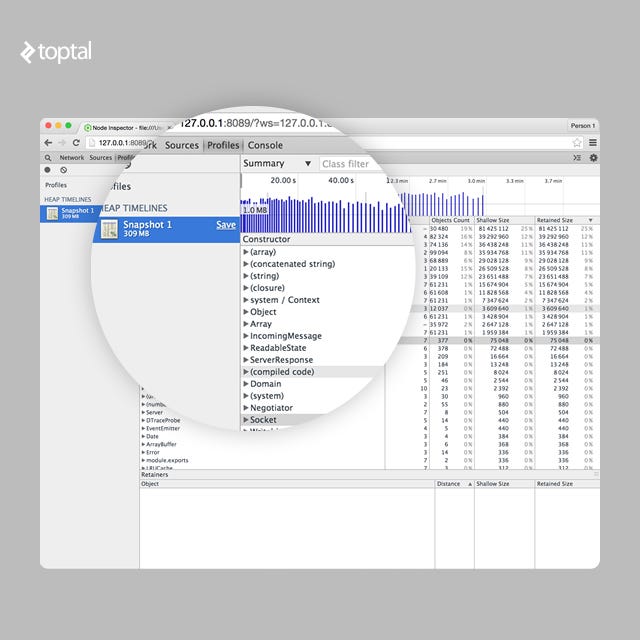
After collecting heap allocation snapshots over a period of 3 minutes we end up with something like the following:
We can clearly see that there are some gigantic arrays, a lot of IncomingMessage, ReadableState, ServerResponse and Domain objects as well in heap. Let’s try to analyze the source of the leak.
Upon selecting heap diff on chart from 20s to 40s, we will only see objects which were added after 20s from when you started the profiler. This way you could exclude all normal data.
Keeping note of how many objects of each type are in the system, we expand the filter from 20s to 1min. We can see that the arrays, already quite gigantic, keeps growing. Under “(array)” we can see that there are a lot of objects “(object properties)” with equal distance. Those objects are the source of our memory leak.
Also we can see that “(closure)” objects grow rapidly as well.
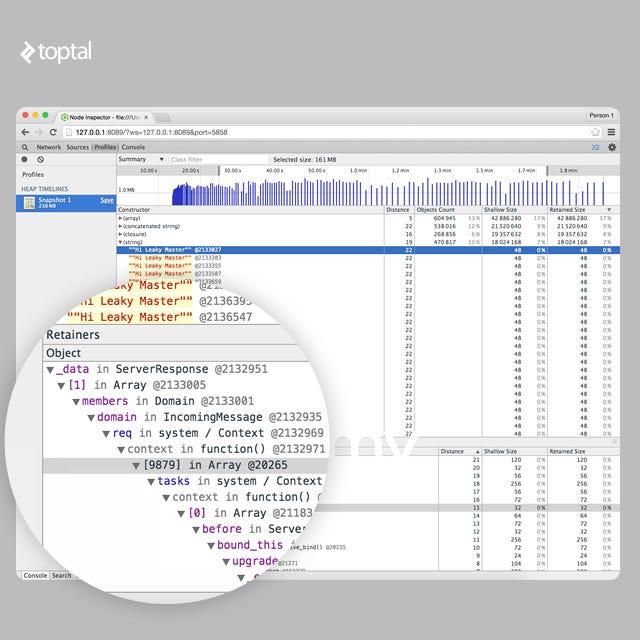
It might be handy to look at the strings as well. Under the strings list there are a lot of “Hi Leaky Master” phrases. Those might give us some clue too.
In our case we know that the string ”Hi Leaky Master” could only be assembled under the “GET /” route.
If you open retainers path you will see this string is somehow referenced via req, then there is context created and all this added to some giant array of closures.
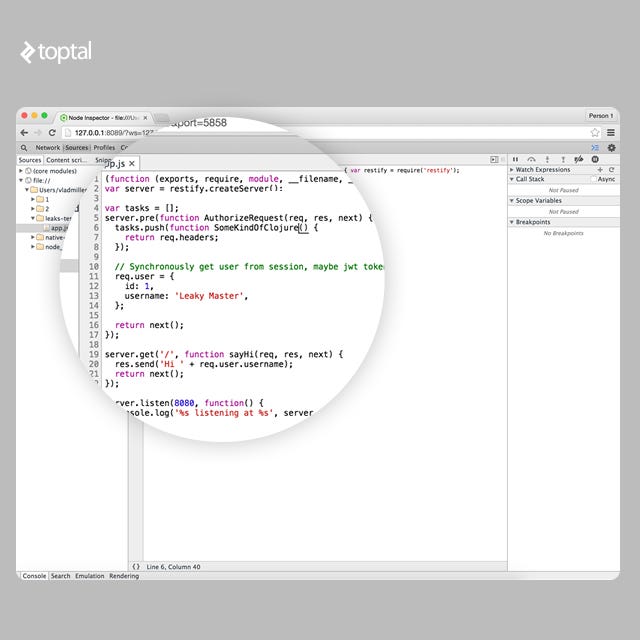
So at this point we know that we have some kind of gigantic array of closures. Let’s actually go and give a name to all our closures at real-time under sources tab.
After we are done editing the code, we can hit CTRL+S to save and recompile code on the fly!
Now let’s record another Heap Allocations Snapshot and see which closures are occupying the memory.
It’s clear that SomeKindOfClojure() is our villain. Now we can see that SomeKindOfClojure() closures are being added to some array named tasks in the global space.
It’s easy to see that this array is just useless. We can comment it out. But how do we free memory the memory already occupied? Very easy, we just assign an empty array to tasks and with the next request it will be overridden and memory will be freed after next GC event.
Dobby is free!
Life of Garbage in V8
Well, V8 JS does not have memory leaks, only forgotten variables.
V8 heap is divided into several different spaces:
- New Space: This space is relatively small and has a size of between 1MB and 8MB. Most of the objects are allocated here.
- Old Pointer Space: Has objects which may have pointers to other objects. If object survives long enough in New Space it gets promoted to Old Pointer Space.
- Old Data Space: Contains only raw data like strings, boxed numbers and arrays of unboxed doubles. Objects that have survived GC in the New Space for long enough are moved here as well.
- Large Object Space: Objects which are too big to fit in other spaces are created in this space. Each object has it’s own mmap‘ed region in memory
- Code space: Contains assembly code generated by the JIT compiler.
- Cell space, property cell space, map space: This space contains Cells, PropertyCells, and Maps. This is used to simplify garbage collection.
Each space is composed of pages. A page is a region of memory allocated from the operating system with mmap. Each page is always 1MB in size except for pages in large object space.
V8 has two built in garbage collection mechanisms: Scavenge, Mark-Sweep and Mark-Compact.
Scavenge is a very fast garbage collection technique and operates with objects in New Space. Scavenge is the implementation of Cheney’s Algorithm. The idea is very simple, New Space is divided in two equal semi-spaces: To-Space and From-Space. Scavenge GC occurs when To-Space is full. It simply swaps To and From spaces and copy all live objects to To-Space or promote them to one of the old spaces if they survived two scavenges, and is then entirely erased from the space. Scavenges are very fast however they have the overhead of keeping double sized heap and constantly copying objects in memory. The reason to use scavenges is because most objects die young.
Mark-Sweep & Mark-Compact is another type of garbage collector used in V8. The other name is full garbage collector. It marks all live nodes, then sweeps all dead nodes and defragments memory.
GC Performance and Debugging Tips
While for web applications high performance might not be such a big problem, you will still want to avoid leaks at all costs. During the mark phase in full GC the application is actually paused until garbage collection is completed. This means the more objects you have in the heap, the longer it will take to perform GC and the longer users will have to wait.
Always give names to closures and functions
It’s much easier to inspect stack traces and heaps when all your closures and functions have names.
db.query('GIVE THEM ALL', function GiveThemAllAName(error, data) { ...})Avoid large objects in hot functions
Ideally you want to avoid large objects inside of hot functions so that all data is fit into New Space. All CPU and memory bound operations should be executed in background. Also avoid deoptimization triggers for hot functions, optimized hot function uses less memory than non-optimized ones.
Hot functions should be optimized
Hot functions that run faster but also consume less memory cause GC to run less often. V8 provides some helpful debugging tools to spot non-optimized functions or deoptimized functions.
Avoid polymorphism for IC’s in hot functions
Inline Caches (IC) are used to speed up execution of some chunks of code, either by caching object property access obj.key or some simple function.
function x(a, b) { return a + b;}x(1, 2); // monomorphicx(1, “string”); // polymorphic, level 2x(3.14, 1); // polymorphic, level 3When x(a,b) is run for the first time, V8 creates a monomorphic IC. When you call x a second time, V8 erases the old IC and creates a new polymorphic IC which supports both types of operands integer and string. When you call IC the third time, V8 repeats the same procedure and creates another polymorphic IC of level 3.
However, there is a limitation. After IC level reaches 5 (could be changed with –max_inlining_levels flag) the function becomes megamorphic and is no longer considered optimizable.
It’s intuitively understandable that monomorphic functions run the fastest and also have a smaller memory footprint.
Don’t add large files to memory
This one is obvious and well known. If you have large files to process, for example a large CSV file, read it line-by-line and process in little chunks instead of loading the entire file to memory. There are rather rare cases where a single line of csv would be larger than 1mb, thus allowing you to fit it in New Space.
Do not block main server thread
If you have some hot API which takes some time to process, such as an API to resize images, move it to a separate thread or turn it into a background job. CPU intensive operations would block main thread forcing all other customers to wait and keep sending requests. Unprocessed request data would stack in memory, thus forcing full GC to take longer time to finish.
Do not create unnecessary data
I once had a weird experience with restify. If you send a few hundred thousand requests to an invalid URL then the application memory would rapidly grow on up to hundred megabytes until a full GC kicks in a few seconds later, which is when everything would go back to normal. Turns out that for each invalid URL, restify generates a new error object which includes long stack traces. This forced newly created objects to be allocated in Large Object Space rather than in New Space.
Having access to such data could be very helpful during development, but obviously not required on production. Therefore the rule is simple — do not generate data unless you certainly need it.
Last, but certainly not the least, is to know your tools. There are various debuggers, leak cathers, and usage graphs generators. All those tools can help you make your software faster and more efficient.
Conclusion
Understanding how V8’s garbage collection and code optimizer works is a key to application performance. V8 compiles JavaScript to native assembly and in some cases well written code could achieve performance comparable with GCC compiled applications.
And in case you are wondering, the new API application for my Toptal client, although there is room for improvement, is working very well!
Joyent recently released a new version of Node.js which uses one of the latest versions of V8. Some applications written for Node.js v0.12.x may not be compatible with the new v4.x release. However, applications will experience tremendous performance and memory usage improvement within the new version of Node.js.
Originally published at www.toptal.com.
Debugging Memory Leaks in Node.js Applications was originally published in Hacker Noon on Medium, where people are continuing the conversation by highlighting and responding to this story.
Disclaimer
The views and opinions expressed in this article are solely those of the authors and do not reflect the views of Bitcoin Insider. Every investment and trading move involves risk - this is especially true for cryptocurrencies given their volatility. We strongly advise our readers to conduct their own research when making a decision.
