Latest news about Bitcoin and all cryptocurrencies. Your daily crypto news habit.
 Brought to you by PubNub
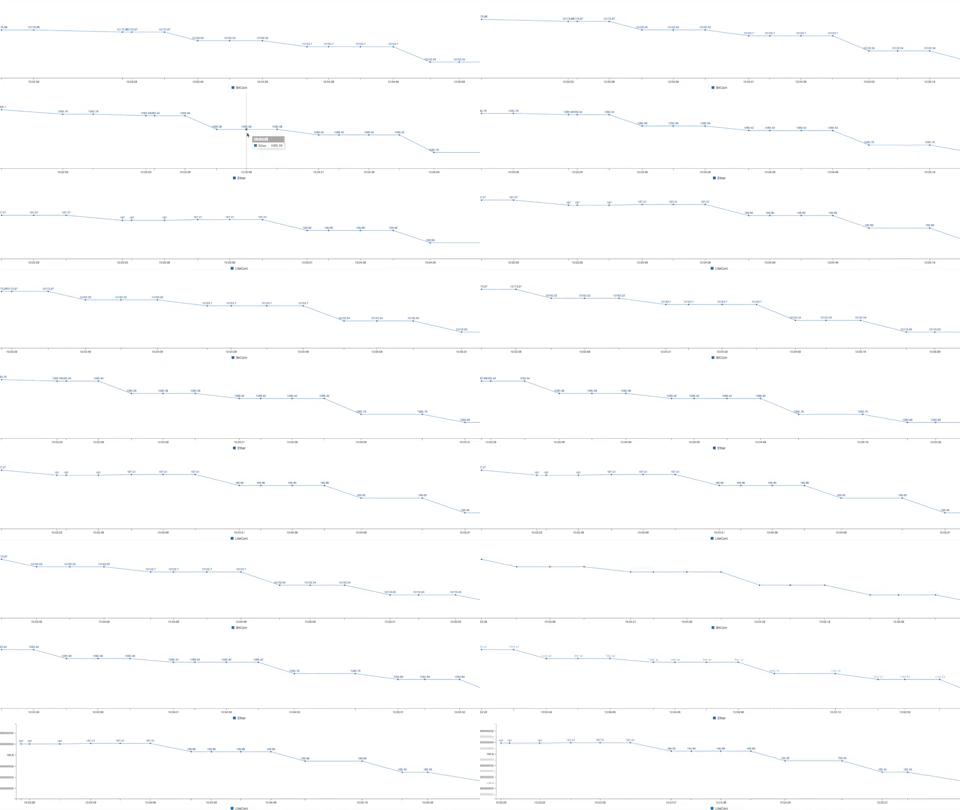
With the explosion of Bitcoin, Ethereum, and LiteCoin, and new cryptocurrencies being introduced by the day, we wanted to build a simple dashboard to track the pricing updates in realtime and provide a historical view of changes. In this case, we’ll track Bitcoin, Ethereum, and LiteCoin.
For this project, we used:
- PubNub JavaScript SDK (Messaging API and Backend)
- EON SDK (Chart Framework)
- CryptoCompare (Price API)
The application includes two HTML files, a publisher and subscriber. In this case, our publisher (you) will stream the pricing updates to the subscribers (theoretically any number of users who are looking at the dashboard) in realtime.
Running the Demo
To run the demo, open both the publisher and the subscriber HTML files. Plug in your pub/sub keys, and the publisher will begin streaming pricing data to your subscriber.
You’ll need to sign up for a PubNub account to get your unique pub/sub keys. Worry not, PubNub offers a generous sandbox tier that’s free forever.
The demo is set to publish new pricing data every 10 seconds, but you can easily adjust that on the publisher side.
Publisher
We’ll start by building the publisher. First, you’ll need to create a PubNub object and XHR object to make calls to the pricing API.
Next, we will need to add in the processRequest method for the XHR requests we are going to make. This method will take the response from CryptoCompare and then publish the individual pricing data to each channel. Because there will be three different charts, one for each currency, we will be publishing to PubNub on three different channels.
Now, let’s create our main function that will call the CryptoCompare API every 10 seconds to get the current prices for our currency. This request is for BitCoin, Ethereum, and LiteCoin and will be in USD. If you need additional currencies or another denomination, check out the documentation here.
Subscriber
Now that we have our publisher who sends the pricing updates, we need a subscriber to receive them. We’ll use EON, an open source framework for building realtime charts and graphs to build our interface. You’ll need to include them in the head of your page.
Now we need to add divs to our page for EON to render our graphs. At the top of the body is where you’ll will add them.
Next up we will need to initialize the PubNub object that we are going to pass into our EON graphs. Because the dashboard only needs to receive data and won’t be publishing, we will create the PubNub client with only a subscribe key.
Now we’re going to setup some variables to control how our charts look and act.
Now let’s create the graphs!
We will initialize 3 different EON charts and pass in our configuration properties we created. The graphs will share config properties and PubNub client, but each will be subscribed to the unique channels we created earlier.
Now we have a dashboard to watch the current prices of BitCoin, Ethereum, and LiteCoin!
Note: For production apps, for security sakes, you’ll want to enable Access Manager on your keyset and secure your publish keys so no one else can publish faulty data to your dashboard.
Originally published at www.pubnub.com.PubNub, our weekly sponsor, provides realtime APIs and global messaging infrastructure for building interactive apps of the future. Start Building Today.
Build a Cryptocurrency Price Tracker in 5 Minutes was originally published in Hacker Noon on Medium, where people are continuing the conversation by highlighting and responding to this story.
Disclaimer
The views and opinions expressed in this article are solely those of the authors and do not reflect the views of Bitcoin Insider. Every investment and trading move involves risk - this is especially true for cryptocurrencies given their volatility. We strongly advise our readers to conduct their own research when making a decision.
