Latest news about Bitcoin and all cryptocurrencies. Your daily crypto news habit.
When I was building the “My Lineup” app, I started to dabble in performance monitoring. I explained in a previous blog post for Hacker Noon the basics of how I got that app up and running but this post will focus on how you can use the tools right in your browser to make sure your app is running to the best of its ability.
Back end — NewRelic
For the back end of my project, I used NewRelic to monitor performance. NewRelic is fairly user-friendly and requires a little set up to get it running (install instructions here). It is available for a number of languages, including Ruby, Python and Node.js. I was using it with Ruby so all I needed to do was install the NewRelic gem with gem 'newrelic_rpm'.
Then you need to create an application on NewRelic and download a new newrelic.yml file. Copy the newrelic.yml file into the config sub-directory of your application and change the name to your app’s name. Now you’re ready to rock! 💃🏽
When you load the NewRelic dash for your application you get a ton of information about your app and how it’s running. Note: NewRelic runs on PST so it may be a little confusing for you if you’re not in that timezone.
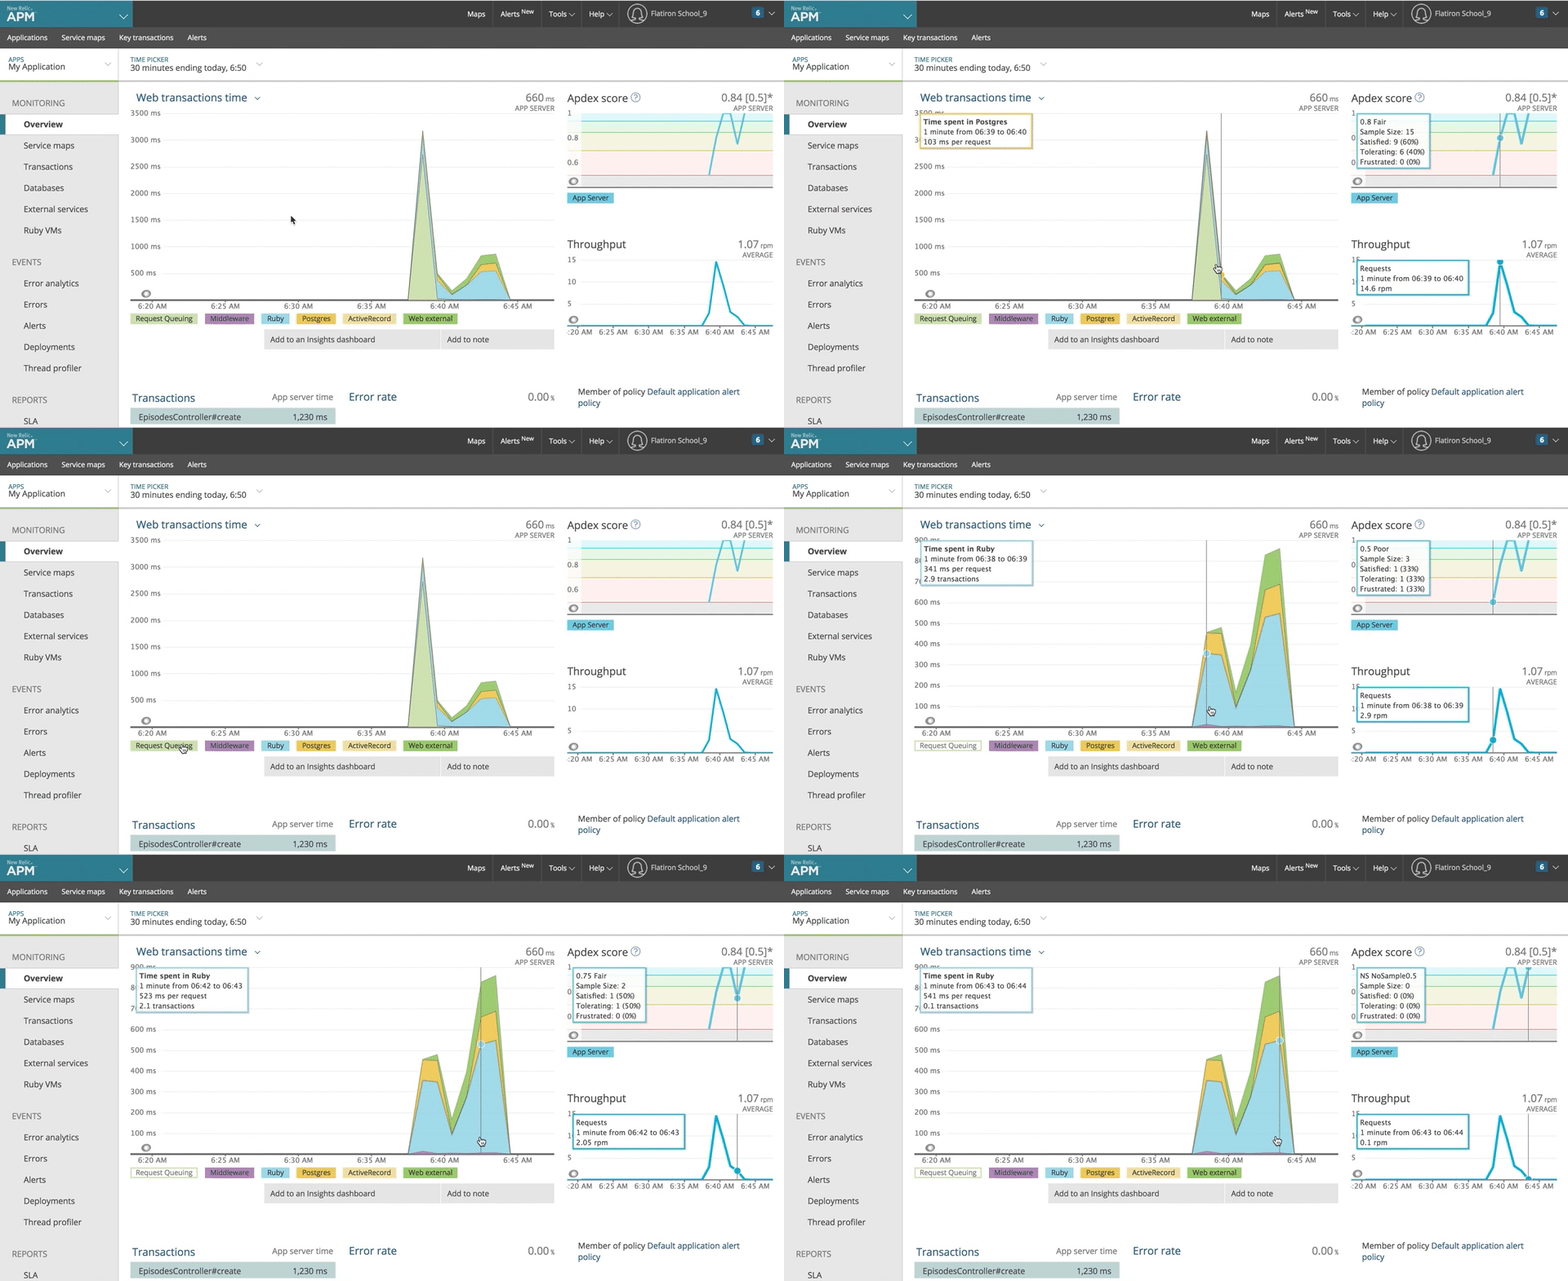
 This is the dash for my app. The graph shows information from when I was clicking around on the page, adding and removing shows.
Lots of time was spent in ‘Request Queuing’ because the app was asleep but luckily I can remove that from my data view and look at the other parts of my app, as shown above. This is the overview graph which just shows what is being run. You can see that most of the time is spent with Ruby code, but what code exactly?
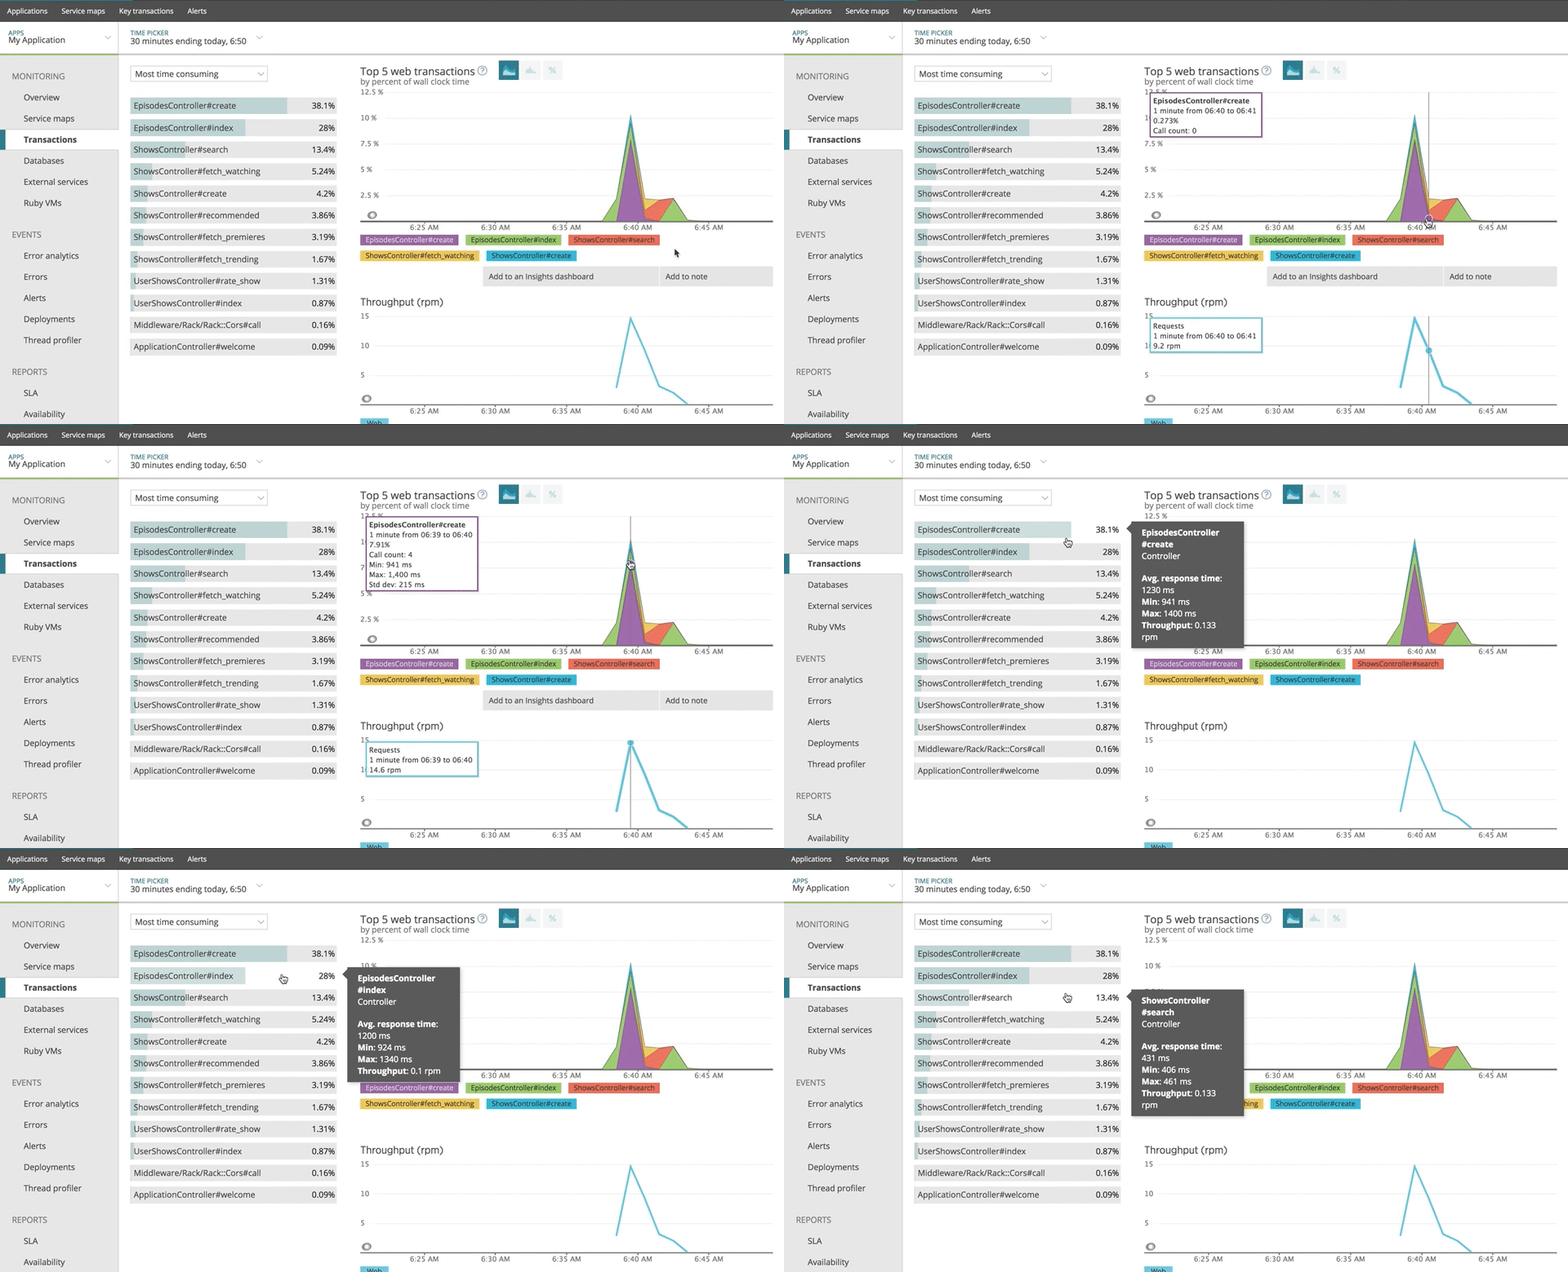
Click on Transactions and you can see exactly which methods are being called, which is very helpful.
 Breakdown of the methods from my various controllers that are the most time consuming.
You can see that EpisodesController#create is the most time consuming method, which makes sense. The creation of an episode requires several steps (it must check if the user has a show and then either create the show or add the episode to the show for the user). Also EpisodesController#index being the second most time consuming makes sense because some shows have a lot of episodes and loading them all takes time. If I had pulled up Law and Order: SVU, this would have probably been the most time consuming since it would have loaded over 500 episodes.
This is particularly useful because when I first used NewRelic I saw that these functions, along with ShowsController#index and #create, were being called far too often and taking too much time. I realized that I had called these functions almost every time a component loaded, even though they were already stored in the Redux store. I was making unnecessary calls and totally slowing down my app!
By changing my app so that these methods were only called upon loading or if something changed, I was able to drastically reduce the number of times they were called and also speed up the performance of my back end. Hooray!
NewRelic also has awesome error analysis, which I haven’t needed to use much. Most of the errors are my own creation and were ironed out in the development process. So far, NewRelic hasn’t caught any errors since I deployed the demo version, so let’s hope that keeps up! 🙏🏽
Front end — Chrome
Chrome is amazing for developers because they have so much functionality built right into the browser. In addition to the tools many of us know and love (looking at you, Console & Inspector!), Chrome also has performance monitoring built right in. This means it is much easier to set up because you just need to open your DevTools in the browser — no installation required! Google has more info on how to use here.
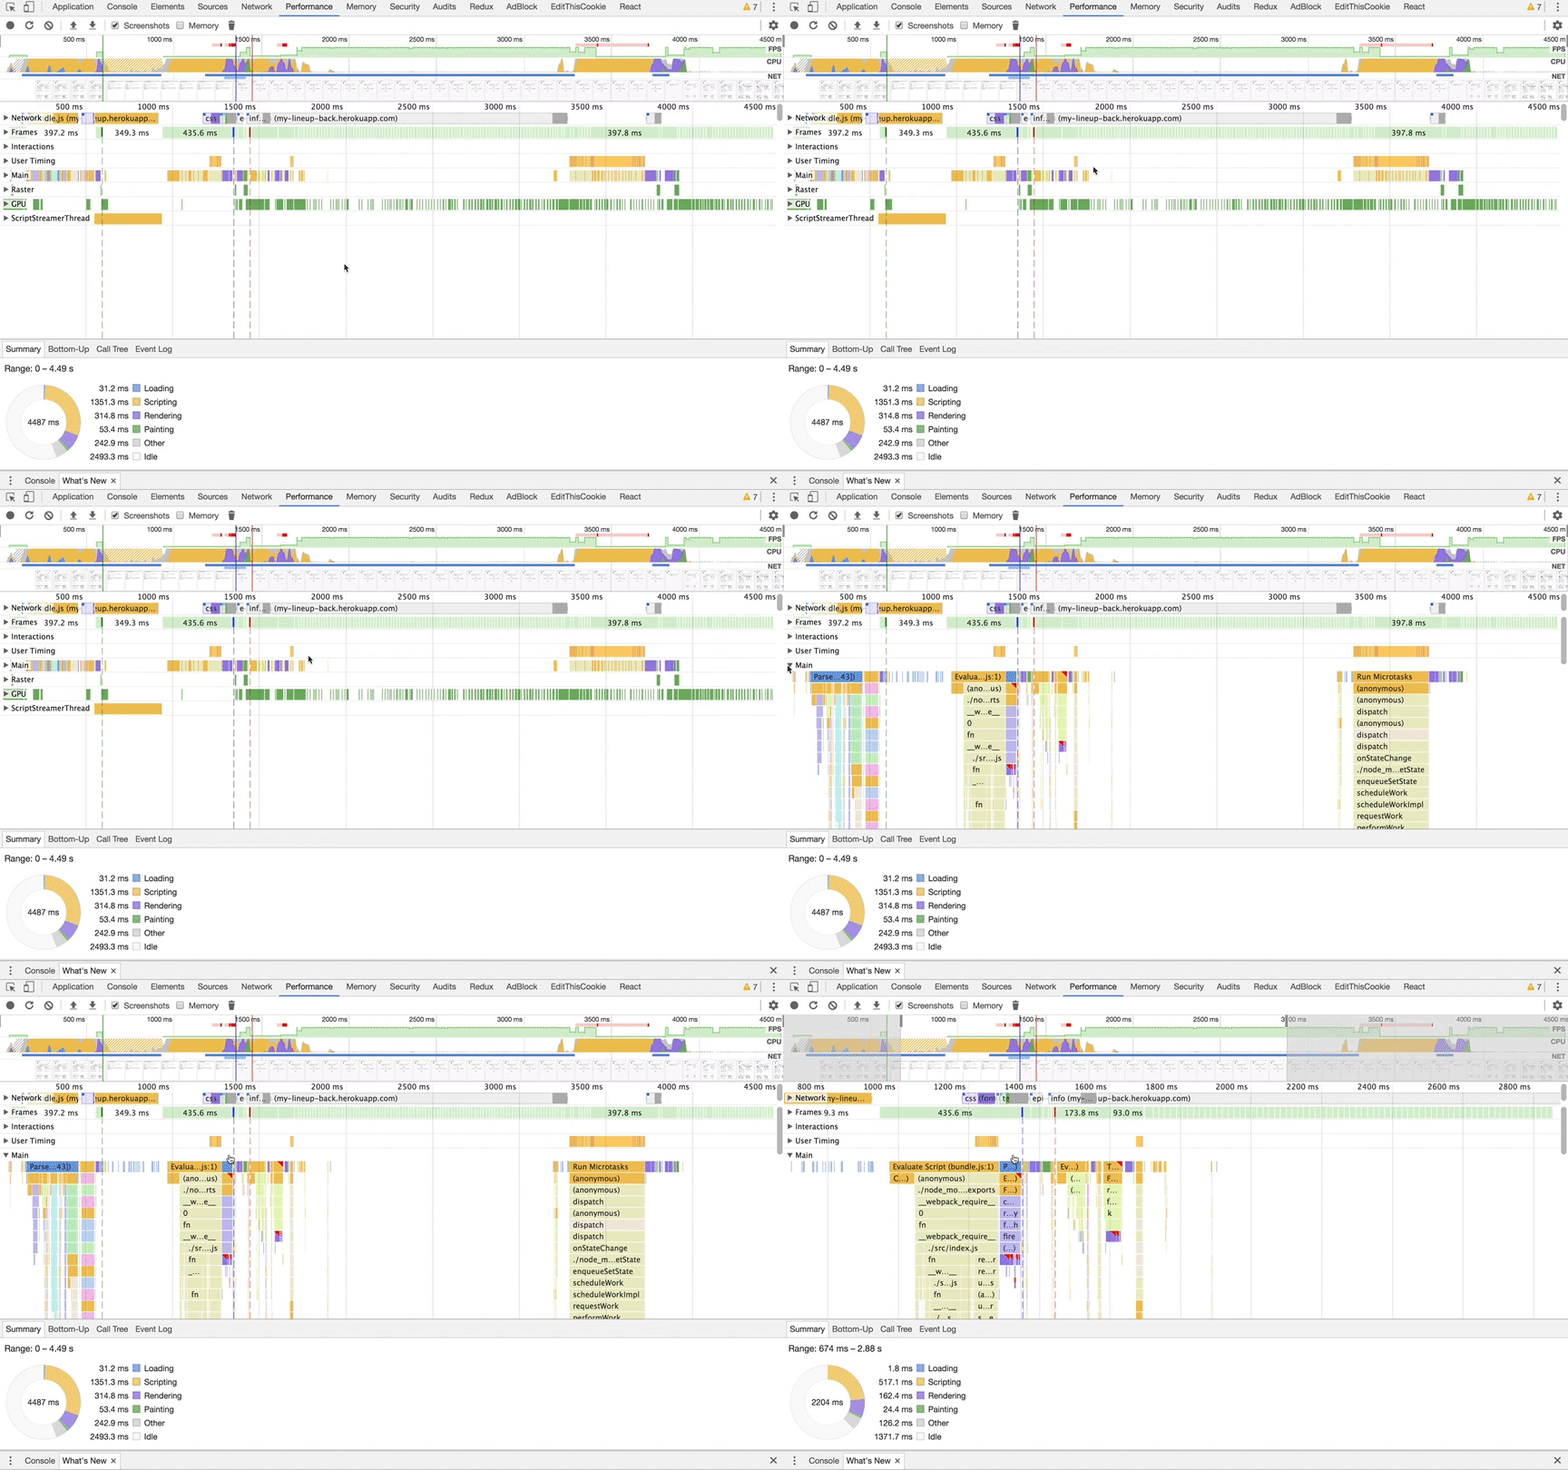
 Open DevTools, go to Performance, and click the Reload button. It then creates a profile of your app’s performance as it loads
After you follow the steps shown in the gif above, you will get neat charts and graphs displaying how the page loaded (with screenshots too!)
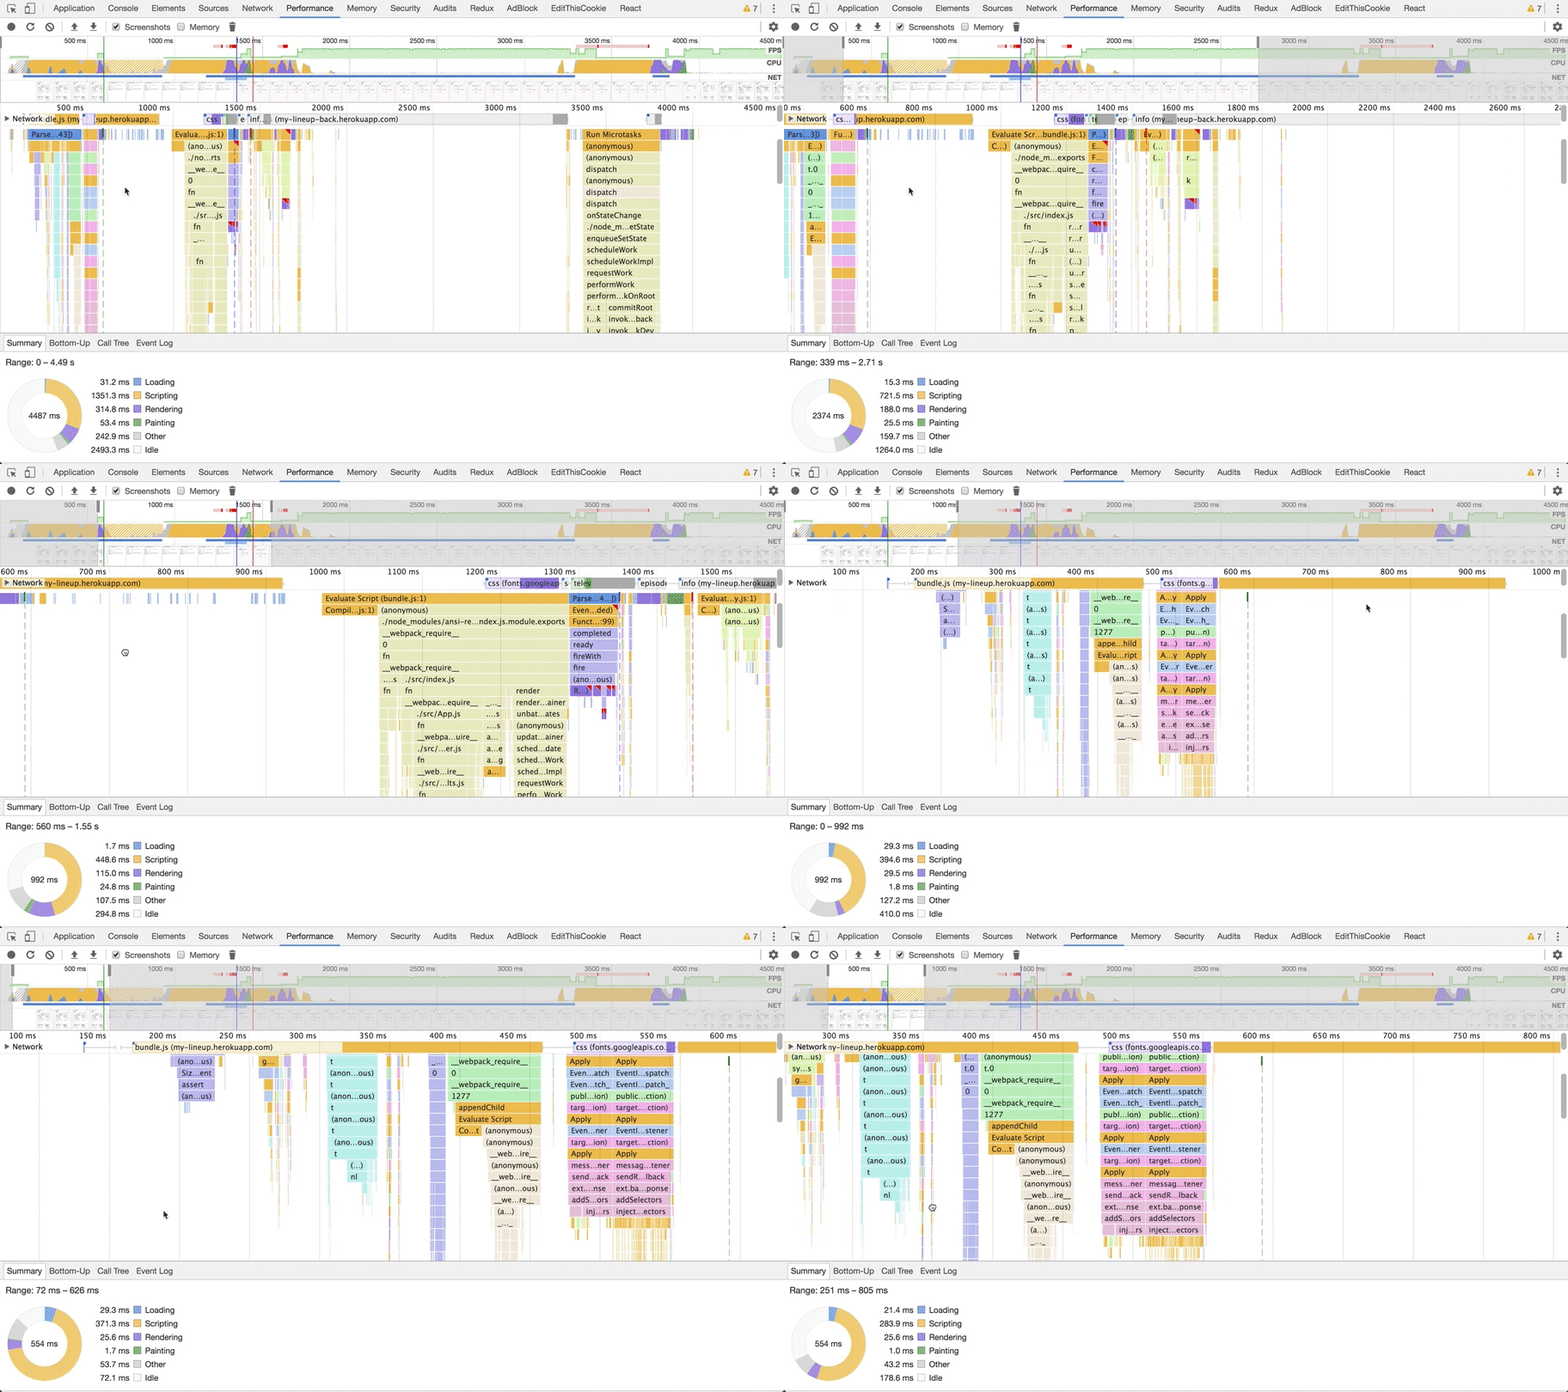
 Very detailed breakdown of every process that happened in order for page to load
 You can also zoom in and drag around the data to see exactly what’s happening. The summary at the bottom also updates as you zoom and move, which is quite cool 😎
The majority of my program’s time is spent ‘Scripting’ on the page, which is basically just all of the JavaScript functions that were called. So that’s good! Better that it’s spending time scripting than on other things.
Bottom-Up tells you what took the most time to aggregate, Call Tree shows what took the most work, and Event Log is, you guessed it, a list of all the events that happened in order.
Click around and look for any activities or functions that are especially time consuming. If they are something you can change, do it! Again I found some time consuming functions in my code (like unneccessary timers) and changed them to increase performance on my app.
If there are specific problem or slow areas in your app, you can also click the Record button and it will record everything you are doing on the app. I chose the Reload option because that was the slowest for me.
Conclusion
These tools are VERY helpful and as a new developer, I find it useful to learn about how to optimize performance because that is one of the most important parts of our job. If you are a newbie like me, explore these tools and get familiar with how to write clean readable code that also executes efficiently! Nobody wants to sit around waiting for something to load 🤓
Further Reading:
What is Application Performance Monitoring?
Application Performance Monitoring with NewRelic & Chrome 🧐 was originally published in Hacker Noon on Medium, where people are continuing the conversation by highlighting and responding to this story.
Disclaimer
The views and opinions expressed in this article are solely those of the authors and do not reflect the views of Bitcoin Insider. Every investment and trading move involves risk - this is especially true for cryptocurrencies given their volatility. We strongly advise our readers to conduct their own research when making a decision.