Latest news about Bitcoin and all cryptocurrencies. Your daily crypto news habit.

Key Takeaways
- Bitcoin RSI points toward an upward rerun.
- Analyst PlanB brands the move bullish.
- The metric comes as Bitcoin strives to reclaim $40,000.
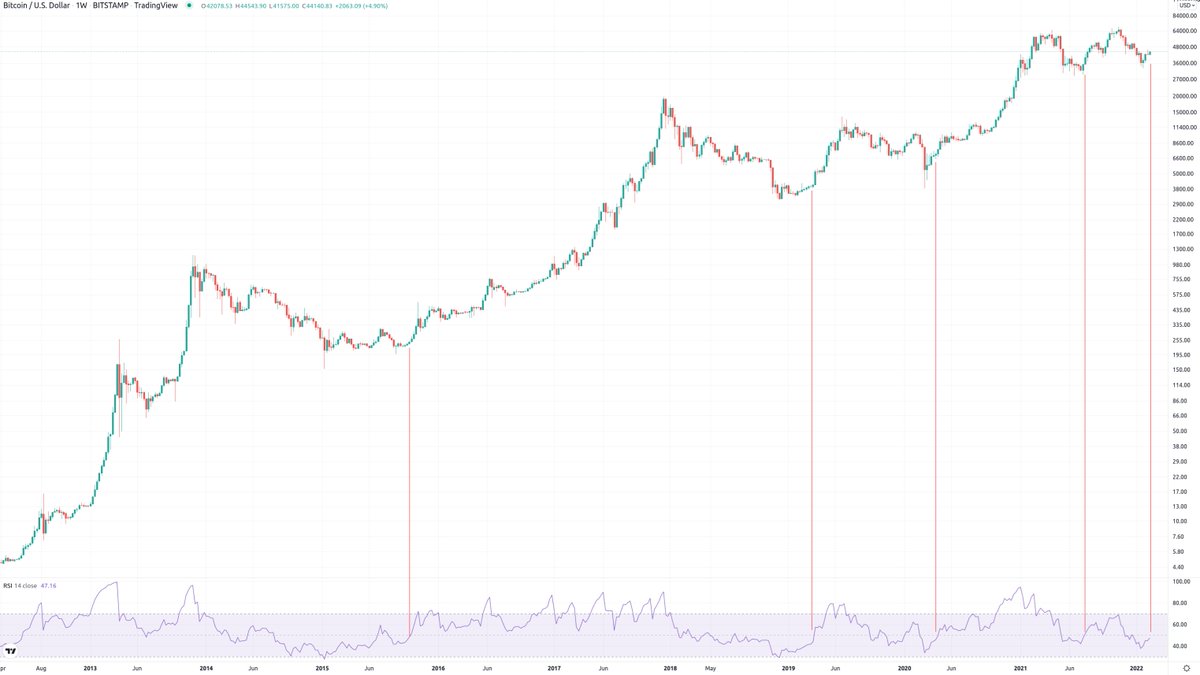
A look into the BTC chart with the RSI indicator proclaims glad tidings to BTC hodlers in a rather uncertain market.
The Relative Strength Index, or RSI, is an important momentum indicator in technical analysis that shows when an asset may be overbought or oversold.
The RSI has a single line that moves between two points – 0 and 100, with a midline of 50. Generally, a movement above 50 indicates that there are more buyers of an asset than sellers; a movement below 50 indicates that there are more sellers than buyers.
Current BTC RSI is around the value of 58 as at the time of writing, and while this could be objectively interpreted as being around the neutral zone, it indicates a patent recovery that would potentially guide the digital gold to a higher price level once again.
Swift Surge In The Near Term
Dutch investor and creator of the Bitcoin Stock-to-Flow (S2F) model, PlanB has noted this upcoming trend in a recent tweet.

Besides the RSI, Bitcoin’s recent upswing is just as well an indication of a potential bullish trend. The asset plummeted to around $33k sometime late January, engendering patent panic in the crypto space. It has since then recuperated, continually gliding up, and currently trading at $39k as bulls aim to reclaim $40k.
Forecasts within the crypto space are largely influenced by analysis and historical data. The latter is especially important as it assists traders in making informed decisions based on similar movements recorded in the past.
The market movement of BTC since its fall in late January has been a strong pointer to a gradual yet persistent recovery for the asset. BTC’s historical data shows a pattern that occurred sometime mid-last year: the asset plunged to a low of $28k mid-June last year but later shot up in a consistent comeback that saw it reach a peak of over $68k in November.
In addition to this, Santiment, a decentralized data feed for crypto investors, recently points to a potential uptrend for BTC in the near future taking into consideration technical and fundamental analysis within the crypto space.
While it is a given that the year has seen a disappointing start for BTC, especially with lots of notable investors forecasting a $100k price, it would not be the first time it “disappointed” the community and shook off a lot of “paper hands” before bouncing back.
However, it is important to note the recent price movements of the asset have indicated a powerful comeback. At this time, Bitcoin is still near $40,000, although weekly losses are nearing 10%.
Disclaimer
The views and opinions expressed in this article are solely those of the authors and do not reflect the views of Bitcoin Insider. Every investment and trading move involves risk - this is especially true for cryptocurrencies given their volatility. We strongly advise our readers to conduct their own research when making a decision.