Latest news about Bitcoin and all cryptocurrencies. Your daily crypto news habit.

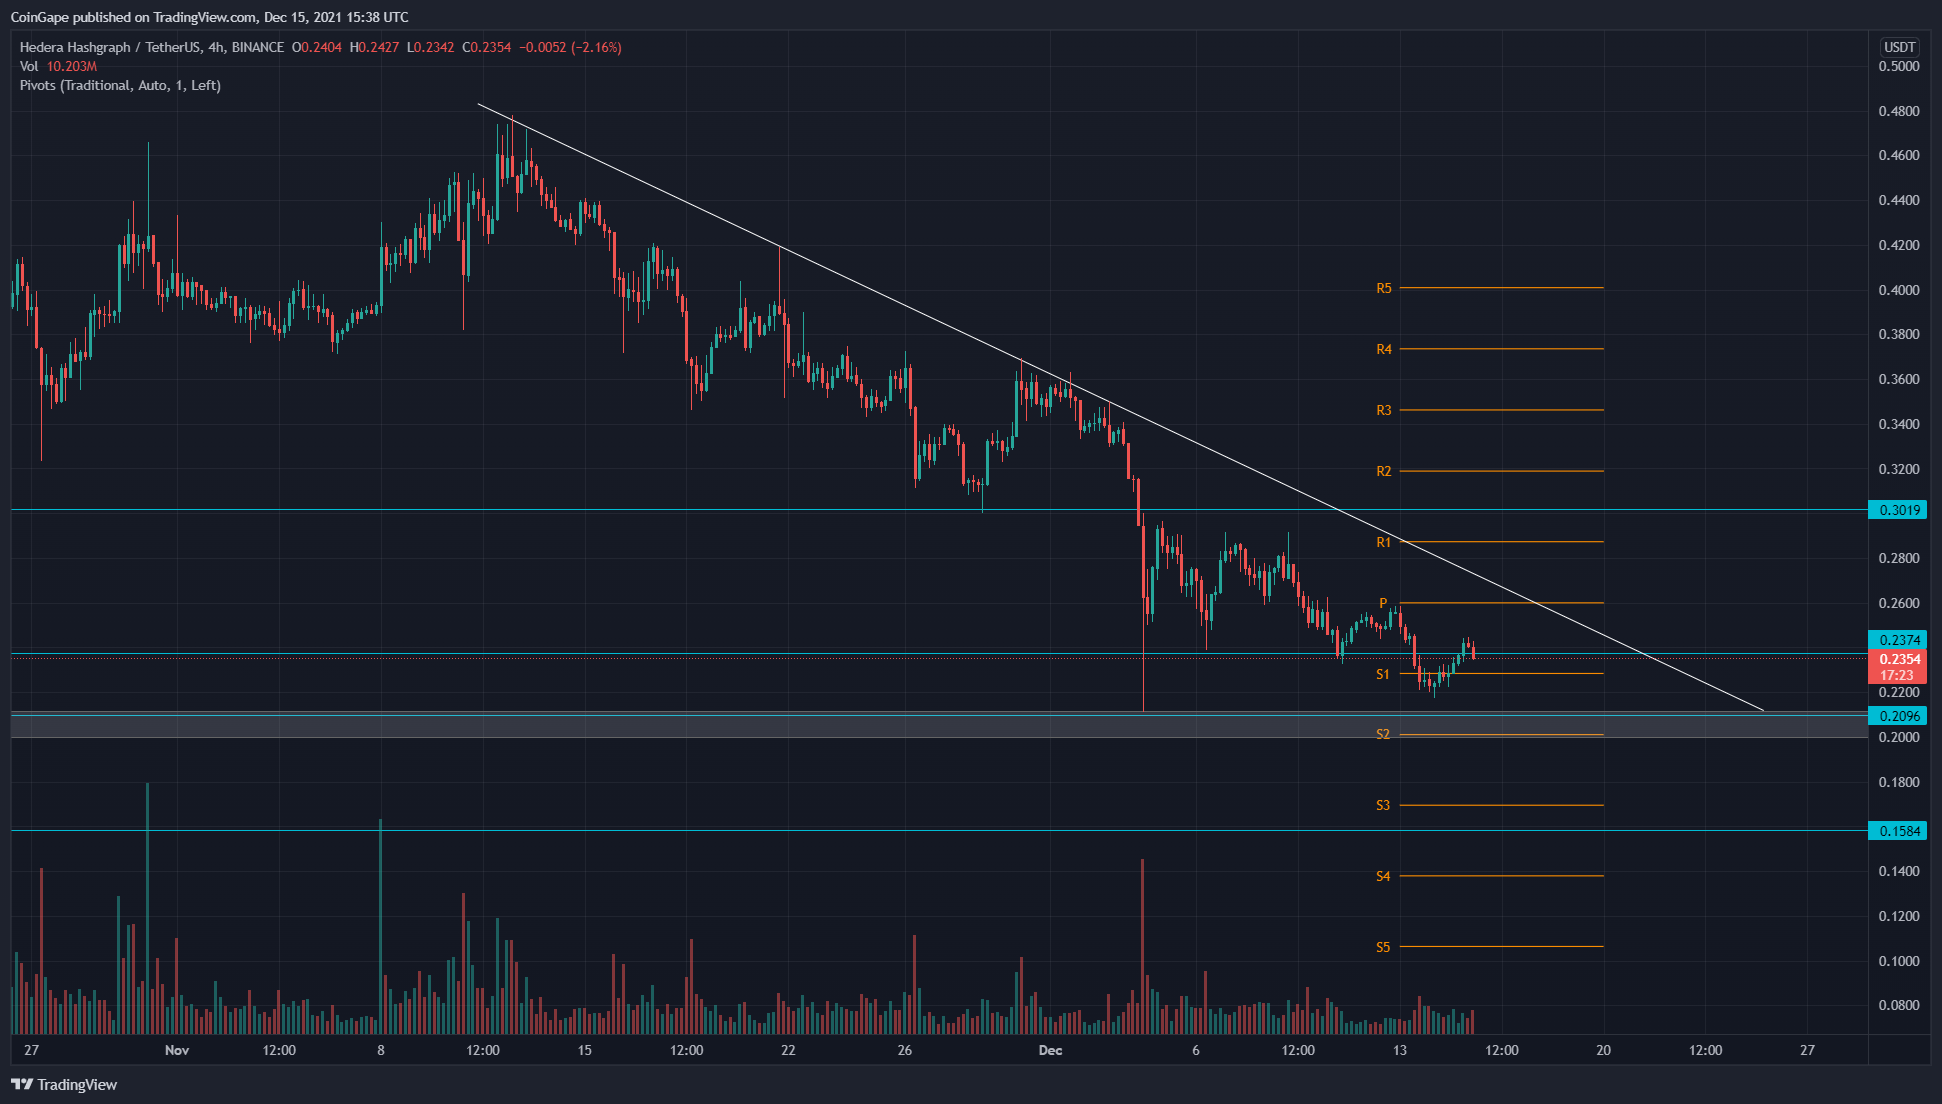
The HBAR coin is currently going through a correction phase that offers a 50% discount from its previous top of $0.473. A descending trendline is leading this retracement in the HBAR chart and could provide some great short opportunities until the line is intact
Key technical points:
- The HBAR coin price drops below the $0.237 support.
- The intraday trading volume in the HBAR coin is $56.1 Million, indicating a 15.53% loss.
Source- HBAR/USD chart by Tradingview
The last time when we covered an article on HBAR/USD, on November 18th, the coin price gave a decisive breakdown from a highly reliable trendline which carried a bull run from August to November. Thus, the price started moving lower, initiating a correction phase in this coin.
The coin chart showed a steady fall in its price which has recently breached another support level of $0.237. As for now, the coin has dropped 40% from the breakdown point and is currently trading at $0.234, with an intraday gain of $1.29%
The crucial EMAs (20, 50, 100, and 200) show a bearish alignment in this chart. Moreover, the 20 EMA provides dynamic resistance to the coin price. The daily Relative Strength Index (31) has indicated a significant fall in value, slowly approaching the oversold zone.
HBAR/USD 4-hour Time Frame Chart
Source- HBAR/USD chart by Tradingview
The HBAR coin is currently in a retest phase, trying to validate this new resistance of $0.237. If the price manages to sustain below this level, the coins will continue to move lower, where it will meet the next crucial support or psychological level $0.2.
However, in case of any bullish play, the crypto traders can maintain a bearish sentiment until the price doesn’t breach the resistance trendline leading to the correction phase.
As per the traditional pivot levels, the nearest resistance for the coin price is $0.26, followed by $0.286. As for the opposite end, the support levels are $0.228 and $0.2
The post HBAR Price Analysis: Descending Trend Line Could Extend This Correction For Hadera appeared first on CoinGape.
Disclaimer
The views and opinions expressed in this article are solely those of the authors and do not reflect the views of Bitcoin Insider. Every investment and trading move involves risk - this is especially true for cryptocurrencies given their volatility. We strongly advise our readers to conduct their own research when making a decision.

