Latest news about Bitcoin and all cryptocurrencies. Your daily crypto news habit.


Bakkt, the crypto trading platform which had limited offerings to Bitcoin BTC, recently announced the addition of Ether to its platform. In the announcement, the firms’ representative stated that they have met the necessary requirements and approvals and built the technology to start offering Ethereum on the Bakkt platform, which should go live in the coming weeks.
Bakkt also offers custody services and derivative trading in addition to retail offerings of Bitcoin and Ether.
Swedish financial regulator Finansinspektionen has called for the prohibition of energy-intensive crypto mining blockchains such as those of Bitcoin and Ethereum, stating that miners threaten Sweden’s ability to meet the Paris Agreement. The Swedish Environmental Protection Agency is also believed to share the same view as the regulator.
The crypto fear and greed index falls from level-73 to level-71 at press time and Last month’s extreme greed level was at level-76. Now, we expect traders to be more risk-averse if the index goes into extreme greed territories by the end of this month.
Let’s analyze the charts of the ETHBTC and ETHUSDT for insights into the trend direction.
Ethereum ETHBTC Monthly Chart Analysis
The above weekly chart of the ETHBTC shows growing demand for ETH vs. BTC ahead of Eth’s transition to ETH 2.0.
Current RSI values above level-25 and level-75 alongside a breakout above bearish inside-bar resistance [0.069138] after the close price of 01 August’21, confirms further price surge beyond the 01 May ’21 price peak.
Ethereum ETHUSDT Weekly Chart Analysis
The weekly chart of the ETHUSDT remains bullish following a hidden bullish divergence pattern that sets support at $1700.48.
A new all-time high is established and we anticipate an explosive demand for the ETH if the current week can close above the previous ATH [$4372.72] resistance.
Ethereum ETH Daily Chart Analysis
Hidden bullish divergence patterns confirmed a continuation of the uptrend as the relative strength index continues to print higher values above level-75 on the daily chart above.
The bears stand no chance as the growing demand for ETH smashes all resistance levels established by bearish divergence signals.
Let’s move down to the 4HR time frame.
Ethereum ETH 4HR Chart Analysis
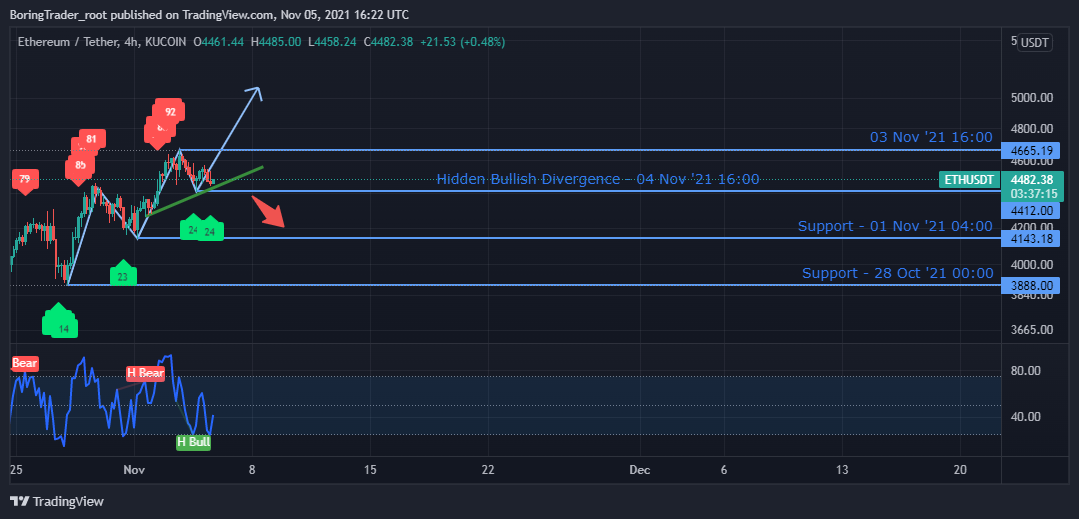
Rounding up our analysis on the 4HR time frame of the ETHUSDT, the crypto pair finds support above the 04 November 16:00 level [$4412.00] following a hidden bullish divergence pattern.
We expect a price hike from the current price levels to breach the $4665.19 resistance going into the coming week.
Ethereum ETH Intraday Level
- Spot rate: 4466.92
- Mid–Term Trend [H4]: Strong Bullish
- Volatility: High
- Support: $3888.00, $4143.18, and $4412.00
- Resistance: $4665.19
The post Ethereum ETH Price Analysis: Intraday Hidden bullish divergence signals trend continuation for the ETHUSDT appeared first on Coingape.
Disclaimer
The views and opinions expressed in this article are solely those of the authors and do not reflect the views of Bitcoin Insider. Every investment and trading move involves risk - this is especially true for cryptocurrencies given their volatility. We strongly advise our readers to conduct their own research when making a decision.


