Latest news about Bitcoin and all cryptocurrencies. Your daily crypto news habit.


- Ethereum price gradually loses ground to $3,000 as the MACD flashes a sell signal.
- The SuperTrend indicator spots a bearish signal, adding credence to the pessimistic outlook.
- Firm support at $3,000 will avert the potential losses to $2,800, thus allowing another recovery attempt to $4,000.
Ethereum price continues to lose more ground mid through the week’s trading. Earlier, the gigantic smart contract token had made haste above $3,300, but a barrier at $3,350 curtailed bullish efforts. Realize that Ether must bring down the stubborn seller congestion at $3,400 to have a fighting chance for gains heading to $4,000.
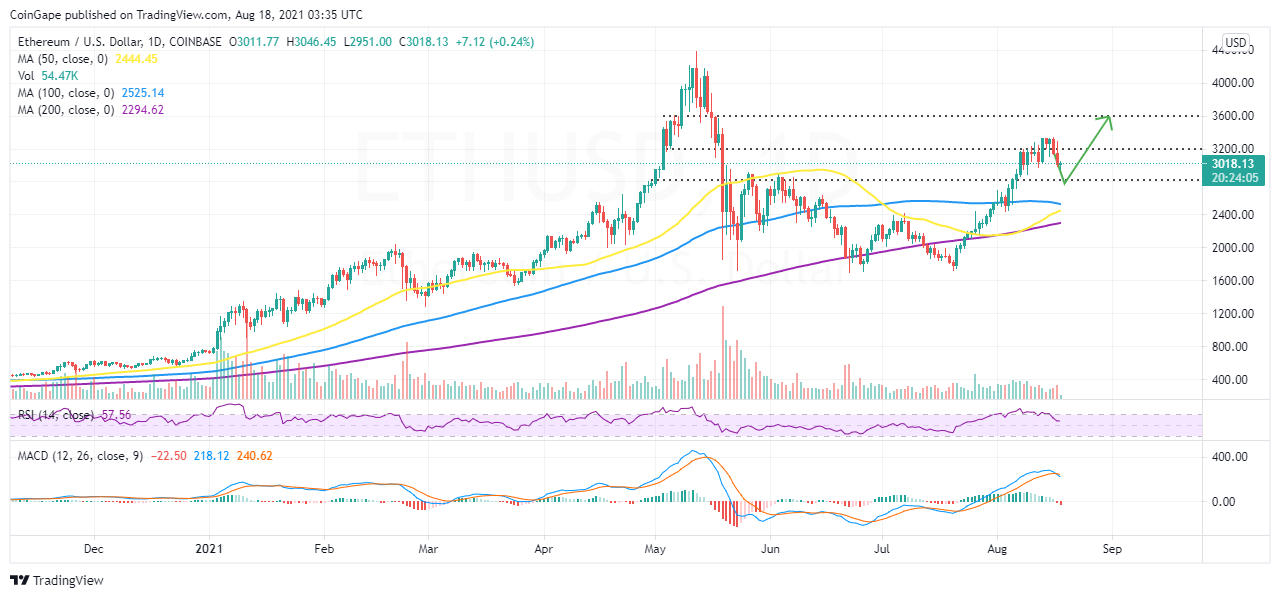
Meanwhile, ETH is trading at $3,025 after resting support at $3,000. Holding this support could eventually nullify the calls for declines to $2,800 and perhaps resume the uptrend.
Ethereum Price Deals With Rising Overhead Pressure
According to the daily chart, the Moving Average Convergence Divergence (MACD) has a bearish outlook, adding weight to the anticipated losses below $3,000. On Tuesday, the sell signal occurred as the 12-day Exponential Moving Average (SMA) crossed below the 26-EMA.
Ethereum will keep dropping as long as the MACD closes the gap back to the mean line. Traders can also watch out for increasing divergence between the EMAs, which will signify rising overhead pressure.
ETH/USD Daily Chart
Live Chart ETH/USD price chart by Tradingview
The Relative Strength Index (RSI) shows that bears are in the cockpit, and its movement under the midline would accentuate their grip on Ethereum.
Simultaneously, the SuperTrend indicator recently added credence to the bearish narrative, calling to sell ETH. This technical tool tracks Ethereum’s price like a moving average. However, it incorporates the average true range (ATR) in its calculations, thus gauging volatility. In turn, either a buy or sell signal is sent to help traders decide on entry and exit positions.
ETH/USD Four-Hour Chart
Live Chart ETH/USD price chart by Tradingview
A sell signal occurs when the indicator the SuperTrend closes the day below the price and manifests with the color changing from green to red. If the technical picture stays unchanged, investors can expect another drop in Ethereum price, perhaps $2,800. Note that the 100 SMA provides Ether with immediate support on the four-hour chart.
Ethereum Intraday Levels
Spot rate: $3,025
Trend: Bearish
Volatility: Low
Support: $3,000 and $2,800
Resistance: $3,200 and $3,400
The post Ethereum Price Analysis: ETH Falls Back On The Drawing Board, Can $3,000 Hold? appeared first on Coingape.
Disclaimer
The views and opinions expressed in this article are solely those of the authors and do not reflect the views of Bitcoin Insider. Every investment and trading move involves risk - this is especially true for cryptocurrencies given their volatility. We strongly advise our readers to conduct their own research when making a decision.